HAL Id: hal-02529278
https://hal.sorbonne-universite.fr/hal-02529278
Submitted on 2 Apr 2020
HAL is a multi-disciplinary open access
archive for the deposit and dissemination of
sci-entific research documents, whether they are
pub-lished or not. The documents may come from
teaching and research institutions in France or
abroad, or from public or private research centers.
L’archive ouverte pluridisciplinaire HAL, est
destinée au dépôt et à la diffusion de documents
scientifiques de niveau recherche, publiés ou non,
émanant des établissements d’enseignement et de
recherche français ou étrangers, des laboratoires
publics ou privés.
Sea-ice detection for autonomous underwater vehicles
and oceanographic lagrangian platforms by
continuous-wave laser polarimetry
Jose Lagunas-Morales, Claudie Marec, Edouard Leymarie, Christophe
Penkerc’H, Eric Rehm, Pierre Desaulniers, Denis Brousseau, Patrick
Larochelle, Gilles Roy, Georges Fournier, et al.
To cite this version:
Jose Lagunas-Morales, Claudie Marec, Edouard Leymarie, Christophe Penkerc’H, Eric Rehm, et al..
Sea-ice detection for autonomous underwater vehicles and oceanographic lagrangian platforms by
continuous-wave laser polarimetry. Ocean Sensing and Monitoring X, Apr 2018, Orlando, United
States. pp.34, �10.1117/12.2309571�. �hal-02529278�
See discussions, stats, and author profiles for this publication at: https://www.researchgate.net/publication/325163914
Sea-ice detection for autonomous underwater vehicles and oceanographic
lagrangian platforms by continuous-wave laser polarimetry
Conference Paper · May 2018
DOI: 10.1117/12.2309571 CITATIONS 0 READS 111 12 authors, including:
Some of the authors of this publication are also working on these related projects: ProValView project
NIRPS SpectrographView project José Lagunas-Morales
Laval University
14PUBLICATIONS 20CITATIONS
SEE PROFILE
Edouard Leymarie
French National Centre for Scientific Research 48PUBLICATIONS 296CITATIONS SEE PROFILE Claudie Marec Laval University 25PUBLICATIONS 99CITATIONS SEE PROFILE Christophe Penkerc'h Sorbonne Université 7PUBLICATIONS 17CITATIONS SEE PROFILE
PROCEEDINGS OF SPIE
SPIEDigitalLibrary.org/conference-proceedings-of-spieSea-ice detection for autonomous
underwater vehicles and
oceanographic lagrangian platforms
by continuous-wave laser polarimetry
José Lagunas, Claudie Marec, Édouard Leymarie ,
Christophe Penkerc'h, Eric Rehm, et al.
José Lagunas, Claudie Marec, Édouard Leymarie , Christophe Penkerc'h,
Eric Rehm, Pierre Desaulniers, Denis Brousseau, Patrick Larochelle, Gilles
Roy, Georges Fournier, Simon Thibault, Marcel Babin, "Sea-ice detection for
autonomous underwater vehicles and oceanographic lagrangian platforms by
Sea-ice detection for autonomous underwater vehicles and
oceanographic lagrangian platforms by continuous-wave laser
polarimetry
Jos´
e Lagunas
a, Claudie Marec
b,a, ´
Edouard Leymarie
c, Christophe Penkerc’h
c, Eric Rehm
a,
Pierre Desaulniers
d, Denis Brousseau
d, Patrick Larochelle
d, Gilles Roy
e, Georges Fournier
e,
Simon Thibault
d, and Marcel Babin
aa
Universit´
e Laval-CNRS, Takuvik (UMI 3376), 1045 Ave. de la M´
edecine, Qu´
ebec, Canada
b
Laboratoire d’Oc´
eanographie Physique et Spatiale (UMR 6523), CNRS IFREMER IRD
-UBO, Plouzan´
e, France
c
Sorbonne Universit´
e, CNRS, Laboratoire d’Oc´
eanographie de Villefranche, LOV, F-06230,
Villefranche-sur-Mer, France
d
Universit´
e Laval, Centre d’Optique Photonique et Laser (COPL), 2375 Rue de la Terrasse,
Qu´
ebec, Canada
e
Defence Research and Development Canada Valcartier, Val-Belair, QC G3J 1X5, Canada
ABSTRACT
The use of Lagrangian platforms and of Autonomous Underwater Vehicles (AUVs) in oceanography has increased rapidly over the last decade along with the development of improved biological and chemical sensors. These vehicles provide new spatial and temporal scales for observational studies of the ocean. They offer a broad range of deployment and recovery capabilities that reduce the need of large research vessels. This is especially true for ice-covered Arctic ocean where surface navigation is only possible during the summer period. Moreover, safe underwater navigation in icy waters requires the capability of detecting sea ice on the surface (ice sheets). AUVs navigating in such conditions risk collisions, RF communication shadowing, and being trapped by ice keels. In this paper, an underwater sea-ice detection apparatus is described. The source is a polarized continuous wave (CW) diode-pumped solid-state laser (DPSS) module operating at 532 nm. The detector is composed of a polarizing beam splitter, which separates light of S and P polarization states and two photodetectors, one for each polarized component. Since sea-ice is a strong depolarizer, the ratio P/S is an indicator of the presence or absence of sea-ice. The system is capable of detecting sea-ice at a distance of 12m. This apparatus is designed to be used by free drifting profiling floats (e.g., Argo floats), buoyancy driven vehicles (e.g., sea gliders) and propeller-driven robots (e.g., Hugin class AUV).
Keywords: Lidar, polarization, Sea-ice, AUV, Argo, Arctic, Amundsen, marine robotics
1. INTRODUCTION
In the Arctic Ocean, phytoplankton blooms occurs mostly at the ice edge, a receding ice-cover greatly affects
marine ecosystems.1 However, these impacts are yet to be fully understood. It is suggested that increased
stratification due to ice melt benefits small phytoplankton limiting energy transfer to higher trophic levels.1,2
Results suggest that increasing ice-free ocean regions may become more productive due to increased mixing
from intensifying Arctic winds1–3 . The dynamics associated with ice retreat during the summer translate into
technical challenges for the observation of these phenomena. Autonomous platforms such as lagrangian BGC-Argo floats, sea gliders and propeller-driven AUVs represent an opportunity for seasonal observation of chemical
and biological ocean properties.1
Further author information: jose-luis.lagunas@takuvik.ulaval.ca
Ocean Sensing and Monitoring X, edited by Weilin (Will) Hou, Robert A. Arnone, Proc. of SPIE Vol. 10631, 106310W · © 2018 SPIE · CCC code: 0277-786X/18/$18 · doi: 10.1117/12.2309571
300 m 100 m 1,2 m 20 cm 1000 m AMUNDSEN (bloom starts) Satellite NO STILLNO YES ! Parking Position 12 m NAOS FLOATS
WINTER - LONG CYCLE
(15 days)
SPRING - RISE SUMMER - SHORT CYCLE
(1 day)
Figure 1. Argo floats are fleet of nearly 4000 autonomous lagrangian platforms that drift along with the ocean currents measuring temperature and salinity . They descend the water column to a park depth at 1,000 m for 5 to 10 days, then profile upwards by first descending to 2,000 m depth before rising to the surface while sampling the water col-umn1,4,5 . Biogeochemical-Argo (BGC-Argo) are equipped with sensors that measure chemical and bio-optical properties
(Illustration: Julie Sansoulet, Takuvik)
Argo floats are fleet of nearly 4000 autonomous profiling floats that drift along with the ocean currents
measuring temperature and salinity1,4,6. They descend the water column to a park depth at 1,000 m for 5 to 10
days, then profile upwards by first descending to 2,000 m depth before rising to the surface while sampling the water column. At the surface, float location is determined by GPS, its position and stored data are transferred via a satellite link, and made available within 24 hours. An Argo-float may achieve 150 to 300 profiles during its
battery life, depending on its sensor load1,4,5,7,8. Available sensors measure chemical and bio-optical properties
such as dissolved oxygen, chlorophyll a fluorescence, particle backscatter, light, nitrate, and colored dissolved organic matter. Argo floats that are equipped with such sensors are known as Biogeochemical-Argo (BGC-Argo)
and they are an extension of the successful international Argo network9–13 .
Figure1describes the daily profile cycle of BGC-Argo floats deployed during the 2016 Green Edge scientific
mission in Baffin Bay with the goal of understanding the dynamics of the phytoplankton spring bloom and
determine its role in the Arctic14 . These floats belong to the CTS5-ProIce (Provor, manufactured by the
French company NKE) class and were developed by the Laboratoire d’Oc´eanographie de Villefranche-sur-Mer
(see affiliation) and Takuvik within the activities of the NAOS projetc, a French initiative for the next generation
of Argo floats.15 The frequency of the cycles was changed to augment the spatial and temporal resolution of
the sampling; all floats were deployed from the scientific ice-breaker C.C.G.S. Amundsen. An ice-covered ocean
presents challenges for underwater vehicles that must emerge to the surface to use satellite services.7,16 As
illustrated in 1, during the spring period the risk of colliding with sea-ice when emerging is a threat to the
security of the floats. A novel ice-detection system was installed in one of the BGC-Argo floats deployed during
the Green Edge project in 2016 (subsection3.2). In this paper, we describe the design, operation and performance
of such an underwater sea-ice detector apparatus based in laser polarimetry. It has been built to be used in Lagrangian platforms of the Argo and BGC-Argo types. It is as well suitable for other marine vehicles such as sea-gliders and propeller-driven AUVs.
2. SYSTEM DESCRIPTION
In this Section, an underwater sea-ice detection apparatus is described. The source is a linearly S-polarized continuous wave (CW) diode-pumped solid-state laser (DPSS) module operating at 532 nm. The detector is
composed of a polarizing beam splitter, which separates light of S and P polarization states and two
photodetec-tors, one for each polarized component. Since sea-ice is a strong depolarizer17,18 , the ratio P/S is an indicator
of the presence or absence of sea-ice. For an S-polarized laser source, once the ambient light contribution has been canceled at the receiver, a value P/S = 0 indicates a complete absence of ice, 0 < P/S < 1 denotes the presence of sea-ice and P = 1 denotes an unpolarized source.
2.1 Optics and mechanics
The design of the ice-detection system is based on the specific characteristics of BGC-Argo floats. Many types of free-drifting profiling floats are available commercially, in this document we will refer to the Provor class. Through an internal hydraulic subsystem, a float pumps 500 ml volume of oil in order to surface. This represents a floating or a sinking force lower than 500 g, meaning that the float can only break through very thin sea-ice, only a few millimeters thick. The additional weight and volume of an external body that is appended to the float is critical. Hydrodynamics and buoyancy should be considered in the design of the ice-detection sensors. It is also worth noting that the nominal vertical speed of an Argo float is 10 cm/s in ascent and roughly 2.5 cm/s in descent. The small positive buoyancy of the float leads to a large motion inertia. Consequently, the decision to abort a surfacing should be taken when the float is at least 10 meters below the sea-surface, thus stopping the ascent before the float collides with the ice-cover. Energy consumption is equally important. Argo floats are designed to be autonomous for 3 to 5 years (or 150-300 profiles), therefore; the ice detection system should be conservative in its energy use. Ice detection was attributed an estimated maximum budget of 100 mAh (10.8 V)
per profile7 .
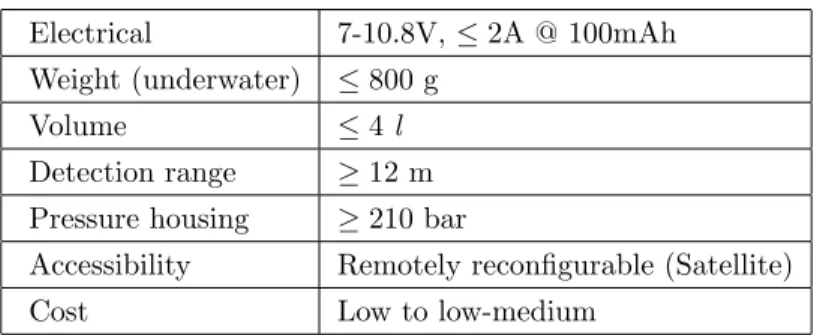
Table 1 summarizes the most sensitive aspects for Langrangian BGC-Argo floats. The sea-ice detection
system presented in this document is bounded by these severe restrictions, making of it an adequate candidate for most submarine vehicles operating in polar regions.
Table 1. Design constraints
Electrical 7-10.8V, ≤ 2A @ 100mAh
Weight (underwater) ≤ 800 g
Volume ≤ 4 l
Detection range ≥ 12 m
Pressure housing ≥ 210 bar
Accessibility Remotely reconfigurable (Satellite)
Cost Low to low-medium
2.1.1 Laser source
These design constraints set limits on the laser technologies available to be used in arctic marine environments.
The choice for a laser source was based on the analysis shown in Table 2, originally presented by Caimi and
Dalgeish19,20. The most important parameters for the choice of the laser source technology is to generate a beam
with the appropriate characteristics to travel across the marine optical path to the target and back to the receiver
side as shown in Figure2. The figure represents a laser source that generates a pulse or a beam directed to a
target of thickness w at a distance d. The pulse or beam is reflected/refracted and a detector located a the same distance d collects the reflected light signal. The detector and the source are physically separated by a distance L. The optical signal received by the detector is composed by the superposition of a near-field backscatter from
the laser source, water-column backscatter, forward scatter and the target reflection or line-of-sight (LOS)19,20.
A pulsed source such as a Q-switched laser provides a high peak power in the order of 6 KW and is fast enough so that the detector may discriminate between backscattering, water-column scattering and reflection from the target. A pulsed laser source offers the possibility of distance ranging using time of flight logic and source and
Table 2. Pulsed and continuous laser sources. The most important parameters for the choice of the laser source technology is to generate a beam with the appropriate characteristics to travel across the marine optical path to the target and back to the receiver side.
Objective CW Pulsed
Minimize water-column scattering
→ Needs source-receiver physical sepa-ration.
→ Pulse duration in ms.
→ Fixed focal length and depth of field
→ Can discriminate target reflection from column-water scattering.
→ Pulse duration in ps.
→ Source an detector may be co-aligned.
Laser energy → Consumer laser O($500).
→ Low mean power O(1W ). → Low voltage supply O(20W ).
→ Q-switched laser O($7K). → High peak power O(6kW ). → Medium voltage supply O(200W ).
Polarimetry (P/S) Subject to water-column scattering and
polarization effects over the optical path length
Discriminates accurately the target’s reflection
Range ≤ 15m 70 ≤ d ≤ 30 m
CPU/Logic → Low power micro-controller
O(25M Hz).
→ ADC O(100kbps).
→ High-speed logic O(200M Hz). → ADC O(2Gbps).
Challenges → Signal quality is subjected to the
wa-ter column inherent optical properties (IOPs).
→ Polarization quality may be temper-ature dependent.
→ High power consumption. → High cost.
→ High complexity.
→ Important volume and weight.
estimated system complexity, cost, weight and final volume are outside the constraints previously defined. A CW source is more sensitive to water column scattering, temperature, path-length depolarization effects and no distance ranging is possible. On the other hand a continuous wave (CW) laser source is low cost, has a low peak power, its volume is small and the system complexity is low. Moreover, a physical separation between the source
and the detector attenuates the effects of backscattering by improving contrast.20 In the ocean, a 532nm is the
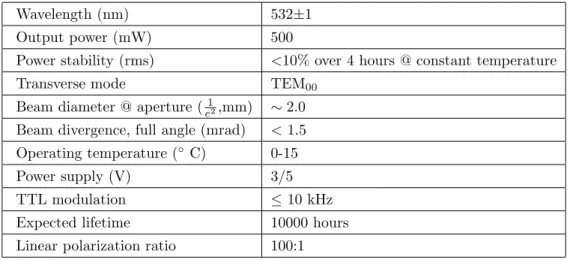
wavelength that offers the minimum absorption according to Pope et al.21 A 500mW DPSS laser module was
chosen as an alternative to the method proposed by Roy et al18,22 . The technical specifications of the chosen
CW laser source are listed in Table 3.
2.1.2 Detector
The non-coherent detector is composed of a focal lens, a filter, a polarizing beam splitter which separates light into two perpendicular polarization states S and P, were S is the parallel component to the incident laser. Two photodiodes measure the incident beams, one for each polarized component. Since sea-ice is a strong
depolarizer,18the ratio P/S, for an original S-polarized laser beam, is an indicator of the presence or absence of
sea-ice.
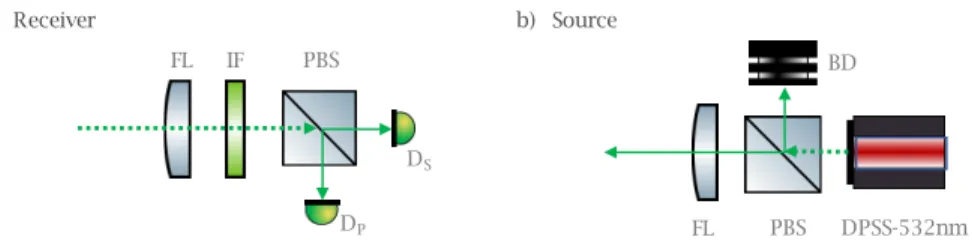
The linearly-polarized receiver is shown in Figure4. The f = 100 mm N-BK7 Plano-Convex lens (FL) is 1 in.
in diameter. The central wavelength (CWL) of the laser line filter (IF) is 532 ± 2 nm, with a full width at half
maximum (FWHM) of 10 ± 2 nm. The linear 1
2 in. polarizing beamsplitter cube (PBS) is coated 420 - 680 nm.
The perpendicular components S and P going out of the polarizer are received by two Texas Instruments OPT301
photodiodes (DS and DP) of size 2.29 x 2.29mm with internal transimpedance amplifiers, a high responsivity of
0.47A/W (650nm) and an operating temperature of -40 to 85◦ C. The focal length is compensated for optical
displacement induced by the filter and the beam splitter.23 The distance from the detector to the target is fixed
Table 3. CW laser source characteristics. A continuous wave (CW) laser source is low cost, has a low peak power, its volume is small and the system complexity is low.
Wavelength (nm) 532±1
Output power (mW) 500
Power stability (rms) <10% over 4 hours @ constant temperature
Transverse mode TEM00
Beam diameter @ aperture (1
e2,mm) ∼ 2.0
Beam divergence, full angle (mrad) < 1.5
Operating temperature (◦ C) 0-15
Power supply (V) 3/5
TTL modulation ≤ 10 kHz
Expected lifetime 10000 hours
Linear polarization ratio 100:1
A mounting collar was designed to achieve a physical separation of L = 400mm between the source and the
detector to efficiently reduce backscattering.19,20 It is used as well to provide a proper optical aligment, a tilt
angle of θ = 1◦ is needed in both source and detector. Finally it serves as a mechanical fixation for BGC-Argo
floats, the mounting collar is shown in Figure 5.
Watertight housings were manufactured by SubC Imaging in Nova Scotia. These pressure housings are
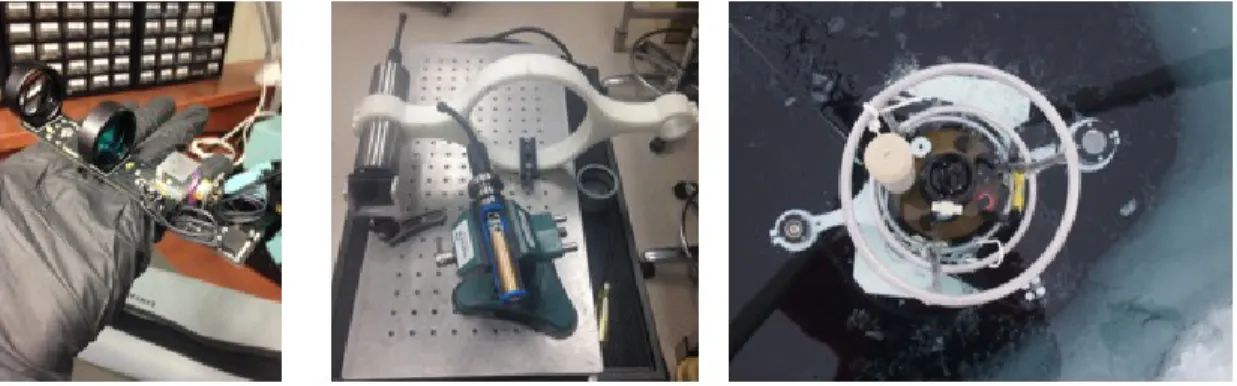
cylinder shaped, Titanium-made and are rated to 200 Bar (∼ 2000m). The pressure housing for the laser source belongs to the Skate class, it has an optical window of 19.45 mm, it is 145.5mm long and has a total diameter of 37.7 mm. The pressure housing for the detector belongs to the Sculpin class, it has an optical window of 24 mm, it is 190 mm long and has a total diameter of 54 mm. All connectors used were Subconn-type underwater pluggable. The laser source and the detector board were accurately center-aligned inside the pressure housings by ABS-printed internal mounting frames. The mounting collar and the pressure housings are shown in Figure
6. The ice detection system weights 600g in water (1Kg in air, w/cable) and dissipates a maximum of 25W @
1.8A (when lasing). The volume of the source and detector is ≤ 0.5 l and ≤ 0.4 l for the mounting collar for a total system volume of ≤ 0.9 l.
2.2 Signal processing and remote reconfiguration
Data acquisition, data conversion and signal processing are done by a 16-bit ultra low-power micro-controller of the TI-MSP430 family. When turned ON, the TI-MSP430F5529 micro-controller sits idle and waits for the command PWM ON to start the transmission of a number of data frames per second based on the following con-siderations. A PWM signal is used to control the laser source through the variables PWM ON and PWM OFF. The duty cycle is set by a variable called PWM DUTCYC going from 1 to 100 (corresponding to 1%-100%) and initially set to 50. A bandwidth of 100 kHz is required and the frequency will be changed through a variable called PWM FREQ, initially set to 10Hz. Two ADC12 channels are used to sample two external signals at a sampling frequency given by the variable ADC SAMPFREQ accepting values from 1 Hz to 50 kHz, initially set to 20 kHz. The conversion makes use of the internal voltage reference of the micro-controller which may be changed by the variable ADC REF which will take values [15 for 1.5v, 20 for 2.0 v, 25 for 2.5v] and initially set to 15. Sampling is achieved by alternating channels, i.e., when a sample has been taken in ADC channel 1, the next sample is taken in ADC channel 2.
At any time, the variable PWM OFF can be sent to the UART port, thus stopping the PWM signal and global functioning (the systems halts), this has a high priority. When halted, the rest of the variables maybe changed. PWM ON will return the system into normal operation. On the rising edge of the PWM signal, the ADC12 conversion begins alternating channels 1 and 2. On the falling edge of the PWM signal, ADC conversion stops. At this point, subsequently routines, namely: post-processing, data frame construction and
N
Cm
\
L Receiver Source d w Forward-scatter Back-scatter Target LOS Water-column scatter L: 400 mm d: 12 m 𝑤: ≥ 3 𝑐𝑚Figure 2. Underwater optical path and water-column scattering in polar environments as described by Caimi and Dalgeish in [7]. The optical signal received by the detector is composed by the superposition of a near-field backscatter from the laser source, water-column backscatter, forward scatter and the target reflection or line-of-sight (LOS).
S1 = 12m r/2 = 0.1747m f = 102mm à 100mm (FL) + 1.4mm (PBS) + 0.6mm (IF) S2 = 103mm α/2 = 0.8343 deg. hS,P= 3mm hS s2 f s1 r/2 α/2 hP
Figure 3. Field of view and angle of view. The focal length is compensated for optical displacement induced by the filter and the beam splitter. The distance from the detector to the target is fixed to s1= 12m.
offset calculation follow. The average value of the samples is computed for each of both channels, to achieve this, real time successive addition of the captured samples is performed. Each sample taken in a particular channel is added to the previous one, needing only to stock one value in memory. The resultant value is divided by the number of samples taken which are counted during the sampling process. This is done for both channels, the
LII
0
\
i
II i I iji
PBS IF FL DS DP a) Receiver FL PBS DPSS-532nm BD b) SourceFigure 4. Source and detector. The f = 100 mm N-BK7 Plano-Convex lens (FL) is 1 in. in diameter. The central wavelength (CWL) of the laser line filter (IF) is 532 ± 2 nm, with a full width at half maximum (FWHM) of 10 ± 2 nm. The linear 1
2 in. polarizing beamsplitter cube (PBS) is coated 420 - 680 nm. The perpendicular components S and P going out of the polarizer are received by two Texas Instruments OPT301 photodiodes (DS and DP) of size 2.29 x 2.29mm with internal transimpedance amplifiers, a high responsivity of 0.47A/W (650nm) and an operating temperature of -140 to 85◦C.
Figure 5. Mounting collar in HDPE, serves three purposes: mechanical fixation to the BGC-Argo float, physical separation of 400 mm between the source and the detector and provides a tilt angle θ = 1◦for proper optical alignment between the source and the detector.
resultant values are stored in float-type variables AVCHANN1 (P component) and AVCHANN2 (S component), respectively.
Once the average of the samples is computed a logarithmic ratio is formed . A data frame is constructed and sent through the UART serial port. Finally, a second and shorter sampling-averaging process is executed, the resulting value is then used in subsequent iterations, details below. Once the average from ADC channel 1 and 2 are computed, the next expression is formed and stored in a float variable:
DEP OL RAT IO = AV CHAN N 1 − AV OF F S1
AV CHAN N 2 − AV OF F S2 (1)
Variables AVOFFS1 and AVOFFS2 are computed at the end of the post-processing stage. As soon as the post processing routine is over, a data frame is formed. It consists of a header and three fields, the header and each field are composed of 4 bytes of information coded in ASCII characters. Each filed is separated by a comma and the end of the string is indicated by a semi-colon, ie.,
header, AV CHAN N 1, AV CHAN N 2, AV OF F S1, AV OF F S2, DEP OL RAT IO; (2)
The transmission is made via serial protocol at a default speed of 115200 bps, this value may be changed as desired. An Offset calculation routine is activated once the transmission of the data frame has concluded. It
consists of a second round of sampling and averaging in both ADC channels 1 and 2 as previously done. The results will be stored in float-type variables AVOFFS1 and AVOFFS1, respectively to be used in future iterations of the algorithm.
The settings of the ice detection system may be reconfigured remotely at any given time of a vehicle’s mission given that an Iridium connection is available. A number of parameters are available:
1. ADC SAMPFREQ: 1 to 50000 Hz
2. ADC REF: 15 for 1.5V, 20 for 2.0V and 25 for 2.5V, default is 15 3. OFFSET ON: enables offset measurement and subtraction 4. OFFSET OFF: disables offset measurement and subtraction 5. PWM FREQ: 1 to 100000, set to 10
6. PWM DUTCYC: 1 to 100
7. START CONV: enables ADC conversion 8. STOP CONV: disables ADC conversions
9. PWM ON: Starts PWM signal and starts system 10. PWM OFF: Halts PWM signal and entire system
3. PERFORMANCE
Tests were conducted both at the surface (air as propagation medium) and underwater (water as propagation medium). The targets used were sea-ice sheets of different thicknesses, polystyrene, High-density polyethylene (HDPE) and Spectralon. Filters used for eye protection: Filter KTP, wavelength 532m, OD 6 and Filter RBA, wavelength 633-635nm, OD 2. The surface studies took place at the COPL (see affiliation) and the underwater
tests were conducted at the Institute Maritime du Qu´ebec (IMQ) in 2016. For the underwater experiments a
swimming pool of 13m long was used horizontally to submerge the ice detection system. The distance from the system to a given target was set to 12m unless otherwise stated.
Figure 6. The image to the left shows the optics and electronics of the detector. The central image shows the pressure housings in Titanium and the HDPE mounting collar. The image to the right shows the se-ice detection system mounted on a BGC-Argo float deployed in the Arctic Ocean.
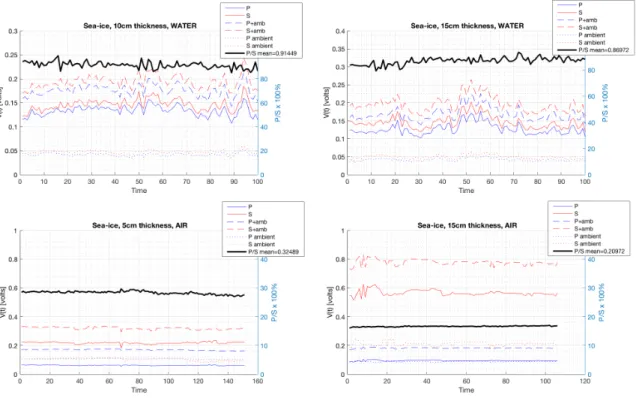
In this section, P is the p component reflected/refracted from the target, S is the s component reflected/refracted from the target, P ambient is the p component of the ambient light, S ambient is the s component of the ambient light. P+amb is the superposition of the p component as reflected/refracted by the target and the p component of the ambient light. S+amb is the superposition of the s component as reflected/refracted by the target and
0.3 0.25 0.2 0.15 > 0.1 0.05
Sea -ice, 5cm thickness, AIR
S P +amb S +amb P ambient S ambient P/S mean = 0.32489 40 20 0 20 40 60 30 100 120 140 160 Time 0.4 0.35 0.3 0.25 0.2 > 0.15 0.1 0.05 0.8 0.6 >0.4 0.2
Sea -ice, 15cm thickness, WATER
P S - - P +amb - S +amb P ambient S ambient P/S mean = 0.86972 V" MKl ` -
\
r
fp,\ iÀ\ s Ti11i®fE1twWm
.
MIME
10 20 30 40 50 60 Time 70 80 80 60 4 so 100the s component of the ambient light. P/S is the depolarization ratio. Unless otherwise stated, the horizontal axis represents time and the vertical axis represent both signal magnitude in volts (left) and a dimensionless
ratio (right). The radiant flux received (W
m2) by the photodiode per unit area is represented as the output signal
of the transimpedance amplifier used and is given in volts. For the purpose of this document it is enough to mention that the voltage responsivity of the photodiode is a logarithmic function of the incoming radiant power or irradiance.
3.1 Surface and underwater measurements
Figure7 shows the performance of the detector when measuring two ice-sheets of 10cm and 15cm, both in air
and underwater. All four cases represent the signals received by the detector in a period of time. The test for a 10cm-thick sheet of ice in air results in a depolarization ratio mean of P/S = 0.32489, for the same thickness the underwater experiment resulted in a mean of P/S = 0.91449. Similarly, for the 15cm-thick sheet of ice tests in air the resultant mean is P/S = 0.20972 and for the underwater case the mean was found to be P/S = 0.86972. The polarization ratio of the two different thickness (10 and 15 cm) is different implying that there is a relation between the thickness of the ice and the degree of linear polarization (DOLP) of the reflected beam. In our results, a slightly bigger depolarization ratio is found for the 10cm sea-ice sheet than that of the 15cm-thick.
Figure 7. Performance of the detector when measuring two ice-sheets of 10cm and 15cm both in the surface and underwater. A slightly bigger depolarization ratio is found for the 10cm sea-ice sheet than that of the 15cm-thick. This is explained due to the nature of the experiments, the characteristics of the CW laser source and a non-coherent detection phase at the receiver.
Roy et al.18,22 presented an underwater fiber-optic lidar for the characterization of sea water and ice
prop-erties. The results found therein indicate ice is a strong depolarizer of light and that a thicker sheet of ice will produce a slightly greater depolarization ratio. The difference between the results for the detection system
de-scribed in this document and that of the system presented in [7] are explained by the nature of the experiments.
For the underwater tests of our ice-detection system, the optical path for the target was set to 12m while the total length of the pool was 13m. Sea-ice samples rapidly become translucent when submerged in a pool at
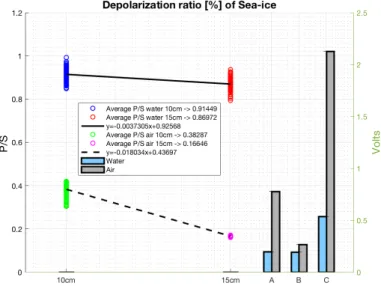
1.2
0.8
Depolarization ratio [0/ ] of Sea -ice
0.6 -. a 0.2 O Average P/S water 10cm -> 0.91449 O Average P/S water 15cm -> 0.86972 y= 0.0037305x +0.92568 O Average P/S air 10cm -> 0.38287 O Average P/S air 15cm -> 0.16646 y=- 0.018034x +0.43697 =Water
=Ar
.
-e 10cm 15cm A B C 5 0.5 N O >24 deg. C. When the ice is thin enough, the laser beam passes through the sample with little scattering and reflection/refraction, thus reaching the back of the swimming pool which is in turn perceived by the detector. A greater depolarization for a thinner sheet of sea-ice is accounted for by the superposition of the light reflected by the wall of the swimming pool and the light reflected/refracted by the sample itself. In the case of the air exper-iments a similar phenomenon is observed. The results also indicate that the depolarization ratio is greater for the underwater experiments due to the inherent optical properties (IOP) of the environment and the CW nature
of the laser source24. For a CW laser source, the signal received at the detector is the superposition of
backscat-tering, water-column scatbackscat-tering, reflection from background objects and reflection from the target17–20,22,25,26
.
Figure 8. The solid and dashed lines represent the decreasing slope of the depolarization ratio from a thinner to a thicker sea-ice sample in the surface and underwater experiments respectively.The bars to the right represent the magnitude in volts of the signal reflected/refracted by the ice samples of 15cm, 10 cm and by a sheet of polystyrene respectively in both air and underwater.
Figure8 illustrates this behavior from a different perspective. The solid line represents the increasing slope
of the depolarization ratio from a thicker to a thinner sea-ice sample in underwater experiments. The red markers are the events of an experiment for a sea-ice sheet of 15cm and the blue markers for the outcome for an experiment with a 10cm-thick sea-ice sample. Similarly, the dashed line represents the slope for experiments in air, the pink markers are associated with the outcome of an experiment with 15cm-thick ice samples and the green markers for those of 10cm-thick ice samples. The bars to the right represent the magnitude in volts of the signal reflected/refracted by the ice samples of 15cm, 10 cm and by a sheet of polystyrene respectively in both air and underwater. As expected A is greater than B due to less forward scattering in both air and water, however the difference is less important underwater due to the superposition of the multiple scattering and reflections, as previously mentioned. The magnitude of C is higher in both air and water compared to ice since there is no albedo allowed by the polymer.
Further efforts will be conducted to reduce these effects by adding a second polarizing phase at the source for cleansing purposes in linear polarization, by exploring the choice of circular polarization and by investigating coherent detection techniques at the receiver. All of the above within the design limits imposed by the mechanical, volumetric and electrical constraints of autonomous underwater robotics.
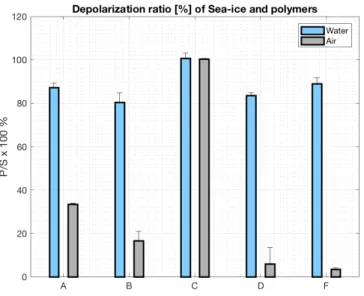
Figure 9 presents different values of depolarization ratios in air and in water for A: 10cm-thick sea-ice, B:
15cm-thick sea-ice, C:15cm-thick sea-ice for an unpolarized laser source, D: polystyrene and E: HDPE. A and B
120 100 80 60 40 20
Depolarization ratio F.] of Sea -ice and polymers
=Water
=Air
A B C D F
Figure 9. Different values of depolarization ratios both in air and in water for A: 10cm-thick sea-ice, B: 15cm-thick sea-ice, C:15cm-thick sea-ice for a unpolarized laser source, D: polystyrene and E: HDPE.
and water which translates into the same radiant powered for both s and p components at the detector. D and F are both polymers with birefringence indexes of 0,04 and -0,05 respectively.
In 2014, the first prototype of a CW laser ice detector was deployed under the sea-ice of the Arctic Ocean in the vicinity of Qikiqtarjuaq, Nunavut in the Canadian Arctic. The experiment was done during the activities
of the Vagabond-2014 oceanographic mission lead by the UMI Takuvik14,27 . Sampling took place during four
days of activities, between 13h00 and 16h00. Le Vagabond is a French sailboat conditioned to endure wintering in polar regions for scientific purposes, it was designed to be lifted when locked by sea-ice, thus avoiding the
crushing forces27 . The diameter of the optical components of this first generation was 2 inches, that is, two
times the size of the optical components of the system described in Section2, which is in turn the 3rd generation.
For these tests, one of the crew members dove to a depth of 12m and pointed the ice detection system to the sea-ice cover above. The experiment was done for a thickness ≥ 15cm.
Fig. 10 show the results for these experiments. A shows a depolarization ratio of P/S = 0.7649 for
mea-surements done to ice thicker than 15cm. B represents the performance of the ice detection system described in
Section 2 and shows a depolarization ratio of P/S = 0.7990 showing a similar performance of the two systems.
The signal levels for A are more important (approx. 10 times greater) than for B and this is accounted for the larger optical components in the 2014 design, however the depolarization ratio remains similar.
3.2 Sea-ice detection for BGC-Argo floats in the Arctic Ocean
In 2016, the ice detection system described in this document was installed on a Provor CTS5-ProIce
BGC-Argo float (see Section1) and deployed during the 2016 Green Edge scientific mission in Baffin Bay (Canadian
Arctic), on board of the scientific ice-breaker C.C.G.S. Amundsen. The general goal of the Green Edge Project
is to understand the dynamics of the phytoplankton spring bloom and determine its role in the Arctic.14 This
project spanned from 2014 to 2016 and was lead by the UMI Takuvik in collaboration with the Laboratoire
d’Oc´eanographie de Villefrance and the french NAOS initiative for the next generation of Argo floats.15 13
BGC-Argo floats were deployed during this period and the data is available in the Coriolis database28.
Figure 11 shows an ascending profile from the BGC-Argo float. Data from the Photosynthetically active
radiation (PAR curve, 400 to 700 nm) and the backscattering sensors (700 nm) are plotted along with the S+amb, P+amb, S ambient and P ambient values read from the ice detection system. The S+amb and the S ambient values describe the same curve and they closely follow the shape of the PAR curve. This is due to
0.9 0.8 0.7 0.6 0.5 o. 0.3 0.2 0.1
S, P and P/S ratio, Field tests 2014 and 2016
OP
pPis
AI
i
B 0.9 0.8 0.7 0.6 0.5 q2á
0.4 0.3 0.2 0.1 oFigure 10. A represents the experiments done with the first generation prototype in 2014 for a sea-ice thicknesses ≥ 15cm. B represents the experiments done with the third generation prototype in 2016 for a sea-ice thicknesses of ≥ 15cm.
the fact that the profile was done on august the 21st, 2016 and the Baffin Bay was free of sea-ice cover. Since no target reflects the linearly polarized laser beam, the return signal from the water-air interface is not strong enough to be captured by the detector. However the underwater polarization field can readily be observed by the difference of S ambient and P ambient. Throughout the photic zone, direct sunlight and scattered skylight are the major sources of underwater light, and both penetrate the water through Snells window. Except for elliptical polarization next to the margins of Snells window near the water surface, the light field under water
is predominantly partially linearly polarized.26 In Figure 12, the solid black lines describe the underwater
polarization field (ambient light). Several measurements of the ambient p and s components going from the period of 10-07-16 to 31-10-2016 from 20m to 10m are presented. Whereas the underwater polarization field
remains almost constant in time (slightly decreasing) in depth25,26,29, a mean value of P/S = 1.7468 i observed,
this denotes that the ambient underwater field is p-polarized. It is quite the opposite for the magnitude of the ambient light on a sea-ice free ocean. The magnitude of the ambient light components p and s are dependent in time and in depth with higher intensities at shallower depths and lower intensities in a later time of the year, respectively. No reflection from the air-water interface is detected by the receiver, this may be a consequence of the sensitivity of the photodiodes. Unfortunately, the BGC-float was lost during hibernation and results from the spring period of 2017 could not be recovered. Future deployments of the ice detection system are programmed for the fall of 2018 and the summer of 2019.
4. CONCLUSIONS
The design, operation and performance of a sea-ice detection system by CW laser polarimetry was presented in this document. It has been shown that the system successfully discriminates the presence or absence of sea-ice at at distance of 12m. Its mechanical, volumetric, electrical and functional characteristics were designed for compatibility with lagrangian platforms such as BGC-Argo floats and are suitable for other types of AUVs such as sea-gliders and propeller-driven. The overall cost of the system is low-medium, further efforts on reducing the cost of the pressure housings may contribute to reduce it further.
As discussed in Section 3, for a CW laser source, the signal received at the detector is the superposition
of backscattering, water-column scattering, reflection from background objects and reflection from the target. Further efforts will be conducted to reduce these effects by adding a second polarizing phase at the source for cleansing purposes in linear polarization, by exploring the choice of circular polarization and by investigating
10 -15 -20 -25 Ê ft -30 8 -35 40 -45 50 0
1/(m's() umol photon/(m2 s) x 1E6
0 0.5 1 1.5 2 2.5
x10-0
3 3.5 4
BB [1 /(m'SI)] PAR [umol photon /(m2 s)]
s+amb M -ME- P+amb M --...S ambient M ... ... P ambient M 0.5 1.5 Volts 2 2.5 -10 -15 -20 -25 -30 -35 -40 -45 3 50
-10 BGC -Argo float "Takapm0014b ", Baffin Bay, Fall 2016
ambP 07-10 - - ambS07-10 ambP 08-15 - - ambS 08-15 ambP 09-15 - - ambS 09-15 ambP 10-15 - - ambS 10-15 ambP 10-31 - - ambS 10-31 Average P/S -> 1.7468 Volts I P/S 2.5 3
Figure 11. In 2016 the ice detection system described in this document was installed on a BGC-Argo float and deployed during the 2016 Green Edge scientific mission in Baffin Bay (Canadian Arctic), on board of the C.C.G.S. Amundsen, a Canadian scientific Ice-Breaker. Data from the PAR and the backscattering sensors (700 nm) from the BGC-Argo float are plotted along with the S+amb, P+amb, S ambient and P ambient values read from the ice detection system.
Figure 12. The solid black lines describe the underwater polarization field of several measurements of the ambient p and s components going from the period of 10-07-16 to 31-10-2016 from 20m to 10m underwater. Whereas the underwater polarization field remains almost constant in depth and in time, the magnitude of the ambient light depends on depth and time in an ice-free ocean.
coherent detection techniques at the receiver. A new deployment will take place in which the sea-ice detection system will be mounted on a sea-lander which will be placed in shallow waters during 12 months in the Arctic. This experiment will provide information about the response of the detector to all the phases of seasonal ice formation and melting.
ACKNOWLEDGMENTS
The research for this paper was financially supported by the French National Center for Scientific Research
(CNRS), through their program for innovation and technology development D´efi Instrumentation aux limites.
The BGC-Argo floats deployed by Takuvik were financed by the Canada Foundation for Innovation and the NAOS project (Investissements d’avenir ANR-10-EQPX-40). We gratefully acknowledge the support of the
Arcticnet Network, Qu´ebec-Oc´ean, the Canadian Coast Guard crew of the C.C.G.S. Amundsen, the community
members of Qikiqtarjuaq (Nunavut) and France Pinczon du Sel et ´Eric Brossier from the polar yacht Vagabond,
without which the present study could not have been completed. In developing the ideas presented here, we have
received helpful input from Eric Rehm, Guislain B´ecu and Simon Lambert-Girard.
REFERENCES
[1] Fennel Katja, G. B., “Taking the Oceans Pulse: A Vision for the Canadian Biogeochemical Argo Program.” http://doi.org/10.13155/52451. 2017.
[2] Ardyna, M., M. B. et al., “Recent arctic ocean sea ice loss triggers novel fall phytoplankton blooms,” Geophys. Res. Lett. 41, 6207–6212 (2014).
[3] Arrigo, K. R. and van Dijken, G. L., “Secular trends in arctic ocean net primary production,” Geophys. Res. 116 (2011).
[4] Jayne, S. et al., “The argo program: Present and future,” Oceanography 30, 18–28 (2017).
[5] Riser, S. C., e. a., “Fifteen years of ocean observations with the global argo array,” Nat. Clim. Change 6, 145–153 (2016).
[6] Roemmich, D. and the Argo Steering Team, “Argo: The challenge of continuing 10 years of progress,” Oceanography 22, 46–55 (2009).
[7] Marec, C., “Deployment of biogreochemical profiling floats in the ice-edge zone of the arctic ocean: Devel-oping a sea-ice optical detection sensor for a safe navigation.” White Book for the internal use of the NAOS project. March 2012.
[8] Organelli, E. et al., “Two databases derived from bgc-argo float measurements for marine biogeochemical and bio-optical applications,” Earth Syst. Sci. Data 9, 861–880 (2017).
[9] Claustre et al., “Bio-optical Sensors on Argo Floats.” IOCCG report. 2011.
[10] Claustre, H. e. a., “Guidelines towards an integrated ocean observation system for ecosystems and biogeo-chemical cycles,” Sustained Ocean Observations and Information for Society 1 (2010).
[11] Claustre, H. e. a., “Bio-optical profiling floats as new observational tools for biogeochemical and ecosystem studies: Potential synergies with ocean color remote sensing,” Sustained Ocean Observations and Informa-tion for Society 2 (2010).
[12] Dortenzio et al., “White Book on Oceanic Autonomous Platforms for Biogeochemical Studies: Instrumen-tation and Measure (PABIM).” Mercator Quarterly Newsletter, 4. 2009.
[13] Group, B.-A. P., “The scientific rationale, design and implementation plan for a Biogeochemical-Argo float array.” http://doi.org/10.13155/46601.
[14] Takuvik, “Green Edge Project.” http://www.greenedgeproject.info/. [15] Naos, “Equipex Naos.” http://www.naos-equipex.fr/.
[16] Lee, C.M., J. T., “An autonomous approach to observing the seasonal ice zone in the western arctic,” Oceanography 30, 56–58 (2017).
[17] Perovich, D. K., “Observations of the polarization of light reflected from sea ice,” Journal of Geophysical Research 103, 5563–5575 (1998).
[18] Roy, G. et al., “Development of an underwater fiberoptic lidar for the characterization of sea water and ice properties,” Lidar Remote Sensing for Environmental Monitoring XIV 14 (2013).
[19] F.M. Caimi, F. D., “Performance considerations for continuous-wave and pulsed laser line scan (lls) imaging systems,” Rapi Publications 5 (2010).
[20] F.M. Caimi, F. D. et al., “Pulse versus cw laser line scan imaging detection methods: simulation results,” Proc. SPIE.
[21] Pope, R. M. and Fry, E. S., “Absorption spectrum (380700nm) of pure water,” Appl. Opt. 36, 8710–88723 (1997).
[22] Xiaoying Cao, Gilles A. Roy, R. B., “Lidar polarization discrimination of bioaerosols,” Optical Engineering 49 (2010).
[23] Greivenkamp, J. E., [Field Guide to Geometrical Optics ], SPIE Press Book, Electronic book (2004). [24] Morel, A. and Maritorena, S., “Bio-optical properties of oceanic waters: A reappraisal,” Journal of
Geo-physical research 106, 7163–7180 (2001).
[25] Shashar N., Sabbah S., C. T. W., “Transmission of linearly polarized light in sea waterimplications for polarization signaling,” J. Exp. Biol. 207, 36193628 (2004).
[26] Sabbah S., Lerner A., E. C. S. N., “Under water polarization visiona physical examination,” Recent Res. Dev. Exp. Theor. Biol. 1, 123176 (2005).
[27] Brossier, E., “Vagabond Polar Yacht.” https://vagabond.fr/.
[28] Ifremer, “Argo float data and metadata from Global Data Assembly Centre (Argo GDAC). Ifremer.” http://doi.org/10.17882/42182.
[29] Horv´ath G., V. D., [Polarized light in animal vision: polarization patterns in nature. ], Springer, Heidelberg,

![Figure 2. Underwater optical path and water-column scattering in polar environments as described by Caimi and Dalgeish in [7]](https://thumb-eu.123doks.com/thumbv2/123doknet/13557897.420048/9.918.214.699.109.633/figure-underwater-optical-column-scattering-environments-described-dalgeish.webp)