HAL Id: hal-01883582
https://hal.archives-ouvertes.fr/hal-01883582v2
Submitted on 13 Oct 2018
HAL is a multi-disciplinary open access
archive for the deposit and dissemination of
sci-entific research documents, whether they are
pub-lished or not. The documents may come from
teaching and research institutions in France or
abroad, or from public or private research centers.
L’archive ouverte pluridisciplinaire HAL, est
destinée au dépôt et à la diffusion de documents
scientifiques de niveau recherche, publiés ou non,
émanant des établissements d’enseignement et de
recherche français ou étrangers, des laboratoires
publics ou privés.
Localizing Atrial Flutter Circuit Using Variability in the
Vectorcardiographic Loop Parameters
Muhammad Haziq Azman, Olivier Meste, Kushsairy Kadir, Decebal Gabriel
Latcu
To cite this version:
Muhammad Haziq Azman, Olivier Meste, Kushsairy Kadir, Decebal Gabriel Latcu. Localizing Atrial
Flutter Circuit Using Variability in the Vectorcardiographic Loop Parameters. Computing in
Cardi-ology, Sep 2018, Maastricht, Netherlands. �hal-01883582v2�
Localizing Atrial Flutter Circuit using Variability in the Vectorcardiographic
Loop Parameters
Muhammad Haziq Kamarul Azman
1 2, Olivier Meste
1, Kushsairy Kadir
2, Decebal Gabriel Latcu
31
Universit´e Cˆote d’Azur, CNRS, I3S, France
2Universiti Kuala Lumpur, Malaysia
3
Cardiology Department, Centre Hospitalier Princesse Grace, Monaco
Abstract
Atrial flutter circuit localization is usually determined during a catheter ablation procedure. Knowledge of this information beforehand could aid clinicians assess and plan the operation in advance to improve efficacy. Variability as a marker to discriminate localization non-invasively was suggested in the literature, and evaluated by one group. However, variability may originate from respiratory motion which may affect right and left AFL differently. This is hypothesized to be the reason for differ-ence in right and left AFL variability. To address this, we analyzed the effect of removing respiratory motion influ-ence from f wave observations on classification accuracy. ECG records from patients with AFL were processed us-ing a novel approach: respiratory motion was estimated and removed in order to recover variability intrinsic to AFL. Vectorcardiographic loop parameters were estimated from each observation and statistical measures of the set of parameter values were calculated before being fed into a classification algorithm. The results show that f waves are negligibly affected by respiratory motion. It is also possi-ble to discriminate circuit localization with good accuracy.
1.
Introduction
Knowledge of the characteristics of macro-reentrant tachyarrhythmia is crucial for a successful and quality catheter ablation: an increasingly popular treatment today, targeted towards atrial fibrillation and atrial flutter (AF and AFL). This information, however, is accessible only during the procedure itself. In the case of AFL, one significant in-formation is the localization of the circuit: either the left or right atrium. The ability to estimate circuit localization prior to the procedure could aid clinicians in pre-operative assessment and planning in order to improve procedural efficacy.
The most common form of AFL is called typical AFL, associated with several stereotypic characteristics (right
atrial localization and passage by a set of stable, well-defined obstacles). Atypical AFL is well-defined as any circuit that do not match one or either of the criteria. Both forms are observable via the electrocardiogram (ECG), allowing for a non-invasive analysis and estimation of the character-istics. As a result, information regarding the pathology can be made available without additional invasive operations. It was found that spatiotemporal coherence can predict a left localization with 84% sensitivity and 75% specificity [1]. Many other studies suggest its association with lower atrial activity regularity, and hence larger variability.
On the other hand, respiratory motion affects the ECG signal by shifting the electrical axis of the cardiac dipole. This is introduces artificial variability and it may be a rea-son why discrimination between right and left AFL was possible: consider the different location of the right and left atrium in the thoracic cavity. Right AFL may be af-fected differently than left AFL. If this variability is the ori-gin of the difference between right and left AFL variability, then if removed, we expect right and left AFL to present similar variability, and hence cannot be discriminated. If it is not the origin of the difference, then removing its con-tribution may affect right and left AFL variability, but dis-crimination could still be done reliably. We aim to test this hypothesis by employing several novel approaches.
2.
Methodology
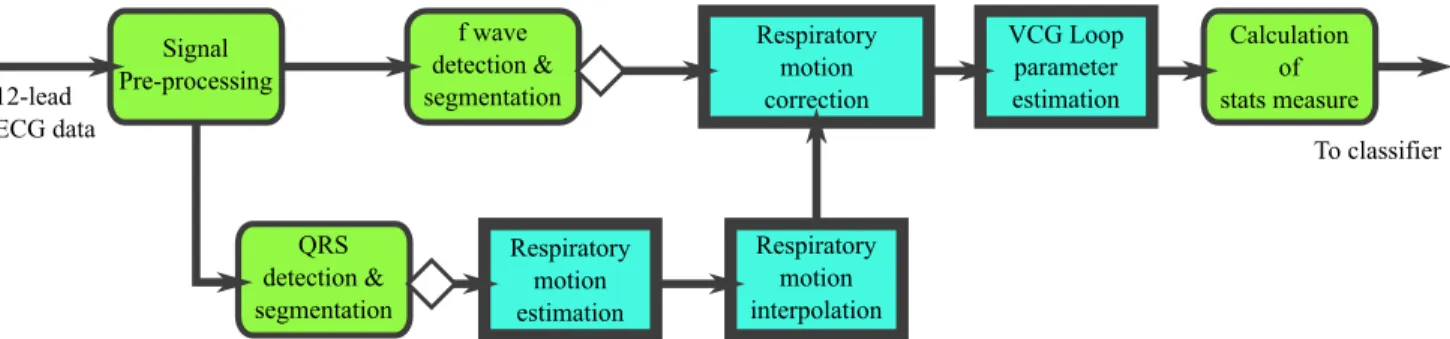
The overall methodology is summarized by (Fig 1). All data processing and classification was done in MATLAB R2014b (MathWorks, USA).
2.1.
Signal pre-processing
75 recordings of 12-leads ECG from the Centre Hospi-talier Princesse Grace in Monaco were acquired from 68 patients reported with AFL during ablation procedures us-ing an acquisition system (Bard, USA). All signals were sampled at 2000 Hz and are about 1 minute in length.
Figure 1. The methodology employed in this research. 12-lead ECG data is processed and undergoes a series of wave detection and segmentation followed by estimation of respiratory motion at the time instants of QRS. The motion is es-timated between two consecutive QRS instants before it is used in the correction stage. VCG loop parameters are then estimated, and statistical measures calculated and fed to the classifier. The diamond at the edge of the boxes indicates an inverse Dower transform. Blue, bolded rectangular boxes correspond to novel approaches we employed in this research.
All signals were filtered between 0.5 and 70 Hz with type II Chebyshev low-pass and high-pass filters in order to reject physiological motion and high-frequency noises, whilst preserving f-wave onsets. A 50 Hz finite-impulse response notch filter was used to remove powerline noise.
Records that were unusable (missing leads, too noisy, atrio-ventricular block ratio <2:1) were excluded. Several records with 2:1 block ratio were kept, provided that sev-eral f wave beat was available. The total number of records at the end was 54, of which 24 were right AFL and 30 left AFL.
2.2.
f wave detection and segmentation
The analysis targets f wave observations, present in the recording as a continuous, periodic atrial activity, partially overlapped by ventricular activity. Due to the high syn-chronicity between them, standard techniques to extract atrial activity (filtering, beat averaging, source separation) is bound to fail. We resort to working with segments of the atrial activity where the deflections are significant. We extracted these segments using a likelihood ratio-based de-tector described in [2].
2.3.
Estimation and correction of
respira-tory motion
The estimation of respiratory motion from the ECG is a well-known topic of research. This is useful for e.g. cancelling unwanted influences caused by the periodic changes induced by respiration. An estimator based on least squares principle has been detailed and applied to the QRS realignment problem in vectorcardiograms (VCG) [3]. In a VCG representation comprised of three leads X, Y and Z, QRS complexes form a 3-dimensional loop.
We consider the dual formulation, suitable for operating on multiple loops: ˆ βi, ˆRi= arg min β,RkβXiR − XRk 2 F (1) ˆ Ri= VUT (2) XTRXi= UΣVT ˆ βi= tr(XiXTi ) tr(XiRˆiXTR) (3)
where β represents loop scaling and R loop rotation (X ∈ RN ×3). Three rotation angles φX, φY, φZ: one for
each axis, can be obtained from the matrix R, available at every QRS time instant. The i-th QRS loop Xiis assumed
properly aligned with the reference XR; we omit a third
effect (temporal alignment) considered in his article. The high signal-to-noise ratio of QRS complexes allow a reliable estimate of respiratory motion at each QRS in-stant. On the other hand, respiratory motion is remarkably slow and has a low-frequency profile compared to cardiac frequency, which is several orders of magnitude higher. The estimates at each QRS instants should be sufficient to perform a reliable interpolation of parameter values to any time instant. These assumptions were used to obtain respiratory motion estimates at the time instant of f waves. QRS complexes were segmented, transformed into VCG loops using the inverse Dower transform [4] and tem-porally resynchronized. A multipass algorithm was ap-plied [3]. However, we observed that several rotation an-gles had values that are considered physiologically impos-sible (e.g. ≈ 80◦). These were caused by the estimator producing a matrix Rrwhich performs a reflection instead
of rotation in order to minimize the least squares error [5]. To restrict the estimator to produce a strict rotation, we modified the estimation procedure.
Firstly, we modified the singular value decomposition (SVD) algorithm used to estimate R. The singular vector V can be estimated using alternated least squares. In order
to maintain similar subspace direction, the algorithm was given as an initial point the singular vectors VR derived
from the reference loop (XT
RXR = URΣRVTR). This
ensures that the subspaces of the QRS loops are always aligned and do not present sign ambiguities: a problem well-known with SVD.
Next, the rotation matrix is tested for reflection by ob-serving the value of det(U) det(V), as was suggested in [5]. A value of −1 indicates a reflection, and the corre-sponding correction is made by calculating ˜R = VSUT
where
S = (
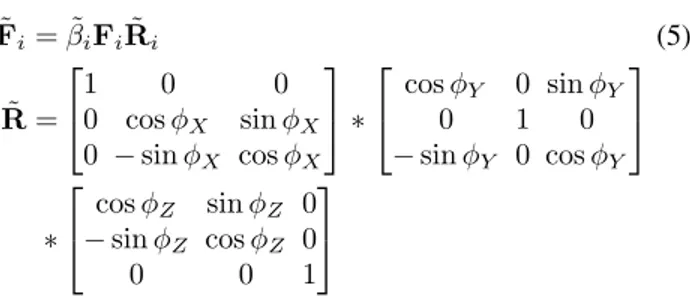
I, if det(U) det(V) = 1 diag(1, 1, −1), if det(U) det(V) = −1 (4) The alignment algorithm was applied only for a sin-gle pass. Respiratory motion parameters, given by β and (φX φY φZ) were then interpolated using piecewise
cu-bic Hermite interpolants to avoid unstable, non-monotonic estimate between two knots. Scale and angle values were then taken at the time instant of each f waves (also trans-formed into VCG) and were used to obtain the corrected individual loop ˜Fi: ˜ Fi= ˜βiFiR˜i (5) ˜ R = 1 0 0 0 cos φX sin φX 0 − sin φX cos φX ∗ cos φY 0 sin φY 0 1 0 − sin φY 0 cos φY ∗ cos φZ sin φZ 0 − sin φZ cos φZ 0 0 0 1
with ˜βiand ˜Rithe value of the interpolated motion at the
time instant of the i-th f loop observation Fi.
2.4.
Estimation of loop parameters and
sta-tistical measures
VCG loop subspace parameters can be used to charac-terize AFL in the 3-dimensional space [6, 7]. The eigen-vectors V = [v1 v2 v3] and singular values [λ1 λ2 λ3]
issued from the singular value decomposition of the loops were used to calculate these parameters for each f loop ob-servation. The 4 parameters employed here were the same as ones in our previous paper [8].
The first two parameters (φAZ, φEL) capture the VCG
loop subspace direction and the remaining two param-eters (ψP L, ψP G) describe the form of the loop in
3-dimensional space (i.e. whether it is flat or occupies space, and circular or elliptic). These 4 parameters vary from beat to beat.
Post-processing was applied before calculating the pa-rameters (truncation to remove edge effects of T wave
cor-rection, downsampling to 250 Hz, point redistribution us-ing spline interpolation to ensure equidistance in the 3-dimensional space).
The parameters φAZand φELare prone to an ambiguity
of ±180◦, inherited from the sign ambiguity of eigenvec-tors. This introduces artificial variability in the data. To correct this, we used a combinatory optimization method consisting of choosing each value as either φ or φ ± 180◦ in order to minimize the variance of the set.
It could be suggested that typical and atypical AFL sub-space direction may be different (i.e. φR 6= φL) [6].
Furthermore, AF organization has been quantified by the varying standard deviation of the 4 parameter values for different levels of organization [7]. In this light, we cal-culated several statistical measures on each of the series of 4 parameters. These measures quantify to an extent the variability contained in the set of f waves. The con-sidered measures were the mean, standard deviation, vari-ance, skewness and kurtosis. Each record is thus described by 4 × 5 = 20 features.
2.5.
Classification scheme
The output of the processing chain was fed into a lin-ear kernel support vector machine (SVM) with soft margin constraint and linear discriminant analysis (LDA) classi-fiers. Additionally, we are interested in finding the fea-tures that consistently produce a good classifier accuracy. To this end, we devised an iterative classification scheme which tests all possible combinations of features. The to-tal number of combinations considered in this paper was 220− 1 for combinations up to 20 features. (Fig 2) shows the maximum accuracy for each size of combination from 1 to 20 for the SVM classifier. The results of the LDA classifier show the same trend.
3.
Results and Discussion
Accura
cy
Number of combined features
2 4 6 8 10 12 14 16 18 20 0.6 0.7 0.8 0.9 1 SVM, Linear kernels Pmax PRmax
Figure 2. Classifier performance, given as the maximum accuracy for a given number of feature combination. The suffix ’R’ indicate that respiratory motion was removed from the set of f waves. General accuracy increase is ob-served up to a combination of 10 features.
3.1.
Effect of respiratory motion correction
on AFL
Effect of respiratory motion on AFL was evaluated by processing f wave VCG loops to remove artificial variabil-ity respiratory motion. A set of f wave observations ex-hibiting only variability intrinsic to AFL was obtained at the end. We analyzed the change in variability by perform-ing a Bland-Altman analysis on the standard deviation of each of the 4 loop parameters before and after correction. Variability before correction should indeed be greater than after correction.
For parameter φAZ, the difference was −0.242 ± 2.375
and for φEL, it was −0.500 ± 5.424, given as the
me-dian ± the mean absolute deviation (p < 0.05). We ob-serve a larger variability than before correction was ap-plied, shown by the negative values. This suggests that correcting f waves added artificial variability into the ob-servation. However, referring to (Fig 2), we see that the classifier performance using the corrected loops was not greatly affected. Thus overall, these results suggest that respiratory motion introduces variability in f wave loops, but does not explain the overall variability observed, and that right and left AFL may be intrinsically different.
The parameter ψ was not affected as a scale and rotation operation do not modify the loop morphology.
3.2.
Comparison of classification accuracy
An example of the classifier result is shown in (Fig 2). Good classification accuracy is achieved using features ob-tained from the set of 4 loop parameters φAZ, φEL, ψP L
and ψP G. The maximum accuracy obtained was 0.91
when considering a minimum of 10 features, correspond-ing to a sensitivity and specificity of 90% and 92%. Accu-racy increases as the number of combined features increase but drops after a minimum combination of 15 features. This suggests that right and left AFL are different with regards to a combination of several features, but above a certain length of combination, they are essentially similar. To remedy this problem, more patients need to be used.
Best features were determined by observing the num-ber of times a feature was used in a combination that pro-duces the maximum accuracy, for all length of combina-tions from 1 to 20. We found that the skewness of parame-ter ψP Land the mean of parameter ψP Goccur frequently
in many of these combinations. Although this leads to be-lieve that these features should be used to construct a prac-tical classifier, they are not the only features that constitute the best combination: several others also provide useful information in discriminating right and left AFL. Rather, it can be said that right and left AFL are different in re-gards to these features. Further analysis is needed to better understand how right and left AFL may be different.
4.
Conclusion
We present in this paper several items and conclusions. First, we tested the hypothesis that variability in AFL was due to the variability introduced by respiratory motion which might affect right and left AFL differently. Using a novel approach, we concluded that f waves were mini-mally affected by respiratory motion and that the variabil-ity observed in the ECG was intrinsic to AFL. By exploit-ing this variability, good discrimination between right and left atrial flutter localization was achieved.
Acknowledgements
This work was realized with the support from Universiti Kuala Lumpur and the French government.
References
[1] Kahn AM, Krummen DE, Feld GK, Narayan SM. Localizing Circuits of Atrial Macro-Reentry Using ECG Planes of Co-herent Atrial Activation. Hear Rhythm 2007;4(4):445–451. [2] Kamarul Azman MH, Meste O, Kadir K. Detecting flutter
waves in the electrocardiogram using generalized likelihood ratio test , to be published;.
[3] Sornmo L. Vectorcardiographic loop alignment and morpho-logic beat-to-beat variability. IEEE Transactions on Biomed-ical Engineering December 1998;45(12):1401–1413. [4] Dower GE, Machado HB, Osborne JA. On deriving the
elec-trocardiogram from vectoradiographic leads. Clin Cardiol apr 1980;3(2):87–95.
[5] Umeyama S. Least-squares estimation of transformation pa-rameters between two point patterns. IEEE Transactions on pattern analysis and machine intelligence 1991;13(4):376– 380.
[6] Ng J, Sahakian AV, Fisher WG, Swiryn S. Atrial flutter vec-tor loops derived from the surface ECG: does the plane of the loop correspond anatomically to the macroreentrant circuit? J Electrocardiol 2003;36:181–186.
[7] Richter U, Stridh M, Bollmann A, Husser D, S¨ornmo L. Spa-tial characteristics of atrial fibrillation electrocardiograms. J Electrocardiol 2008;41:165–172.
[8] Kamarul Azman MH, Meste O, Kadir K, Latcu DG. Esti-mation and Removal of T Wave Component in Atrial Flutter ECG to Aid Non-Invasive Localization of Ectopic Source. In Computing in Cardiology, volume 44. September 2017; 376–380.
Address for correspondence: Muhammad Haziq Kamarul Azman Bureau 206
Laboratoire I3S 2000 route des Lucioles 06900 Sophia Antipolis, France [email protected]