HAL Id: hal-00380713
https://hal.archives-ouvertes.fr/hal-00380713
Preprint submitted on 4 May 2009
HAL is a multi-disciplinary open access
archive for the deposit and dissemination of
sci-entific research documents, whether they are
pub-lished or not. The documents may come from
teaching and research institutions in France or
abroad, or from public or private research centers.
L’archive ouverte pluridisciplinaire HAL, est
destinée au dépôt et à la diffusion de documents
scientifiques de niveau recherche, publiés ou non,
émanant des établissements d’enseignement et de
recherche français ou étrangers, des laboratoires
publics ou privés.
Intermittency of interstellar turbulence: Parsec-scale
coherent structure of intense velocity-shear
Pierre Hily-Blant, Edith Falgarone
To cite this version:
Pierre Hily-Blant, Edith Falgarone. Intermittency of interstellar turbulence: Parsec-scale coherent
structure of intense velocity-shear. 2009. �hal-00380713�
Astronomy & Astrophysicsmanuscript no. hal.hyper6428 c ESO 2009 May 4, 2009
Letter to the Editor
Intermittency of interstellar turbulence: Parsec-scale coherent
structure of intense velocity-shear
⋆
P. Hily-Blant
1and E. Falgarone
21 LAOG, CNRS & Universit´e Joseph Fourier, UMR 5571, 414 Rue de la Piscine BP 53 F-38041 Grenoble Cedex 09
2 LRA/LERMA, CNRS & ´Ecole normale sup´erieure & Observatoire de Paris, UMR 8112, 24 rue Lhomond, 75231 Paris Cedex 05,
France
Received / Accepted
ABSTRACT
Aims.Guided by the duality of turbulence (random versus coherent motions), we seek coherent structures in the turbulent velocity field of molecular clouds, anticipating their importance in cloud evolution.
Methods.We analyse a large map (40’ by 20’) obtained with the HERA multibeam receiver (IRAM-30m telescope) in a high latitude cloud of the Polaris Flare at an unprecedented spatial (11′′) and spectral (0.05km s−1) resolutions in the12CO(2 − 1) line.
Results.We find that two parsec-scale components of velocities differing by ∼ 2 km s−1, share a narrow interface (< 0.15 pc) that
appears as an elongated structure of intense velocity-shear, ∼ 15 to 30 km s−1pc−1. The locus of the extrema of line–centroid-velocity
increments (E-CVI) in that field follows this intense-shear structure as well as that of the12CO(2−1) high-velocity line wings. The tiny
spatial overlap in projection of the two parsec-scale components implies that they are sheets of CO emission and that discontinuities in the gas properties (CO enrichment and/or increase of gas density) occur at the position of the intense velocity shear.
Conclusions. These results disclose spatial and kinematic coherence between scales as small as 0.03 pc and parsec scales. They confirm that the departure from Gaussianity of the probability density functions of E-CVIs is a powerful statistical tracer of the intermittency of turbulence. They disclose a link between large scale turbulence, its intermittent dissipation rate and low-mass dense core formation.
Key words.ISM: clouds, ISM: magnetic fields, ISM: kinematics and dynamics, turbulence
1. Introduction
Because it is supersonic, magnetized and develops in a multi-phase medium, interstellar turbulence is expected to differ from turbulence in laboratory flow experiments or in state-of-the-art numerical simulations, e.g. Chanal et al. (2000) for recent experiments in gaseous helium and Mininni et al. (2006a) or Alexakis et al. (2007) for MHD simulations. Nonetheless, it may carry some universal properties of turbulence, such as space-time intermittency (for a review see Anselmet et al. 2001). Of particular interest to star formation, is the behavior of turbu-lence dissipation. In a series of papers, we have shown that the 12CO(1 − 0) line–centroid-velocity increments (CVI) in
translucent molecular gas have non-Gaussian statistics more pro-nounced at small scale. The extreme CVI (E-CVI) responsi-ble for the non-Gaussian tails of their probability density func-tions (pdf ) form elongated coherent structures over 0.8 pc. These structures have been tentatively identified with regions of intense velocity-shear1and enhanced local dissipation rate, based on
their thermal, dynamical, and chemical properties. These pure velocity-structures do not follow those of dense gas, they tend
Send offprint requests to: P. Hily-Blant, e-mail:
⋆ Based on observations carried out with the IRAM-30 m telescope.
IRAM is supported by INSU-CNRS/MPG/IGN.
1 In the following, “shear” is used instead of gradient to
empha-size that the observations provide cross-derivatives of the line–centroid-velocities (CV) (i.e. the displacement, in the plane-of-the-sky (POS), is perpendicular to the projection axis of the velocities).
to be parallel to the magnetic field orientation, they are asso-ciated with gas warmer (Tkin > 25 K) than the bulk of the gas
(Hily-Blant & Falgarone 2007a; Hily-Blant et al. 2008, hereafter Paper I and Paper II), and they bear chemical signatures ascribed to a warm chemistry not driven by UV photons (Falgarone et al. 2006; Godard et al. 2009). Last, in one such E-CVI structure, Plateau de Bure Interferometer (PdBI) observations disclose sev-eral sub-structures of intense velocity-shear at scales as small as 6 milli-parsec (mpc) (Falgarone et al. 2009, hereafter FPH09). This suggests that turbulent molecular clouds harbour coherent velocity-shear structures from 6 mpc to 800 mpc.
We have increased the dynamic range by a factor 8 com-pared with Paper II, by mapping four times larger an area in the Polaris Flare with twice better a spatial resolution. The aim is to further explore the range of scales over which the spatial co-herence of these intense-shear structures is found. These are the first large scale observations performed at high-angular resolu-tion and high spectral resoluresolu-tion in translucent gas. The observa-tions and the results are described in Section 2 and 3. We briefly discuss possible interpretations and the nature of these structures in light of recent numerical simulations (Section 4).
2. Observations
Observations of the 12CO(2 − 1) line were carried out at the IRAM-30m telescope with the 1.3mm multibeam heterodyne re-ceiver HERA (Schuster et al. 2004) during August 2007 and January 2008, under good weather conditions. The map cov-ers 0.3 deg2 and consists of 9 submaps of 10′
2 Hily-Blant & Falgarone: Coherent structure of intense velocity-shear
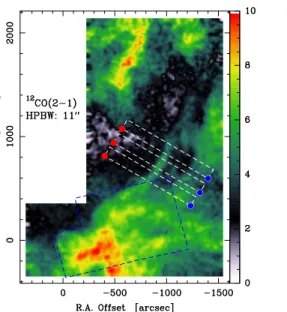
Fig. 1. Left: Integrated intensity map (K km s−1, T∗
Ascale) smoothed to 15
′′. The white dashed boxes show the areas used to build the
average p − v cuts (right panels). The blue rectangle (dashed line) delineates the previous field of Paper I. Right: p − v cuts in the 3 boxes shown in left panel (T∗
Ascale, distance measured in
′′with arbitrary origin). The line CV are shown in red.
which was observed in two orthogonal scanning directions to minimize striping due to gain or atmosphere variations. The final map encompasses the fields successively observed by Falgarone et al. (1998) and in Paper I shown as a dashed box in Fig.1 and is ∼ 2 × 1 pc at the adopted distance of the source (150 pc). Data were acquired in the powerful on-the-fly (OTF) frequency-switched mode (4′′s−1 scanning velocity, 1s time sampling, 4′′
spatial sampling in both directions, 13.8 MHz frequency throw), using the VESPA autocorrelator facility as backends. A total of 1.5×10⁶raw spectra was recorded in 80 hours of telescope time
with a spectral resolution of 0.05 km s−1. Data were reduced
with the new CLASS90 software optimized for OTF (Hily-Blant et al. 2005). The instrumental response was canceled by sub-tracting linear baselines to each original spectrum, which were then convolved by a Gaussian kernel (1/3 HPBW) and gridded on a regular grid with 0.5HPBW sampling. The final data cube was then smoothed to 15′′and 0.1 km s−1resolutions to improve
the signal-to-noise ratio. The typical rms in each final pixel is 1σ = 0.5 K in 0.1 km s−1channels.
3. Results
3.1. Space and velocity maps
The12CO(2 − 1) integrated emission is displayed in Fig. 1 (left panel) with three position-velocity (p − v) diagrams (right pan-els) made along the NE-SW boxes shown. A sharp variation of velocity, from ∼ −3 km s−1 to ∼ −5 km s−1 (from NE to SW)
occurs over a layer thinner than a few 100′′in projection. Fig.2
that displays the integrated emission in two adjacent velocity in-tervals, at high (HV) [-3.5, -0.5] km s−1 and low velocity (LV)
[-6.5, -3.5] km s−1, stresses a remarkable characteristic of that field: the edges of the LV and HV components follow each other closely in projection over more than ∼ 1 pc. It is then most un-likely that they be unrelated pieces of gas along the line of sight: they have to be in contact.
The second remarkable characteristic of that field is the fol-lowing: while the emissions in the LV and HV components are extended, their spatial overlap (the pink areas of Fig.2, also ex-emplified in the p − v diagrams) is limited to narrow filamen-tary regions in projection. It is most visible between δ = 87◦45′
and 88◦ (thus over ∼ 1 pc) where it does not split into several
substructures. Now, if the LV and HV components were parsec-scale volumes, their interface would appear thin over ∼ 1 pc only if viewed edge-on (within ±5◦for a projected size less than one tenth of its real size), a case that we rule out on statistical grounds. We therefore infer that the 12CO(2 − 1) HV and LV
components are layers rather than volumes and that their inter-face is 1-dimensional rather than 2-dimensional. This ensures that under any viewing angle the two extended velocity compo-nents present a narrow interface.
The slope of the variations of the line CV drawn on the p − v diagrams provides a measurement of the velocity shear between the two components. On each cut shown, there is an average shear of ≈ 13 km s−1pc−1(a velocity variation of 2 km s−1over
≈ 0.15 pc). Steeper slopes are also visible and locally provide higher shears up to 30 km s−1pc−1 (1 km s−1 over 0.03 pc) in
the middle cut. These values are more than one order of mag-nitude larger (within the uncertainties due to projections) than the average value of 1 km s−1pc−1estimated at the parsec scale
in molecular clouds (Goldsmith & Arquilla 1985). The velocity field therefore significantly departs, at small scales, from pre-dictions based on the generally adopted scaling laws in molec-ular clouds. If velocity fluctuations over a scale l increase as δvl ∝ l1/2, velocity-shears should increase by no more than
331/2≈5.7 between 1 pc and 0.03 pc.
A closer inspection of the p − v diagrams shows that (i) the sharpest variations of the line CV occur between two line-wings appearance (above −2.0 km s−1for the HV wing and
be-low −5.5 km s−1for the LV wing), (ii) the separation between the LV and HV wings steepens from top (0.1 pc) to bottom (0.03 pc), and (iii) the layer of largest velocity shear coincides with the lane
Hily-Blant & Falgarone: Coherent structure of intense velocity-shear 3
Fig. 2.12CO(2 − 1) integrated intensity in two adjacent velocity ranges: [-6.5:-3.5] km s−1in blue and [-3.5:-0.5] km s−1in red.
At a distance of 150 pc, 20’ correspond to 0.9 pc.
of enhanced12CO(2 − 1) emission visible in Fig. 1 at the center
of each cut.
3.2. Distribution of E-CVI
Following Lis et al. (1996); Pety & Falgarone (2003) and Paper II, we have built the pdf (see Fig. 3) of 12CO(2 − 1) CVI over the whole field. The statistics is significantly improved compared to previous works. The probability density in the most extreme bins reaches 10−5. Fig. 3 displays the locus of the
E-CVI. It is remarkable that the thin structure delineated by the
12CO(2 − 1) E-CVI in the SE area (blue box of Fig. 1) is so
sim-ilar to that obtained with the same method applied to a much smaller sample observed in a different transition,12CO(1 − 0) (Paper II). The E-CVI structure is the high-angular resolution view of the structure obtained with the same statistical analy-sis performed on KOSMA maps of the field (HPBW=120′′) and
shown in Fig. 12 of Paper II.
The E-CVI structure does not follow the peaks of the
12CO(2 − 1) line integrated emission. Instead, it coincides, over
the ∼ 1 pc region discussed in Section 3.1, with the narrow inter-face of the HV and LV components i.e. the intense velocity-shear (Fig. 3, center), and follows in detail the thin elongated structure in the extreme velocity range [−2.0, −0.5] km s−1, that of the red
linewings (Fig. 3, right). This association between CO linewings and intense velocity-shears extends the findings of Paper II to higher-resolution and over a larger scale.
These properties of the locus of E-CVI unambiguously sup-port, for the first time, the proposition of Paper II that the E-CVI trace intense velocity-shears in turbulent gas and that the extreme variations of the line CV are driven by the appear-ance/disappearance of linewings over small scales. It is also the first observational proof of the early conjecture of Falgarone & Phillips (1990) that the broad CO linewings trace the intermit-tency of turbulence in molecular clouds. These results clarify, at least in the case of translucent clouds, the controversy on the origin of small-scale CV variations expected to be due primar-ily to density fluctuations, line-of-sight projections, and
radia-tive transfer (Esquivel et al. 2007; Miville-Deschˆenes et al. 2003; Levrier 2004).
Last, this E-CVI structure is coherent over ∼ 2 pc while its thickness is as small as 0.03 pc. Its aspect ratio is there-fore ∼ 70. Its length seems to be limited by the size of the map (see the longer structure computed from the KOSMA data in Paper II). We also note that the E-CVI structure splits into multiple branches in several areas, in particular around offsets (−1000′′ ,800′′ ) and (−700′′ ,500′′ ). 4. Discussion
4.1. What is the nature of the interface?
The interface is primarily an intense velocity-shear. The p − v diagrams show that this velocity shear corresponds to a discon-tinuity in the CO flow: the HV (LV) component is not detected above ∼ 0.5 K in the SW (NE) of the shear. The flows undetected in the12CO(2 − 1) line are either CO-poor and/or too dilute to excite the transition. In this framework, we observe the yield of a strain developing in a gas undetected in the12CO(2 − 1) line: the
gas we detect (denser and/or richer in CO) is generated in the 1-dimensional intense-shear interface and is spread in the POS by motions whose velocity cannot be measured. This scenario nat-urally produces the two components of the large velocity-shear, with sharp edges closely following each other over ∼ 1 pc and little overlap in projection under any viewing angle.
The intense-shear structure may however belong to a shock of unknown velocity in the POS. We have searched for SiO(2−1) line emission as a chemical shock signature within this struc-ture and found no emission above a significant low threshold 3σ = 5 mK that corresponds, in the optically thin case, to a tiny SiO column density of about 1010cm−2. Hence, there is no
chemical signature of C-shocks faster than 20 km s−1detected at
the scale of 0.03 pc (Gusdorf et al. 2008). But we cannot rule out a weak C-shock component (vS ≤ 2 km s−1) in the POS
that would produce the density enhancement and/or the CO en-richment of the gas required to explain the non-detection in the
12CO(2 − 1) line of the gas before it enters the shear layer. This
would be consistent with the sub- to trans-Alfv´enic nature of the turbulent motions in that field (see Paper II). The solenoidal contribution to the interface (2 km s−1) would exceed the
possi-ble compressive one (≤ 2 km s−1), in agreement with Federrath
et al. (2009) who find that our observed statistical properties of turbulence in the Polaris Flare are in very good agreement with solenoidal forcing at large scale. This result is reminiscent of
the finding of Mininni et al. (2006a) that the stronger the shear at large-scale, the more intense the intermittency of velocity increments at small-scale.
4.2. A plausible link with the dense cores
The above findings are similar to those inferred from PdBI ob-servations (FPH09) of the small (1’ by 2’) field shown in Fig.3 (left). Velocity-shears as intense as 500 km s−1pc−1are detected
there over distances of 6 mpc, at the edge of CO structures of velocities differing by several km s−1. The PdBI field is close to
two low-mass dense cores (Heithausen 2002), interestingly lo-cated at the tip of the E-CVI structure (Fig. 3, left).
The viscous dissipation rate of turbulence being proportional to the square of the rate-of-strain (Landau & Lifschitz 1987), it is tempting to interpret the large increase of the velocity-shear, from 30 km s−1pc−1 (Fig. 1) to 500 km s−1pc−1 in the
4 Hily-Blant & Falgarone: Coherent structure of intense velocity-shear
Fig. 3. Left: Map of the CVI (top panel, color scale in km s−1) computed for a lag of 4 pixels or 60′′, and normalized pdf (circles, bottom panel) compared with a Gaussian distribution (σ = 0.19 km s−1, red). The red crosses (top panel) indicate the
position of the dense cores from Heithausen (2002). The rectangle delineates the PdBI field of Falgarone et al. (2009). Middle: E-CVI (blue contours) overplotted on the integrated intensity of Fig. 1. Right: E-CVI (blue contours) overplotted on the intensity integrated in the red wing interval [-2:-0.5] km s−1(Hily-Blant & Falgarone 2007a).
large-scale shear. The growth of the instability splits the shear into small-scale and more intense shears, thus increasing the lo-cal dissipation rate of turbulence by two-orders of magnitude. Clustering of small-scale structures of high strain-rate magni-tude (and therefore large dissipation) into structures of inertial extension have been found in numerical simulations of incom-pressible HD (Moisy & Jim´enez 2004) and MHD turbulence (Mininni et al. 2006b). One then may speculate that these bursts of dissipation eventually lead to the formation of low mass dense cores largely devoid of turbulent energy, after an evolution of the gas that remains to be understood.
5. Conclusions
We have detected a 1-dimensional structure of intense velocity-shear (∼ 15 to 30 km s−1pc−1), coherent over ∼ 1 pc with a
thick-ness of only 0.03 to 0.15 pc. This remarkable structure follows the distribution of extreme12CO(2 − 1) line-wings and coincides
partly with the locus of E-CVIs in the field. These findings sup-port the previous claim we made that, in translucent molecular clouds, E-CVIs are tracers of extreme velocity-shears in inter-stellar turbulence, as do the broad CO linewings.
This shear structure is proposed to be the source of layers of CO-rich dense gas in a CO-poor (and/or dilute) gas component experiencing the strain and not seen in12CO(2 − 1). The shear is likely to be the site of enhanced turbulent dissipation. We cannot rule out an undetected shock component in the POS.
These results, in conjunction with the PdBI results of FPH09, stress the coupling of small and large scales in interstellar tur-bulence, over a dynamic range never reached before, i.e. from 6 mpc to more than 1 pc. They support a framework in which trans-Alfv´enic (but supersonic) turbulence dissipates primarily in intense-shear layers connecting the large-scales to mpc scales (or below).
We speculate that turbulence dissipation has been proceeding for a longer time at the southern tip of the E-CVI structure than
in the northern part, leading to the formation of the two dense cores.
Acknowledgements. The authors thank M. Heyer for his clarifying and percep-tive report on the original version of this Letter. We are grateful to C. Thum and H. Wiesemeyer from IRAM for their indefectible support to the HERA facility. The authors acknowledge the hospitality of the Kavli Institute for Theoretical Physics (Grant No. PHY05-51164).
References
Alexakis, A., Mininni, P. D., & Pouquet, A. 2007, New Journal of Physics, 9, 298
Anselmet, F., Antonia, R. A., & Danaila, L. 2001, Planet. Space Sci., 49, 1177 Chanal, O., Chabaud, B., Castaing, B., & H´ebral, B. 2000, European Physical
Journal B, 17, 309
Esquivel, A., Lazarian, A., Horibe, S., et al. 2007, MNRAS, 381, 1733 Falgarone, E., Panis, J.-F., Heithausen, A., et al. 1998, A&A, 331, 669 Falgarone, E., Pety, J., & Hily–Blant, P. 2009, accepted in A&A Falgarone, E. & Phillips, T. G. 1990, ApJ, 359, 344
Falgarone, E., Pineau Des Forˆets, G., Hily-Blant, P., & Schilke, P. 2006, A&A, 452, 511
Federrath, C., Duval, J., Klessen, R. S., Schmidt, W., & Mac Low, M. M. 2009, in prep.
Godard, B., Falgarone, E., & Pineau des Forˆets, G. 2009, A&A, 495, 847 Goldsmith, P. F. & Arquilla, R. 1985, in Protostars and Planets II, ed. D. C. Black
& M. S. Matthews, 137–149
Gusdorf, A., Pineau Des Forˆets, G., Cabrit, S., & Flower, D. R. 2008, A&A, 490, 695
Heithausen, A. 2002, A&A, 393, L41
Hily-Blant, P. & Falgarone, E. 2007a, A&A, 469, 173 Hily-Blant, P., Falgarone, E., & Pety, J. 2008, A&A, 481, 367
Hily-Blant, P., Pety, J., & Guilloteau, S. 2005, CLASS evolution: I. Improved OTF support, Tech. rep., IRAM
Landau, L. D. & Lifschitz, E. M. 1987, Fluid Mechanics (Pergamon Press) Levrier, F. 2004, A&A, 421, 387
Lis, D. C., Pety, J., Phillips, T. G., & Falgarone, E. 1996, ApJ, 463, 623 Mininni, P. D., Alexakis, A., & Pouquet, A. 2006a, Phys. Rev. D, 74, 016303 Mininni, P. D., Pouquet, A. G., & Montgomery, D. C. 2006b, Phys. Rev. L., 97,
244503
Miville-Deschˆenes, M.-A., Levrier, F., & Falgarone, E. 2003, ApJ, 593, 831 Moisy, F. & Jim´enez, J. 2004, J. Fluid Mech., 513, 111
Hily-Blant & Falgarone: Coherent structure of intense velocity-shear 5
![Fig. 2. 12 CO(2 − 1) integrated intensity in two adjacent velocity ranges: [-6.5:-3.5] km s −1 in blue and [-3.5:-0.5] km s −1 in red.](https://thumb-eu.123doks.com/thumbv2/123doknet/14619575.546984/4.892.125.385.86.423/fig-integrated-intensity-adjacent-velocity-ranges-blue-red.webp)
