HAL Id: hal-02332657
https://hal.archives-ouvertes.fr/hal-02332657
Submitted on 24 Oct 2019
HAL is a multi-disciplinary open access
archive for the deposit and dissemination of sci-entific research documents, whether they are pub-lished or not. The documents may come from teaching and research institutions in France or abroad, or from public or private research centers.
L’archive ouverte pluridisciplinaire HAL, est destinée au dépôt et à la diffusion de documents scientifiques de niveau recherche, publiés ou non, émanant des établissements d’enseignement et de recherche français ou étrangers, des laboratoires publics ou privés.
The value of thermochemical storage for concentrated
solar power plants: economic and technical conditions of
power plants profitability on spot markets
Emeric Tapaches, David Salas Videla, Maxime Perier-Muzet, Sylvain Mauran,
Didier Aussel, Nathalie Mazet
To cite this version:
Emeric Tapaches, David Salas Videla, Maxime Perier-Muzet, Sylvain Mauran, Didier Aussel, et al.. The value of thermochemical storage for concentrated solar power plants: economic and technical con-ditions of power plants profitability on spot markets. Energy Conversion and Management, Elsevier, 2019, 198, pp.111078. �10.1016/j.enconman.2018.11.082�. �hal-02332657�
The value of thermochemical storage for concentrated solar power plants:
economic and technical conditions of power plants profitability on spot markets
Emeric Tapachèsa, David Salasa, Maxime Perier-Muzeta, b, Sylvain Maurana, b, Didier Aussela, b, Nathalie Mazeta,*a
CNRS PROMES, UPR 8521, Rambla de la Thermodynamique, Tecnosud, F- 66100 Perpignan, France
b
UPVD, Université de Perpignan Via Domitia, 52 Av. Paul Alduy, F- 66860 Perpignan, France
Corresponding author: Nathalie.mazet@promes.cnrs.fr
Abstract
This paper explores two new paradigms by studying the techno-economic relevance of a concentrated solar power plant in spot electricity markets involving strong price variations, and by investigating the integration of an innovative thermal storage performed by a thermochemical process in such plant. It aim is to optimize simultaneously the physical characteristics of the storage and the operation of the plant (combining production/storage/discharge phases). The methodology is based on pre-scenarios for the plant operation, and net present value as optimization criteria. The results show original scenarios involving one or two discharge phases (according to day, season, solar multiple, or location) with higher revenues and stored energies than the classical scenario (i.e. one discharge at sunset). Nevertheless, these revenues in the spot market are too low, leading to negative net present values. Thus, such power plant requires subsidies, that are here estimated from 12 €/Mwhe (depending on case study), which are much lower than classical flat feed-in tariffs.
Keywords: concentrated solar power plant; thermochemical storage; calcium oxide/hydroxide reaction; spot market; dimensional and operational optimization
2
Nomenclature
𝐴 area [m3] Subscript or superscript
𝐶 cost [M€] C constraint
𝐶𝑎𝑂 calcium oxide 𝑐𝑜𝑛𝑑 condensation
𝐶𝑎(𝑂𝐻)2 calcium hydroxide 𝐷 discharge
c̅p average heat capacity [kJ. kg−1. K−1] 𝑒𝑣𝑎𝑝 evaporation
𝐷𝐸𝐶 energy density [kWh. m−3] 𝑓𝑖𝑛 final
𝐸 energy [MWh] 𝑔 gas
𝐻2𝑂 water 𝑖 i-th season
𝑖𝑟 real discount rate [%] 𝑖𝑛𝑖 initial
𝐿𝑡𝑜𝑡 total length of the reactor tubes [m] 𝑗 j-th discharge phase per day
𝑚 mass [kg] 𝑘 k-th day of week
𝑀 molar mass [kg. mol−1] 𝑙 liquid
𝑚̇ mass flow rate [kg. s−1] 𝑜𝑝𝑡 optical or optimum
𝑝 pressure [bar] 𝑃 production
𝑄̇ thermal power [W] S storage
𝑟𝑑𝑖𝑓𝑓 radius of the steam diffuser [m] 𝑠𝑓 solar field
𝑟𝑠𝑤 radius of the inner reactor wall [m] 𝑡ℎ thermal
𝑡 time [h] 𝑢 useful
𝑇 temperature [K] Acronym
𝑉𝑏𝑒𝑑 total volume of reactive composite medium
[m3]
ACC Air Cooled Condenser
𝑊̇ mechanical or electrical power [W] BNI Beam Normal Irradiance
𝑋 global advancement of reaction [-] CSP Concentrated Solar Power
Greek letters
HTF Heat Transfer Fluid
𝛽 cost factor of the storage LCOE Levelized Cost of Energy
[€/MWh] ∆ℎ𝑟0 standard molar enthalpy of reaction
[kJ. molgas−1]
NPV Net Present Value
∆ℎ𝑣𝑎𝑝0 std. molar enthalpy of vaporization [kJ. molgas−1] SAM System Advisor Model
∆𝑇𝑒𝑞 equilibrium drop for the reaction [K] SM Solar Multiple
𝜂 efficiency [-] TES Thermal Energy Storage
3
1) Introduction and state-of-the-art
The European Solar Thermal Electricity Association (ESTELA), Greenpeace International and SolarPACES jointly proposed in 2016 three scenarios, predicting the growth of concentrated solar thermal electricity (or CSP for Concentrated Solar Power) market across the world in the next decades
[1]. They also highlighted new relevant emerging markets: China, India, Chile, Southern and Northern countries of Africa, and Australia. According to the database of the US National Renewable Energy Laboratory (NREL), between 2015 and 2020, roughly 2 GWe of parabolic through and 2.1 GWe of power tower projects are at least under development [2]. Due to their current high cost of electricity production, all of these projects need financial supports from the governments either for construction or for operation. According to the above-mentioned report [1], Thermal Energy Storage (TES) in CSP plants is increasingly becoming a prerequisite in government tenders around the world. Indeed, TES allows to dispatch electricity production according to the needs, and it improves the value of CSP plants.
Currently, TES is used to extend electricity production, after sunset, from few hours (e.g. Andasol, Spain) up to base load production (e.g. Gemasolar, Spain). All projects with storage referenced in NREL database store heat in sensible form [2]. Direct or indirect storages in two molten salt tanks are the most used solutions. Classical operation strategy is as follows: during sun-on period, the solar field feeds in priority the power block at its nominal design point when it is possible, and the excess heat feeds the storage; during sun-off period, the stored heat feeds the power block. The operator tries to run the power block at its nominal operating point, but, if the thermal power (temperature or flow rate) is not sufficient, the power block can run at part-load with a lower efficiency. This strategy corresponds to an intermediate load or a base-load production that is relevant in flat feed-in-tariff frameworks.
Nevertheless, CSP plants with TES (CSP-TES) could have more value for the grid by supplying electricity during peak load periods [3]. For instance, during these critical periods of high demand and high ramp, the California Independent System Operator (CAISO) has to increase both, production from natural gas and electricity imports, and that is detrimental to the environment and the local economy [4]. Peak load periods correspond to higher electricity price on the day-ahead market (also called spot market, i.e. a liberalized market where energy producers offer their hourly energy bids one day ahead). Typically, there are two peaks over a working day, in early morning and early evening. So, thermal energy storage allows shifting electricity production to such high-price times, and that should maximize the revenues and alleviate the supplier. Nevertheless, there are construction costs and operating costs associated to the electricity generation’s shifting: constructions costs of the TES units, and operating costs due to the standby/re-startup operation of the power block. Thus, there is a trade-off to find and optimization techniques are required.
4
Few papers have investigated optimization of CSP-TES plants production/storage strategy on day-ahead markets. This kind of problems belongs to the Optimal Control theory [5]. Indeed, under some constraints, control functions, which correspond to the production/storage strategy, must be found to optimize a cost function (objective function). Hummon et al. [6] studied the value of a CSP-TES plant for grids with an energy mix (renewable, conventional). They consider a 300 MWe power block, a parabolic trough solar field (Solar Multiple at 2.2) and 6-hour storage running in Colorado, USA. The power plant is modeled with the System Advisor Model (SAM) software developed by the NREL [7]. The commercial Plexos software and the Xpress-MP solver optimize the power management in order to minimize the total generation cost on the grid (objective function) over a 48-hour time horizon. They compare the classical operation strategy previously described and an optimized strategy taking into account variable electricity prices. In comparison with the classical strategy, the optimization reduces the production levels during daylight in order to produce more energy during high price periods, following the marginal price of energy. Guédez et al. [8] proposed a similar study with another optimization toolbox and a power plant modeled with the Transient Systems Simulation (TRYNSYS) software. They mention that operational optimization is based on two successive routines: a routine optimizes the number of hours that the plant should operate per day; then, another one optimizes which of these hours should be covered by the energy from the storage. Therefore, their approach is suboptimal. They consider a central receiver with two-tank molten-salt storage running in Sevilla, Spain, for various solar multiples (SM from 1 to 3) and TES capacities (from 1 to 15 hours). They show that the optimal LCOE corresponds to both a large solar field (SM = 2.75) and a large storage capacity (12 hours) with a base-load production. Wittmann et al. [9] used a dynamic programming technique to determinate the best production/storage profile in order to obtain the maximum revenue (objective function) over a 48-hour discrete time horizon. The inputs of their model are the actual electricity price and weather forecast. They consider the Andasol-1 power plant, which is a 49.9-MWe parabolic trough power plant with 7.5-hour two-tank molten-salt storage running in the south of Spain. Some transient behaviors of power plant components are taken into account (e.g. start-up and shutdown of the power block). This paper shows the complexity of this kind of problems and their implementations. A similar work was carried out by Casati et al. [10]; they also use an Optimal Control technique to maximize the revenue of the power plant over a 1-month continuous time horizon. They consider a central receiver with two-tank molten-salt storage running in Daggett (USA) and Almería (Spain) and various solar multiples (SM). Each month is optimized separately and the yearly revenue is the sum of monthly revenues. They show that in average the optimal control technique enables to obtain up to 10% more revenue with respect to the classical strategy.
In all these papers, when addressing the economical optimization of a CSP plant in the framework of variable electricity prices, the optimization variables are solely related to the operation of the plant (i.e. start and end of the production/storage/discharge phases). The size of the storage and solar field
5
(Solar Multiple) are always fixed prior optimization process. Therefore, the durations of the storage and discharge phases are constrained by the storage size. One novelty of our work is to add another degree of freedom in this economical optimization, by optimizing simultaneously the operation of the power plant and the size and design of the storage.
Thermochemical storage
This paper also investigates the relevance of an innovative thermal storage based on a thermochemical process. This storage process involves a fixed-bed thermochemical reactor implementing the calcium oxide/calcium hydroxide (𝐶𝑎0/𝐶𝑎(𝑂𝐻)2) and water (𝐻2𝑂) reactive pair.
The principle of this storage is the association of two monovariant reversible transformations: a chemical reaction (Eq. (1)) and a liquid/gas phase change (Eq. (2)).
𝐶𝑎𝑂 + 𝐻2𝑂(𝑔) 𝑒𝑥𝑜 ⇌ 𝑒𝑛𝑑𝑜 𝐶𝑎(𝑂𝐻)2+ ∆ℎ𝑟0 (1) 𝐻2𝑂(𝑔) 𝑒𝑥𝑜 ⇌ 𝑒𝑛𝑑𝑜 𝐻2𝑂(𝑙)+ ∆ℎ𝑣𝑎𝑝0 (2)
These two transformations involve endo- or exo-thermal effects, depending on the direction of the reaction. These directions are defined by the thermodynamic operating conditions 𝑇𝑐 (constraint
temperature) and 𝑝𝑐 (constraint pressure), applied to the reactants (Fig. 4). For the reaction described by
Eq. (1), the exothermal transformation (discharge phase) corresponds to the synthesis reaction, and the endothermal reaction (storage phase) corresponds to the decomposition reaction. These thermal effects have been investigated for thermal energy storage in several applications. For instance, Schaube et al. investigated such storage for CSP plants [11] and Michel et al. for house heating [12]. More generally, Zhang et al. proposed a selection method to identify the suitable reactive pairs for high-temperature applications like industrial processes [13]. The main advantages of 𝐶𝑎0/𝐶𝑎(𝑂𝐻)2 thermochemical
storage are the intrinsic high energy density of this low cost and environmentally friendly reactive pair, and a non time-dependent energy storage capacity, due to its chemical potential form. Moreover, the
power and temperature of the storage/discharge phases can be controlled not only by the mass flow rate and temperature of the heat transfer fluid, but also by the operating pressure of the reactor. All of these advantages have to be analyzed taking into account a more complex implementation than classical sensible heat storage systems. Only a few papers studied thermochemical storage for CSP plants, and most of them focused on the reaction and reactor levels. In 1979, Rosemary et al. [14] emphasized the attractiveness of 𝐶𝑎0/𝐶𝑎(𝑂𝐻)2 as a heat storage material for CSP due to the high temperature (430 -
540 °C) at low pressure steam (0.2 – 2 bars). They experimentally study the decomposition/synthesis cycling of 8-g samples of 𝐶𝑎(𝑂𝐻)2 powder. They observe a gradual decrease of the performances due
to non-condensable gases that may be generated by corrosion of the vessel. More recently, Schmidt and Linder [15] experimented a fixed bed reactor to characterize the performance (temperature and thermal
6
power) of various discharge phases depending on the constraint pressure 𝑝𝑐 (0.04 to 4.7 bars) and heat
transfer rate of the coolant fluid. They show that the performances increase with the constraint pressure.
Recent work at PROMES-CNRS [16] investigated two levels: the thermochemical reactor and its integration in a CSP plant. They develop experimental characterizations of a fixed-bed reactor for various implementations of the reactive bed and propose a dynamic model, coupling kinetics, and heat and mass transfers. Moreover, they analyze the integration of such storage process into the Rankine cycle to increase the performance of the CSP plant during the storage and discharge phases. The present paper rebounds on this work.
Objective and novelty of this work
This paper aims at analyzing the economical optimization of a concentrated solar power plant implementing a storage system. To go beyond the flat feed-in tariff of electricity and the classical CSP business models, this work investigates a variable electricity price framework: the spot market. Therefore, innovative operating profiles correlated to these variable prices will be sought. The innovative scenarios that are implemented in this work take advantage of the specific features of the thermochemical storage. Furthermore, new ways of coupling the thermochemical storage with the Rankine cycle in both storage and discharge phases are considered (cf. Section 2)).
Therefore, for the sake of consistency with the aims of this work, it is necessary to develop an original techno-economic method, which optimizes both the storage design features and the operation of the entire plant over the year. To achieve it, physical and financial models are required and a model simplification approach must be applied to reduce the number of variables and to obtain continuously differentiable functions (cf. Sections 4.1 and 4.2). This last point enables to transform the optimal control problem into a constrainted real-valued optimization problem that is simpler and more robust (cf. Section 3)). The objective function of the optimization is the Net Present Value (NPV) over the plant’s lifetime. This metric is relevant for the purpose of the work because it considers the revenues of the power plant according to the variable prices of the spot market, as well as the investment, operation and maintenance costs. All mathematical developments of this method are fully presented by Salas et al. in a previous paper [17]. This paper focuses on the applications of this method i.e. on a techno-economic analysis of various results and on a specific analysis of the thermochemical storage system. To this end, the results of the optimization are discussed in Section 5 for two locations: Daggett, California, and Sevilla, Spain. This paper show that: (i) the optimized storage/discharge /production scenarios; (ii) the physical parameters, size and operating conditions of the thermochemical system; (iii) the energies involved in the various steps of the plant operation; (iv) the conditions of profitability of the plant on spot market depends on the location (i.e. exogenous data input).
7
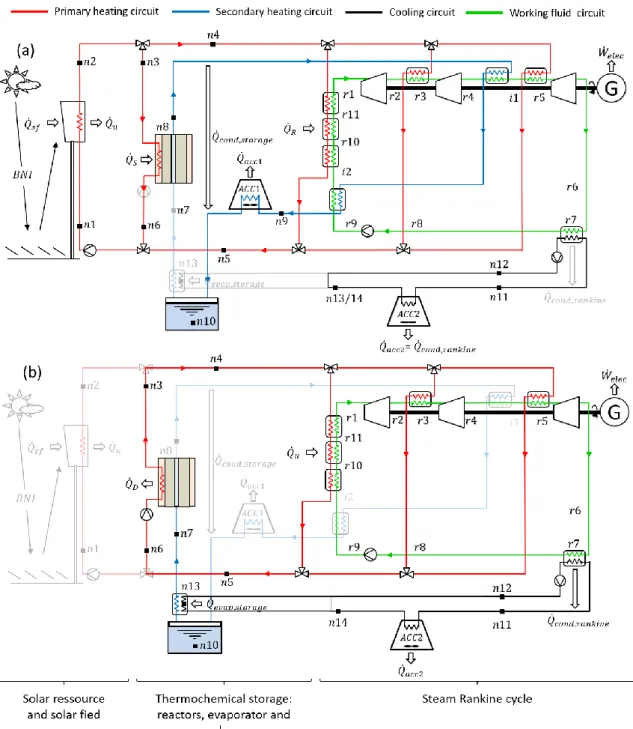
2) Power plant configuration
Fig. 1 presents the investigated power plant and its active parts during the storage (Fig. 1a) and discharge (Fig. 1b) phases.
Fig. 1: The solar power plant during (a) storage and/or production phase; (b) discharge phase
The plant is divided into three main parts: the solar field, the thermochemical storage and the Rankine cycle.
8
The solar field part encompasses the heliostat field and the solar receiver located at the top of a
tower. Each heliostat focuses the reflected solar Beam Normal Irradiance (BNI) on the receiver to heat a molten salt used as Heat Transfer Fluid (HTF). This HTF flows in the heating circuit (red loop).
The thermochemical storage is a closed loop composed of a thermochemical reactor, a condenser
(air-cooled), a condensed water tank and an evaporator. The so-called reactor is actually a set of fixed-bed reactors coupled in parallel, like a shell-and-tubes heat exchanger (Fig. 2). A similar reactor configuration has already been experimented for air-conditioning purposes [18]. Each tube is filled with a porous reactive composite, and it includes a central steam diffuser. The reactive composite consists of a compressed mixture of 𝐶𝑎(𝑂𝐻)2 and Expanded Natural Graphite (ENG) which is an inert binder
enhancing heat transfer [19]. Such composite is characterized by the density of the reactive medium (represented by the energy density 𝐷𝐸𝐶) and the apparent density of the ENG (𝜌̃𝐸𝑁𝐺). Both parameters
control heat and mass transfer characteristics within the porous medium [16]. They are expressed as follows: 𝐷𝐸𝐶 = 𝑚𝐶𝑎(𝑂𝐻)2∙ ∆ℎ𝑟 0 𝑀𝐶𝑎(𝑂𝐻)2∙ 𝑉𝑏𝑒𝑑 = 𝑚𝐶𝑎𝑂∙ ∆ℎ𝑟 0 𝑀𝐶𝑎𝑂∙ 𝑉𝑏𝑒𝑑 (3) 𝜌̃𝐸𝑁𝐺= 𝑚𝐸𝑁𝐺 𝑉𝑏𝑒𝑑 (4)
As shown on Fig. 2,the reactor radius 𝑟𝑠𝑤defines the heat and mass transfer length. The total volume
of reactive composite medium is: 𝑉𝑏𝑒𝑑 = 𝜋 ∙ (𝑟𝑠𝑤2 − 𝑟𝑑𝑖𝑓2 ) ∙ 𝐿𝑡𝑜𝑡, where 𝑟𝑑𝑖𝑓𝑓 is the steam diffuser radius
9
Fig. 2: Shell-tube thermochemical reactor
This thermochemical storage system operates as follow: (i) during storage phase, the endothermal reaction (Eq. (1)) occurs by consuming heat from the HTF at average temperature 𝑇𝑐𝑆. Water vapor is
released, cooled, condensed, and stored in the liquid water tank; (ii) during discharge phase, the evaporator is connected to the reactor, it vaporizes water from the water tank and provides it to the reactant. Thus, the exothermal reaction (Eq. (1)) occurs and the reaction heat is recovered by the HTF at average temperature 𝑇𝑐𝐷.
It is worth noting that in both phases, the pressure in the whole thermochemical system is imposed by the phase change i.e. the condenser imposes 𝑝𝑐𝑆 during the decomposition reaction, and the evaporator
imposes 𝑝𝑐𝐷 during the synthesis reaction. Unlike molten salt storage, thermochemical storage is an
active storage, because the storage and discharge power levels of a given reactor depend on the operating conditions 𝑝𝑐 and 𝑇𝑐.
The steam Rankine cycle also involves endothermal effects (preheating, boiling of the working
fluid, superheating of the steam) and exothermal effects (desuperheating and condensation). Therefore, a new concept of integrating the thermochemical storage and the Rankine cycle has been developed by associating endo- and exo-thermal processes occurring simultaneously. It operates as follows (cf. Fig. 1):
- during the discharge phase, the reactor could operate with a low temperature free source, but it
10
reactive medium (cf. Fig. 5). To increase this temperature, avoiding any additional heater, the solution implemented in this work is the recovering of the condensation heat of the Rankine cycle to heat the evaporator of the thermochemical storage (black cooling circuit in Fig. 1b). This connection is called integration 1 hereafter.
- during the storage and production phases, the reactor releases steam at high temperature (for
example, at 𝑝𝑐𝑆= 1 𝑏𝑎𝑟, 𝑇𝐶 ≈ 507 °𝐶). The desurperheat and condensation heat of this steam can
be recovered by the second reheat and the preheat of the Rankine cycle, respectively (cf. Fig. 1a). Thus, the Rankine cycle requires less solar input heat, and more heat from the solar field can be stored. This connection is called integration 2 hereafter.
Moreover, both integrations allow reducing the thermal power released to the environment (𝑄̇𝑎𝑐𝑐1 and
𝑄̇𝑎𝑐𝑐2).
3) Optimization principle
The modeling approach that will be presented in Section 4) is conditioned by the optimization method. This optimization method is fully presented by Salas et al. in [17]. General principles are recalled here. The main objective of this work is to optimize economically both the operation strategy and the design of the power plant, over the plant’s lifetime, given a location (i.e. weather data and electricity prices) and a power block (i.e. design net capacity). As explained previously, this problem belongs to Optimal Control theory. Without simplifications, the solution of this kind of problems must be sought in functional spaces (of infinite dimension), which is hard to solve. Consequently, simplifications were applied in order to use a constraint real-valued optimization technique. To this end, all models (physical and financial) are defined by a set of continuously differentiable functions as well as weather data and electricity prices. The operation strategy is determined from a pseudo-year as input. The pseudo-year is composed of four representatives weeks, one for each season of the year. A representative week is built from some average data over the season: (i) an average hourly BNI profile repeated day by day; (ii) an average hourly electricity price profile over a week. (iii) two constant ambient temperatures: one for daytime and another for nighttime periods. These data are approximated or interpolated to obtain continuously differentiable functions. Thus, the time-continuous optimization window lies on four weeks. To achieve the optimization over the plant lifetime, the results from this optimization window are multiplied by 13 to get a year, and by an actualization factor depending on the plant lifetime (𝑁 = 30 𝑦𝑒𝑎𝑟𝑠) and the real discount rate, 𝑖𝑟 (cf. Section 2.3 in [17] and [20]). As
11 𝑁𝑃𝑉 = −𝐶𝑜𝑠𝑡0+ ∑ 𝑅𝑒𝑣𝑘− 𝐶𝑜𝑠𝑡𝑘 (1 + 𝑖𝑟)𝑘 𝑁 𝑘=1 (5)
where 𝐶𝑜𝑠𝑡0 is the investment cost of the power plant, and 𝑅𝑒𝑣𝑘 and 𝐶𝑜𝑠𝑡𝑘 are the revenues and
operating costs of the k-th year, respectively.
In order to reduce the complexity of this problem, the outputs corresponding to the operation strategy are parametrized thanks to the definition of a pre-scheduled operation strategy called pre-scenario. Thus, all solutions are sought in a finite set of real numbers instead of a functional space. This means that the pre-scheduled operation strategy defines a set of possible working phases of the power plant. There are three possible working phases: storage, production and discharge. Fig. 3 shows an example of the pre-scenario over a single day in terms of thermal power.
Fig. 3: Pre-scheduled operation strategy over a single day
𝑄̇𝑠𝑓(𝑡) is the maximum thermal power that the solar field could deliver over the daylight period. The
pre-scenario over 24 hours is defined as follows:
Storage phase: the solar field feeds the thermochemical storage, in priority and in a constant way. Thus, a storage phase is defined by three variables: 𝑡𝑖𝑛𝑖𝑆 , 𝑡𝑓𝑖𝑛𝑆 𝑎𝑛𝑑 𝑄̇𝑆 .
Production phase: The pre-scenario assumes that this phase can only occur within the period of the storage phase. The surplus of solar thermal power feeds the Rankine cycle, which can run at part-load (from 20% to 105% of its design load). This phase is defined by two variables: 𝑡𝑖𝑛𝑖𝑃 , 𝑡𝑓𝑖𝑛𝑃 . Discharge phase: Several discharge phases could be planned, but this first study limits to two
discharge phases. Each phase delivers a constant power, and so it is defined by three variables: 𝑡𝑖𝑛𝑖𝐷 , 𝑡𝑓𝑖𝑛𝐷 𝑎𝑛𝑑 𝑄̇𝐷 .
12
Finally, the set of optimization variables of the problem is a mix between configuration variables of the reactor that are unique in the optimization window, and operation variables that can be different day by day, season by season:
- storage reactor configuration: 𝐿𝑡𝑜𝑡, 𝑟𝑠𝑤, 𝐷𝐸𝐶, 𝜌̃𝐸𝑁𝐺
- operating conditions of the thermochemical storage: 𝑝𝑐𝑆(𝑖), ∆𝑇𝑒𝑞𝑆(𝑖), 𝑝𝑐𝐷(𝑖), ∆𝑇𝑒𝑞𝐷(𝑖)
- schedule of the power plant operations: 𝑡𝑖𝑛𝑖𝑆 (𝑖, 𝑘), 𝑡𝑓𝑖𝑛𝑆 (𝑖, 𝑘) , 𝑡𝑖𝑛𝑖𝑃 (𝑖, 𝑘), 𝑡𝑓𝑖𝑛𝑃 (𝑖, 𝑘), 𝑡𝑖𝑛𝑖𝐷 (𝑖, 𝑘, 𝑗), 𝑡𝑓𝑖𝑛𝐷 (𝑖, 𝑘, 𝑗)
where 𝑖 ∈ {1, . . ,4} is the season index, 𝑘 ∈ {1, . . ,7} is the day index (of the representative week) and 𝑗 ∈ {1, … , 𝐽(𝑖, 𝑘)} is discharge index, where 𝐽(𝑖, 𝑘) is the number of discharge phases for the k-th day of the i-th season. The chosen optimization algorithm is the fmincon function of Matlab based on the interior-point method. The optimization is performed for different sizes of the solar field i.e. for discrete values of the Solar Multiple factor (SM) from 1.5 to 3.
4) Modeling
The optimization presented in this paper is based on a static model of each part of the power plant. As the behavior of the thermochemical reactor is time-dependent, averaged powers are considered. The transient steps of the Rankine cycle (startup and standby) are considered via some flat-rate rules. The solar field and the Rankine cycle are modeled based on the approach implemented in SAM software. These models are well documented, so this section details mainly the thermochemical storage.
4.1. System models
This subsection presents the models used for the main parts of the power plant, namely the solar field, the power block, the thermochemical storage, and the operating phases.
4.1.1. Solar field
The modeling of the solar field part expresses the maximum thermal power that the receiver could deliver (𝑄̇𝑠𝑓), and the useful thermal power collected by the HTF (𝑄̇𝑢). Therefore, 𝑄̇𝑠𝑓(𝑡) ≥ 𝑄̇𝑢(𝑡) and
in practice the difference between these quantities is managed by de-focusing a number of heliostats. These powers are expressed as follows:
𝑄̇𝑠𝑓(𝑡) = 𝐵𝑁𝐼(𝑡) ∙ 𝐴𝑚𝑖𝑟𝑟𝑜𝑟 ∙ 𝜂𝑜𝑝𝑡(𝑡) ∙ 𝜂𝑡ℎ(𝑡) (6)
𝑄̇𝑢(𝑡) = 𝑚̇1(𝑡) ∙ 𝑐̅𝑝,1∙ (𝑇2− 𝑇1(𝑡)) (7)
where 𝐴𝑚𝑖𝑟𝑟𝑜𝑟 is the total area of heliostats, 𝜂𝑜𝑝𝑡 the optical efficiency of solar field, 𝜂𝑡ℎ the thermal
efficiency of the receiver, 𝑇2 is fixed at 560 °C. BNI data is extracted from the Daggett TMY2 data
13
(NSRDB) of the NREL [21]. The total area of heliostats is calculated from the design capacity of the power block and the Solar Multiple (SM).
𝑄̇𝑠𝑓 is calculated hour by hour with the SAM software, and the daily time series is averaged for each
season and approximated with a polynomial function to get differential functions for each location and SM value.
4.1.2. Power block: steam Rankine cycle
The model uses the approach implemented in the SAM software, and fully presented in [22] and [23]. The method consists of three steps: (i) design modeling (ii) part-load modeling and (iii) reduction of the part-load model of the Rankine cycle.
First, the design cycle is built according to various assumptions on the thermodynamical state of cycle points. Then, by fixing the design net electrical power of the power block at 50 MWe, the design mass flow rate of the working fluid and the power of each transformation are deduced. Finally, the design cycle efficiency is 36 %.
Second, the part-load model considers the change in the performances of Rankine cycle components due to the variation of the mass flow rate (𝑚̇4) and inlet temperatures (𝑇4) of the hot HTF, and the inlet
temperature of the cooling circuit (𝑇11). For instance, the variation of the working fluid mass flow rate
affects the performance of the turbines (isentropic efficiency and pressure ratio), pumps, and heat exchangers (global thermal conductance). All equations are presented in [22].
Third, in order to obtain differentiable functions, the part-load model is approximated by a set of polynomial functions. First, a large number of simulations is performed from a sampling of the inputs such as (𝑚̇4, 𝑇4, 𝑇11)𝜖[148, 445] × [300, 560] × [20,100]. Then, the useful outputs are selected and
fitted by polynomial functions, allowing to calculate 𝑊̇𝑒𝑙𝑒𝑐,𝑛𝑒𝑡, 𝑇5, 𝑇12, 𝑚̇11, as a function of 𝑚̇4, 𝑇4, 𝑇11
as detailed in [17]. Moreover, several constraints are taken into account. For instance, the net electricity production 𝑊̇𝑒𝑙𝑒𝑐,𝑛𝑒𝑡 must be ranged between 20% and 105% of the design value 𝑊̇𝑒𝑙𝑒𝑐,𝑛𝑒𝑡,𝑑𝑒𝑠𝑖𝑔𝑛. All
constraints of the optimization problem are listed in [17].
4.1.3. Thermochemical storage
Fig. 4 shows the equilibrium lines, derived from the Clausius-Clapeyron relation (cf. [18]), for 𝐶𝑎0/𝐶𝑎(𝑂𝐻)2 and 𝐻2𝑂(𝑔)/𝐻2𝑂(𝑙) reversible transformations in a Clapeyron diagram. The storage
phase corresponds to the upper part, and the discharge phase to the lower part.
Before starting the storage phase, the condenser and the reactor are not connected. The HTF, at the constraint temperature 𝑇𝑐𝑆, first heats the reactor up to the equilibrium temperature 𝑇𝑒𝑞(𝑝𝑐𝑆). Then, as
14
vapor. Thus, the thermal power 𝑄̇𝑆 is stored as sensible heat, up to 𝑇𝑒𝑞(𝑝𝑐𝑆) , and afterwards in
thermochemical form.
In the same way, for the discharge phase, the reactor is first cooled down to 𝑇𝑒𝑞(𝑝𝑐𝐷) by the HTF at
constraint temperature 𝑇𝑐𝐷. During this step, 𝑄̇𝐷 recovers this sensible heat. Then, as shown in Fig. 4,
the reactor is connected to the evaporator and the exothermal synthesis starts. Thus, the discharged thermal power 𝑄̇𝐷 includes the reactor sensible heat and then thermochemical heat.
It is important to note that the constraint temperature of the reactor is bounded by the equilibrium temperature: it must be lower than 𝑇𝑒𝑞𝐷 in discharge phase and higher than 𝑇𝑒𝑞𝑆 in storage phase. The gap
∆𝑇𝑒𝑞𝑆 is the temperature difference between the 𝐶𝑎0/𝐶𝑎(𝑂𝐻)2 equilibrium temperature 𝑇𝑒𝑞𝑆 and the
constraint temperature 𝑇𝑐𝑆.
Fig. 4: Operating conditions of storage and discharge processes in Clapeyron diagram.
Red line: thermodynamic equilibrium of reaction Eq (1) with ∆ℎ𝑟0= 94.6 𝑘𝐽. 𝑚𝑜𝑙−1 ∆𝑠𝑟0= 121.2 𝐽. 𝑚𝑜𝑙−1. 𝐾−1[24]); Blue line : saturation condition of the phase change (Eq (2)).
The behavior of the thermochemical storage is defined by the global reaction advancement 𝑋(𝑡). The reactor ouputs, i.e. the storage or discharge thermal power 𝑄̇𝑆 or 𝑄̇𝐷, and the steam mass flow rate,
𝑚̇7 𝑜𝑟 𝑚̇8, can be calculated as functions of the reaction rate 𝑑𝑋 𝑑𝑡⁄ as follows:
𝑄̇𝑆/𝐷 = 𝐷𝐸𝐶 ∙ 𝑉𝑏𝑒𝑑∙ 𝑑𝑋 𝑑𝑡 = 𝐷𝐸𝐶 ∙ 𝜋 ∙ (𝑟𝑠𝑤 2 − 𝑟 𝑑𝑖𝑓2 ) ∙ 𝑑𝑋 𝑑𝑡 ∙ 𝐿𝑡𝑜𝑡 (8) 𝑚̇8/7= 𝑚𝐻2𝑂∙ 𝑑𝑋 𝑑𝑡 = 𝑄̇𝑆/𝐷∙ 𝑀𝐻2𝑂 𝛥ℎ𝑟 (9)
The global reaction rate 𝑑𝑋 𝑑𝑡⁄ depends on the heat and mass transfer in the reactive composite, the reaction kinetics and the constraints 𝑝𝑐 and 𝑇𝑐. A dynamic model has been developed according to
15
thermochemical reaction are solved for a one-tube reactor, with heat and mass transfer in radial direction, as described in Fig. 2. The kinetics strongly depends on ∆𝑇𝑒𝑞. Heat and mass transfer
parameters are correlated to the composite characteristics 𝐷𝐸𝐶 and 𝜌̃𝐺𝑁𝐸. The model is solved using
COMSOL software.
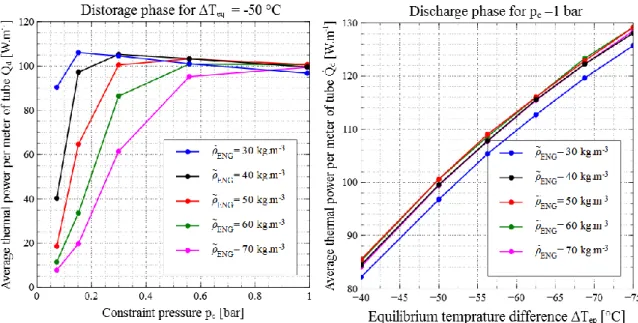
From this dynamic model, the averaged reaction rate (X/t, over the total reaction advancement) is considered to calculate the thermal power of the reactor 𝑄̇𝑆/𝐷. Fig. 5 shows examples, for discharge
phases, of the resulting unit thermal power (i.e. per meter of reactive tube) as function of 𝑝𝑐𝐷 and ∆𝑇𝑒𝑞𝐷,
respectively. At low constraint pressure, the performance of the reactor is lowered due to mass transfer limitations, and, for the configuration depicted in Fig. 5a., it is better to carry out the discharge reaction at pressure higher than 0.5 bar. However, that means that the evaporation temperature must be higher than 81 °C and such operation requires a heat source at that temperature. Fig. 5b highlights the storage thermal power increase with the temperature gap ∆𝑇𝑒𝑞.
Fig. 5: Thermal power per meter of tube during discharge phase as function of: a) the constraint pressure (at ∆Teq𝐷 = −50°C). b) the equilibrium temperature difference (at 𝑝𝑐𝐷=1 bar). In both cases: DEC = 200 kWh.m-2, rsw = 0.03 m.
As it has already been mentioned, the optimization method requires a model reduction to get a continuously differentiable function representing the thermal power of the thermochemical reactor. Therefore, various simulations were performed for a large sampling of the inputs, whose ranges are bounded from technical or thermodynamical considerations as follow:
16
Then, a Shepard’s interpolation is applied to this sampling to obtain a continuously differentiable approximation (cf. [17]). The model uses this interpolated function to express the thermal power 𝑄̇𝑆 and
𝑄̇𝐷.
4.1.4. The operating phases of the solar power plant
All parts of the power plant are now modeled with a set of continuously differentiable functions. From that, a system of equations is built for coupling these parts of the power plant in compliance with the various operating phases (storage, production and discharge) and the physical constraints of the problem. This system is directly solved at each iteration of the optimization processes. Details of this resolution are presented in [17].
4.2. Financial model
The financial model used to perform the techno-economic optimization is here presented. That is, the components of the Net Present Value in (Eq. (5)) are described. While the revenues 𝑅𝑒𝑣𝑘 have a
simple expression given by the integral of electricity price multiplied by the produced electrical power, the costs 𝐶𝑜𝑠𝑡𝑘 require a more detailed description.
First, the total investment cost is calculated with the following formulation derived from SAM software:
𝐶𝑜𝑠𝑡0= 𝐶𝑙𝑎𝑛𝑑+ (𝐶𝑠𝑜𝑙𝑎𝑟 𝑓𝑖𝑒𝑙𝑑+ 𝐶𝑅𝑎𝑛𝑘𝑖𝑛𝑒+ 𝐶𝑠𝑡𝑜𝑟𝑎𝑔𝑒) ∙ (1 + 𝜏𝑐) ∙ [1 + 𝜏𝑠+ 0.8 ∙ 𝜏𝑡] (10)
where 𝜏𝑐 is the contingency rate (fixed at 7 %); 𝜏𝑠 is the rate which considers the EPC
(engineer-procure-construct) and owner costs (fixed at 13 %); 𝜏𝑡 is the sales tax (5 %). The sub-costs of the power
plant are calculated as follows:
- 𝐶𝑙𝑎𝑛𝑑 and 𝐶𝑠𝑜𝑙𝑎𝑟 𝑓𝑖𝑒𝑙𝑑 : the cost of the land and solar field, are approximated as functions of the
Solar Multiple (SM): 𝐶𝑙𝑎𝑛𝑑 = 9000 ∙ (414 ∙ 𝑆𝑀 + 51.6), 𝐶𝑠𝑜𝑙𝑎𝑟 𝑓𝑖𝑒𝑙𝑑= 106∙ (57.765 ∙ 𝑆𝑀 +
14,373), both in €. The solar field cost depends on the latitude of the plant location. As Daggett and Sevilla have close latitude (34.86° N and 37.42° N), the same function is applied for both places.
- 𝐶𝑅𝑎𝑛𝑘𝑖𝑛𝑒 : the cost of the power block is proportional to the design gross capacity. In this study,
𝐶𝑅𝑎𝑛𝑘𝑖𝑛𝑒 is 66 M€
- 𝐶𝑠𝑡𝑜𝑟𝑎𝑔𝑒 : the cost of the whole storage system. Unlike the other costs, which are derived from
SAM software, this cost includes a specific model for the thermochemical storage. This model is based on the know-how of two industrial partners: (i) COLDWAY, a company which manufactures thermochemical reactors for different cooling and heating processes; (ii) ADF group, which proposes solutions for various industrial applications. They have developed specific tools to estimate the cost of a thermochemical reactor according to the design presented
17
in Fig. 2. Some technical parameters were fixed (internal diameter and height of a shell) according to technical and transportation issues. Afterwards, a set of calculations of the reactor costs per capacity (in €/kWh) was performed from a sampling of the configuration parameters 𝐷𝐸𝐶, 𝜌̃𝐸𝑁𝐺 and 𝑟𝑠𝑤. Finally, a polynomial approximation is applied to obtain the cost function
𝑔(∙), depending on the above physical variables. The total investment cost is calculated by multiplying this function by the amount of energy that is stored in the total reactor. Moreover, to take into account the uncertainty of this cost estimation, a cost factor 𝛽 (from 1 to 3) is applied, where β=1 captures the optimistic estimation, and β=3, the pessimistic one. Finally:
𝐶𝑟𝑒𝑎𝑐𝑡𝑜𝑟 = 𝛽 ∙ 𝑔(𝐷𝐸𝐶, 𝜌̃𝐸𝑁𝐺, 𝑟𝑠𝑤) ∙ 𝐷𝑒𝑐 ∙ 𝐿𝑡𝑜𝑡∙ 𝜋 ∙ (𝑟𝑠𝑤2 − 𝑟𝑑𝑖𝑓𝑓2 ) (11)
- the costs of the air cooler condenser 𝐴𝐶𝐶1 and heat exchanger (cf. Fig. 1) of the storage system are calculated respectively from [26] and form the CAPCOST correlations [27].
Thus, the total storage cost 𝐶𝑠𝑡𝑜𝑟𝑎𝑔𝑒 is the sum of these three costs (reactor, condenser and heat
exchanger) and an allowance was added in order to take into account piping and reservoir costs.
The operation and maintenance costs are divided into a fixed cost by capacity, set at 59.4 €/kWe/year and a variable cost depending on the generated energy, fixed at 3.15 €/MWhe. Moreover, energy consumption of the heliostat field (tracking) and pumps are taken into account (using SAM default values).
In this work, incentives, tax, insurance rates and debts are not taken into account. The analysis period corresponds to the lifetime of the power plant (30 years). The real discount rate is fixed at 3%. In order to interpolate the price curves for each location, electricity price data was downloaded from the CAISO website for California. The node price ALTA30ST_7_B1 nearest to Daggett was used. For Sevilla, data was downloaded from the Iberian Market Operator of Energy (OMIE) website. There is a single price profile for the country.
5) Results
The financial models, the performance models and the optimization method described in the previous sections are applied to two locations: Spain (Sevilla) and California (Daggett), and various Solar Multiple SM and cost factors β . This section discusses the optimized variables, summarizes the economical results based on the NPV, and the subsidies required for CSP plants to become economically neutral on the spot market of each location.
5.1. Scenarios for heat storage/ discharge and electricity production
Figures Fig. 6 and Fig. 8 show the optimized scenarios per season and for two typical cases: California (Daggett) for SM=2.5 and =2, and Spain (Sevilla) for SM= 3 and =1. Each figure presents
18
the profiles of the thermal and electrical powers involved in the storage/production/discharge phases over the representative week of each season. Each upper graph refers to the thermal energies involved in the system: (i) the maximal solar energy available from the solar field (light blue); (ii) the energy absorbed by the thermochemical system during its storage phase (dark blue); (iii) the solar energy consumed by the power block (area limited by red line and the higher dark blue line); (iv) the thermal energy provided by the storage system to the power block during discharge phases (green line). The lower graphs refer to the electricity production by the power block fed either directly by the solar collector (red line) or by the storage system in discharge mode (green line). Let’s recall that the chosen pre-scenario allows only two discharge phases (cf. Section 3)).
5.1.1. California (Daggett)
For this location, the ratio of electricity price, i.e. the maximum to minimum values, lies between 2.1 and 5.9, depending on the season. The peaks of price occur out of daylight period (just before and just after).
Fig. 6shows that the optimization leads, in most cases, to two discharge phases during working days, and only one discharge phase during weekend days. This figure highlights an interesting result of the optimization algorithm: instead of fully discharges the storage just after the production phase, as the classical strategy does, the storage is only partially discharged for the evening peak and the rest of stored energy is released the next morning for the morning peak. Nevertheless, during the weekend and summer, the “morning peak” prices are notably lower and the optimization leads to only one discharge phase after sunset. In some other cases, two discharge phases are juxtaposed: for example, at fall (t=30h) and in summer, the latter leading up to a quasi-continuous electricity production by the plant. Note that in all cases, the optimized production phase and discharge phase are contiguous in order to avoid the costs of the standby and restart of the Rankine cycle.
19
(c) summer (d) fall
Fig. 6: Optimized power plant operation for California, Daggett, for the typical week (the 1st day is Monday)
of each season, SM=2.5, β =2.
Fig. 7 analyses the optimized scenarios with respect to the solar multiple (for the same 50 MW power block) on the example of the spring week. For a small solar field (SM=1.5), the limited solar input only allows one discharge phase at the evening peak independently of days and seasons. For the largest solar multiple (SM=3), the scenarios involve two discharge phases for all days and seasons. Between these two boundary cases, two discharge phases appear, first for working days, then for weekend days in spring and summer. A quasi-continuous electricity production is reached in spring for SM=3, and from SM=2.5 in summer.
(a) SM = 1.5 (b) SM = 2
(c) SM = 2.5 (b) SM = 3
Fig. 7: Optimized power plant operation for California, Daggett, spring week, various solar multiples, β =2.
5.1.2. Spain (Sevilla)
The Fig. 8 shows the optimized strategy for winter and summer in Sevilla (Spain). Compared to Daggett, the electricity price is quite flat during the day (ratio of the maximum to minimum electricity price is between 1.5 and 3) and the solar input is significantly lower. Thus, the optimization algorithm
20
choses to fully discharge the storage after the production phase. That corresponds to the classical strategy of production in a flat feed-in tariff context, as Andasol power plant. Note that during the weekends, the day price is low and the peak occurs later in the evening. Therefore, the algorithm chooses to separate the production phase and the discharge phase even if that is cost consuming, to allow operating the discharge phase during the peak of price and to increase the revenue.
(a) winter (b) summer
Fig. 8: Optimized power plant operation for Sevilla, Spain, SM=3, β = 1.
5.2. Thermochemical storage
For a given location and solar multiple, the optimization process leads to an optimal thermochemical storage system described by operating variables for each season (constraint pressure and temperature 𝑇𝑐, 𝑝𝑐), and a set of design variables for the reactive composite (𝐷𝐸𝐶, 𝜌̃𝐸𝑁𝐺, 𝑟𝑠𝑤) . These variables define
the specific thermal power i.e. the power consumed or released by one unit tube of the storage reactor, as described in Fig. 5. A last optimization variable is related to the size of the storage reactor (i.e. total length Ltot or total mass of reactant mtot) that fixes the total thermal power of the whole reactor and the
total stored energy.
Table 1 presents the optimal values of the design variables for the Californian site. The optimization process leads to very close values of these parameters 𝜌̃𝐸𝑁𝐺, 𝐷𝐸𝐶, 𝑟𝑠𝑤 whatever the solar multiple is.
This result means that the total length of reactor tubes is the sole variable that significantly varies in order to adapt both, the thermal power and the energy stored in the reactor, to the size of the solar field (SM).
Table 1: Optimized variables of the design of reactors (case: Daggett, all SM and β values) 𝐷𝐸𝐶𝑜𝑝𝑡 [𝑘𝑊ℎ. 𝑚−3] 𝜌̃𝐸𝑁𝐺,𝑜𝑝𝑡 [𝑘𝑔. 𝑚−3] 𝑟𝑠𝑤,𝑜𝑝𝑡 [𝑚] Optimized point 297.3 +/- 16 30 +/- 5 0.0612+/- 0.001
21
Moreover, the optimized values of 𝐷𝐸𝐶 and𝜌̃𝐸𝑁𝐺 are very close to the highest and lowest boundary
of their range, respectively. This high energy density 𝐷𝐸𝐶𝑜𝑝𝑡 leads to smaller and therefore cheaper
reactors. Nevertheless, this high density could limit mass transfer, but, the low value 𝜌̃𝐸𝑁𝐺,𝑜𝑝𝑡 avoids
this limitation, as highlighted in Fig. 5a.
Regarding the size of the reactor storage, the amount of reactant mtot (Table 2) increases with the
Solar Multiple, but in a nonlinear way. At low Solar Multiple, the storage size is limited by the low amount of available solar energy. At high Solar Multiple, any additional mass of reactant will increase the storage costs but it will generate only weak revenues as it could be used only in winter and fall, because the production profiles already reach a quite continuous operation in summer and spring as displayed in Fig. 2.
Table 2: Mass of CaO, mtot in tons, in the optimized storage reactors (Daggett, California)
SM 1.5 2.0 2.5 3.0
1869 2936 3595 3751
1874 2196 2935 3045
1655 1975 2091 2447
Table 3 presents examples of the optimized values of the operation variables of the thermochemical storage. Recall that the kinetics, and therefore the thermal power of the storage system, strongly depends on them. These variables are different with respect to seasons and storage/discharge phases, which can be explained as follows:
- discharging phases: for a given Solar Multiple, the reactor has to provide the same thermal power to the Rankine cycle which always operates at the same level (105% of its nominal power) as shown on Fig. 6. Therefore, the reactor will also operate at the same operating conditions regardless the season.
- storage phase: the solar source input strongly changes with seasons, and therefore, operating pressure and temperatures have to evolve in order to adapt the reactor thermal power to this source.
Table 3: Operation variables of the thermochemical storage (Daggett, California, SM=2.5, β = 2) Season pcS [bar] ∆TeqS [°C] pcD [bar] ∆TeqD [°C]
Winter 0.2 95 0.5 -105
Spring 0.5 73 0.5 -105
Summer 0.5 64 0.5 -105
22
5.3. Energies involved in the whole plant
The thermal energies and the electricity productions involved in storage, production and discharge phases are plotted on Fig. 9. The total absorbed solar energy and electricity production obviously increase with the size of the solar field. Nevertheless, the relative gain in electricity production declines with respect to the solar field size (SM) for similar reasons as discussed for the storage size results (in Table 2).
The previous energy profiles (Fig. 6 and Fig. 8) have demonstrated that the power block almost always operates at its maximal level, whatever the mode (direct solar production or discharge phases), the seasons and Solar Multiple are. Therefore, the direct electricity production (i.e. during storage-production phases) is almost constant with respect to SM (solid blue line on Fig. 9). The solar plant increases its total electricity production thanks to the discharge phase and this production becomes higher than the direct electricity production from SM about 1.9.
Fig. 9: Energies involved per year of operation of the optimized power plant (Daggett, California, =1)
Fig. 9 also underlines the relevance of the integration 2 of the thermochemical storage in the solar plant as described in Section 2). It shows the significant difference between the direct input from the solar field (squares and solid red line) and the total heat input (triangles and solid red line) to the power block: thanks to this integration, about 23 to 26% (according to SM and ) of the energy consumption of the power block is recovered from the reactive vapor released by the reactor during the storage phase. Therefore, the thermochemical storage adds not only an electricity production during discharge phases but it also allows a higher electricity production during storage phases.
23
The revenues of the optimized power plant notably grows with the solar multiple, and it is significantly higher than without any storage system: more than two times higher, from SM=2.4, in California (Fig. 10). Nevertheless, this figure shows a weak variation of the storage cost compared to the much larger growth of the solar field cost with SM. The thermochemical storage represents from 7 to 16% of the total investment while the solar field reaches 42 to 50% (according to SM and . Therefore, the investment costs rise up larger than revenues, and despite the strong improvement coming from the optimized scenario and thermochemical storage, regardless the case study, the resulting NPV is always negative.
Fig. 10: Financial results of the optimization of the power plant configuration and operations (Daggett, = 1) Therefore, financial supports as subsidies are always required for CSP, even when operating on spot markets. The required subsidy is defined as:
Required subsidy =−NPV
Eelec (12)
where Eelec is the electricity generated over the lifetime of the plant. Obviously, the best case
corresponds to the lowest required subsidy. The figures Fig. 11 and Fig. 12 present the subsidies required for each location, as function of the Solar Multiple. They compare the cases with and without storage systems. For the Californian site, the “classical” scenario is added (i.e. the scenario involving only one discharge phase at sunset just after the direct solar production phase as described in [17]).
24
Fig. 11: Subsidies required for Daggett (California) Fig. 12: Subsidies required for Sevilla (Spain)
On spot market, the development strategy of a CSP plant is clearly different depending on the exogenous inputs (solar resource and electricity price).
In Daggett (California), for any investigated storage cost, it is always better to store energy and so to shift a part of the production, because, as illustrated in Fig. 10, the storage allows generating more
revenues by exploiting the higher electricity prices of the peak periods. In Daggett, with this study assumptions, a Solar Multiple of 2 is the best trade-off.
Compared to the classical scenario, the optimization of both the storage characteristics and the operating modes lead in all cases to higher revenues (up to 5.8%) and higher amount of stored energy (up to 17.5%). The subsidies are also lower, down to -7.6% (cf. Fig. 11).
In Sevilla (Spain) and for SM values lower than 2, the difference of electricity prices between the lowest ones and the peak period is not high enough (cf. Fig. 8) to clearly choose between the storage and the no-storage strategy. However, a storage system offers the advantage to damp the meteorological solar variations. For SM higher than 2, the storage strategy becomes better than no-storage strategy only if the storage is not “too expensive” (β < 2).
The required subsidies, for the whole set of SM and values, are respectively from 12 to 22 €/MWhe for Daggett, and 34 to 50 €/MWhe for Sevilla.
Finally, in this business model, the market pays a part of the service and the government pays the rest in order for the CSP plant to become economically neutral (NPV = 0) or profitable (NPV > 0). Note that, in the Californian case, this subsidy is much lower than the usual flat feed-in tariffs.
25
Moreover, let’s recall that the spot market is a really challenging framework for the economical optimization of a CSP plant because the prices of electricity on this market are significantly lower than the tariffs of current CSPcontracts. For the example of the Californian market, these prices range from 5 to 55 €/MWh (cf. figure 1). On the other hand, the lowest price for future projects in China is 60€/MWh.
6) Conclusion and perspectives
These investigations focus on two original features: the economical optimization in the framework of the spot market, involving strong variations of the price of electricity, and the integration of a thermochemical storage system. This study first proves the relevance of the methodology optimizing at the same time the thermochemical storage characteristics and the operation of the whole plant, based on pre-scenarios for the operation of the plant, and on the Net Present Value as economical criterion.
This optimization leads to original scenarios involving one to two discharge phases, according to the day (working day or weekend), season, solar multiple, and location. These scenarios depend on the availability of the solar energy input and on the electricity price on the spot market. In most cases, the power block operates at its maximum load.
Regarding the thermochemical storage, the optimization selects the highest energy density of the storage material (reducing the size and cost of the storage) and adapts the other storage characteristics to meet the demand in terms of power. This study also proves that the innovative integration of the thermochemical storage in a solar power plant proposed in this work enhances the global electricity production during both charge and discharge phases.
Nevertheless, this optimization process induces an upper limit for the electricity production and revenues resulting from such storage. Indeed, the storage can lead up to a baseload electricity production when the solar input is high, such as in summer or, in some cases, in spring. Therefore, enlarging the storage size will increase its costs, while the use of this extra storage will be restricted to winter or fall.
The financial results demonstrate that the revenues increase significantly with storage and solar multiple. From about SM=2, the revenues from discharge production exceed those from the direct solar production of electricity. Nevertheless, the total revenues of the solar plant with respect to the spot market are too low to overcome the high cost of the solar field, and the NPV over the plant lifetime is always negative. Such power plant operating with the spot market needs subsidies estimated from 12 €/MWhe according to the cases. They are much lower than feed-in tariff of classical solar plant business models.
26
Future research should first broaden the assumptions of this work by analyzing, for example, the costs of components, as they evolve rapidly, or by exploring other technologies such as parabolic trough systems or power blocks with steam extraction, etc. In addition, the NPV optimization could be more relevant for electricity price profiles involving larger fluctuations over days, weeks and seasons, due to changes in electricity demand or in public policies (integration of environmental and network management costs, for example). A second research direction should take advantage of the specificities of a thermochemical storage process and its ability to store energy for long periods. This feature opens the scope of operation scenarios involving larger time shifts between storage and discharging phases, from weekly or monthly storage to seasonal storage, or to new scenarios involving periods entirely devoted to storage or to discharge.
Acknowledgements
We thank the ANR, the French Agence Nationale de la Recherche, for its financial support through the project ANR-12-SEED-0008 In-STORES Integration of a thermochemical storage process in a Rankine cycle driven by concentrated solar energy. This research also benefited from the support of the « FMJH Program Gaspard Monge in optimization and operation research», and from the support to this program from EDF.
References
[1] Teske S, Leung J, Crespo L, Bial M, Dufour E, Richter C. Solar Thermal Electricity - Global Outlook 2016. 2016.
[2] NREL. Concentrating Solar Power Projects | Concentrating Solar Power | NREL n.d. https://www.nrel.gov/csp/solarpaces/ (accessed September 14, 2017).
[3] Denholm P, Wan Y, Hummon M, Mehos M. An Analysis of Concentrating Solar Power with Thermal Energy Storage in a California 33% Renewable Scenario, Technical Report: NREL/TP-6A20-58186. Golden, Colorado 80401: 2013.
[4] U.S. Energy Information Administration (EIA). Natural gas generation and electricity imports used to follow load in California - Today in Energy - U.S. Energy Information Administration (EIA) 2016. https://www.eia.gov/todayinenergy/detail.php?id=27832 (accessed January 18, 2018).
[5] Milanič M, Jia W, Nelson JS, Majaron B. Numerical Optimization. vol. 43. Springer New York; 2006. doi:10.1007/978-0-387-40065-5.
[6] Hummon M, Denholm P, Jorgenson J, Mehos M. Modelling Concentrating Solar Power with Thermal Energy Storage for Integration Studies, Preprint, Conference Paper:
NREL/CP-6A20-27 60365. Golden, Colorado 80401: 2013.
[7] NREL. System Advisor Model (SAM) n.d. https://sam.nrel.gov/ (accessed January 18, 2018). [8] Guédez R, Spelling J, Laumert B. Thermoeconomic Optimization of Solar Thermal Power Plants
with Storage in High-penetration Renewable Electricity Markets. Energy Procedia 2014;57:541– 50. doi:10.1016/j.egypro.2014.10.208.
[9] Wittmann M, Eck M, Pitz-Paal R, Müller-Steinhagen H. Methodology for optimized operation strategies of solar thermal power plants with integrated heat storage. Sol Energy 2011;85:653– 9. doi:10.1016/j.solener.2010.11.024.
[10] Casati E, Casella F, Colonna P. Design of CSP plants with optimally operated thermal storage. Sol Energy 2015;116:371–87. doi:10.1016/j.solener.2015.03.048.
[11] Schaube F, Wörner A, Tamme R. High temperature thermo-chemical heat storage for CSP using gas-solid reactions. SolarPaces Conf., 2010. doi:10.1115/1.4004245.
[12] Michel B, Mazet N, Neveu P. Experimental investigation of an innovative thermochemical process operating with a hydrate salt and moist air for thermal storage of solar energy: Global performance. Appl Energy 2014;129:177–86. doi:10.1016/J.APENERGY.2014.04.073.
[13] Zhang H, Huys K, Baeyens J, Degrève J, Kong W, Lv Y. Thermochemical Energy Storage for Power Generation on Demand. Energy Technol 2016;4:341–52. doi:10.1002/ente.201500261. [14] Rosemary JK, Bauerle GL, Springer TH. Solar Energy Storage Using Reversible
Hydration-Dehydration of CaO-Ca(OH)2. J Energy 1979;3:321–2. doi:10.2514/3.62440.
[15] Schmidt M, Linder M. Power generation based on the Ca(OH)2/ CaO thermochemical storage system – Experimental investigation of discharge operation modes in lab scale and corresponding
conceptual process design. Appl Energy 2017;203:594–607.
doi:10.1016/j.apenergy.2017.06.063.
[16] Boulnois G. Intégration d’un Procédé de Stockage Thermochimique à une Centrale Solaire Thermodynamique : de l’Expérimentation à l’Echelle Matériau aux Performances Energétiques à l’Echelle Système [Ph.D. thesis]. Université de Perpignan Via Domitia, 2016.
[17] Salas D, Tapachès E, Mazet N, Aussel D. Economical optimization of thermochemical storage in concentrated solar power plants via pre-scenarios. Energy Convers Manag 2018;174:932–54. doi:10.1016/J.ENCONMAN.2018.08.079.
28
process for solar air-conditioning. Energy 2012;41:261–70. doi:10.1016/j.energy.2011.07.029. [19] Mauran S, Prades P, L’Haridon F. Heat and mass transfer in consolidated reacting beds for
thermochemical systems. Heat Recover Syst CHP 1993;13:315–9. doi:10.1016/0890-4332(93)90055-Z.
[20] Aussel D, Neveu P, Tsuanyo D, Azoumah Y. On the equivalence and comparison of economic criteria for energy projects: Application on PV/diesel hybrid system optimal design. Energy Convers Manag 2018;163:493–506. doi:10.1016/J.ENCONMAN.2017.12.050.
[21] US National Renewable Energy Laboratory. National Solar Radiation Database (NSRDB) n.d. https://nsrdb.nrel.gov/ (accessed October 16, 2018).
[22] Patnode AM. Simulation and Performance Evaluation of Parabolic Trough Solar Power Plants [Master’s thesis]. University of Wisconsin-Madison, 2006.
[23] Wagner MJ. Simulation and Predictive Performance Modeling of Utility-Scale Central Receiver System Power Plants [Master’s thesis]. University of Wisconsin-Madison, 2008.
[24] Samms JAC, Evans BE. Thermal dissociation of Ca(OH)2 at elevated pressures. J Appl Chem 1968;18:5–8. doi:10.1002/jctb.5010180102.
[25] Michel B, Neveu P, Mazet N. Comparison of closed and open thermochemical processes, for
long-term thermal energy storage applications. Energy 2014;72:702–16.
doi:10.1016/J.ENERGY.2014.05.097.
[26] Wagner MJ, Kutscher CF. Assessing the impact of heat rejection technology on CSP plant revenue. SolarPaces Conf., Perpignan: 2010, p. 1–9.
[27] CAPCOST Program. Appendix a Cost Equations and Curves for the CAPCOST Program | Chemical Equipment | Pressure n.d. https://fr.scribd.com/document/218706308/Appendix-a-Cost-Equations-and-Curves-for-the-CAPCOST-Program (accessed October 4, 2017).