A Comparative Study of Lotka-Volterra and System Dynamics Models for
Simulation of Technology
Industry Dynamics
by
Hakki 6zgir
Onver
Doctor of Philosophy in Mechanical Engineering Middle East Technical University, 2000 Master of Science in Mechanical Engineering
Middle East Technical University, 1996 Bachelor of Science in Mechanical Engineering
Middle East Technical University, 1993
Submitted to the System Design and Management Program in Partial Fulfillment of the Requirements for the Degree of
Master of Science in Engineering and Management at the
Massachusetts Institute of Technology
May 2008
© 2008 Hakki Ozgur Onver
All Rights Reserved
The author hereby grants to MIT permission to reproduce and distribute publicly paper and electronic copies of this thesis document in whole or in part.
Signature of Author ... ...
Hakki OzgOr Onver
System Design and Management Program May 2008
C e rtified By... ... . ... . ... . ... James M. Utterback
David .McGrath jr (1959) Professor of Management and Innovation
and Professor of Engineering Systems
/ •
/•T
(
t n Thesis Supervisor Accepted By... MASSACHUSETTS INSTITUTE OF TEGHNOLOGYJUL 0 3 2008
LIBRARIES
t-• Pat Hale Director System Design & Management ProgramA Comparative Study of Lotka-Volterra and System Dynamics Models for
Simulation of Technology
Industry Dynamics
by
Hakki Ozgur Unver
Submitted to the System Design and Management Program in Partial Fulfillment of the Requirements for the Degree of
Master of Science in Engineering and Management
Abstract
Scholars have developed a range of qualitative and quantitative models for
generalizing the dynamics of technological innovation and identifying patterns of
competition between rivals. This thesis compares two predominant approaches in
the quantified modeling of technological innovation and competition. Multi-mode
framework, based on the Lotka-Volterra equation barrowed from biological
ecology, provide a rich setting for assessing the interaction between two or more
technologies. A more recent approach uses System Dynamics to model the
dynamics of innovative industries. A System Dynamics approach enables the
development of very comprehensive models, which can cover multiple
dimensions of innovation, and provides very broad insights for innovative and
competitive landscape of an industry.
As well as comparing these theories in detail, a case study is also performed on
both of them. The phenomenal competition between two technologies in the
consumer photography market; the recent battle between digital and film camera
technology, is used as a test case and simulated by both models. Real market data
is used as inputs to the simulations. Outputs are compared and interpreted with
the realities of the current market conditions and predictions of industry analysts.
Conclusions are derived on the strengths and weaknesses of both approaches.
Directions for future research on model extensions incorporating other forms of
innovation are given, such as collaborative interaction in SME networks.
Thesis Supervisor: James M. Utterback
Title: David J. McGrath jr (1959) Professor of Management and Innovation and Professor of Engineering Systems
Table of Contents
List of Figures ... 5
List of Tables... 6
Acknow ledgem ents ... ... 7
1. Introduction...9
Outline ... 10
2. Overview of key concepts and models in technological innovation ... ... 12
Innovation and industrial evolution ... ... 12
Fluid Phase ... ... 12
Transitional Phase ... ... 14
Specific Phase ... ... 15
Dom inant design and industry landscape ... ... 15
Patterns in the em ergence of disruptive innovations ... ... ... 17
S-curve ... ... 17
Manager's dilemma: to listen or not to listen to the customer? ... .... 19
How to identify a disruptive technology? ... ... 22
Technology adoption, lead user innovation and communities... ... ... 24
Diffusion of Innovations ... ... 24
Lead user innovation ... ... 25
Product architecture and platform s... ... 27
Defining architectural innovation ... ... 27
Product architecture and industry cycles... ... 28
Product platform s ... ... 32
3. Lotka-Volterra m odel and dynam ics of com petition ... ... 37
M ulti-m ode interaction am ong technologies ... ... 37
Solution of Lotka Volterra equations ... ... 38
Pure com petition... ... 39
Sym biosis ... ... 39
Predator-prey interaction ... ... 40
4. System dynam ics and innovation m odeling... ... 41
Introduction to m odeling w ith System Dynam ics ... ... 41
Dynam ics of Innovation... ... 43
5. Comparison of L&V model and SD in modeling innovation dynamics using a Case Study ... 46
Simulation by System Dynamics model ... ... 46
Simulation by Lotka and Volterra model... ... 54
Numeric solution of Lotka and Volterra ... ... 54
Use of spread sheet for simulating Lotka- Volterra equations ... 55
6. Discussion of results ... ... 62
Landscape of consumer imaging market in 2008 ... ... ... 63
Performance characteristics of new technology which drives competition ... 65
Limits to growth ... ... 67
Structural changes in the market ... ... 68
Re-invigoration of old technology ... ... 70
Niche market for old technology... ... 72
Network effects boosting adoption of new technology ... ... 73
7. Conclusion ... ... 74
Future work ... ... 76
Bibliography ... 78
Appendix A ... ... 82
List of Figures
Figure 1 The dynam ics of innovation ... ... 13
Figure 2 Ecology of business succession ... ... 16
Figure 3 Number of firms in the U.S. typewriter industry ... 17
Figure 4 Performance dynamics of an established and an invading product ... 18
Figure 5 Burst of improvement in challenged product ... 19
Figure 6 Capacity demanded vs. capacity supplied in Hard Disks... ... 21
Figure 7 Pattern of the disruptive technology ... ... 23
Figure 8 Rogers' technology adoption lifecycle model ... ... 24
Figure 9 Lead user innovation ... ... 26
Figure 10 Abernathy and Clark' s framework for innovation types ... .... 27
Figure 11 Vertical Industry Structure and Integral Product Architecture in the Computer Industry ... 29
Figure 12 Horizontal Industry Structure and Modular Product Architecture in the Computer Industry ...30
Figure 13 The Double Helix M odel ... ... 31
Figure 14 The product family approach to new product development... ... 33
Figure 15 Platform Strategies... ... 34
Figure 16 Generational walkman innovations at Sony ... ... 35
Figure 17 System dynamics model of new product adoption... ... 42
Figure 18 Simulation results of new production adoption model ... .... 42
Figure 19 Integrated conceptual model for dynamics of innovation...44
Figure 20 Num ber of firm s in the m arket ... ... 44
Figure 21 W illingness to adopt new technology ... ... 45
Figure 22 Dynamics of entry-exit of firms into digital camera market ... ... 47
Figure 23 Dynamics of price for film and digital cameras... 48
Figure 24 Dynamics of product performance for digital cameras ... .... 49
Figure 25 Dynamics of user willingness to switch digital cameras ... ... 51
Figure 26 Dynamics of film and digital camera unit sales ... ... 52
Figure 27 Dynamics of units in use for film and digital cameras...53
Figure 28 Formulation of Lotka- Volterra equations in excel sheet...56
Figure 29 Formulation of error function for curve fitting ... ... 57
Figure 30 Use of solver add-on for optimizing equation parameters... ... 58
Figure 31 Optimized parameters as solver converges to a solution ... .... 59
Figure 32 Predicted values for film and digital sales based on solver's optimization... 60
Figure 33 Simulation graph representing technology battle between film and digital cameras...61
Figure 34 Consumer transition to digital is over... 64
Figure 35 Major post-capture activities of users ... ... 65
Figure 36 Image quality and resolution are key to digital camera purchase ... 67
Figure 37 Pressures on Point and Shoot type cameras... 69
Figure 38 Camera phone quality requirements to overtake digital cameras ... 69
Figure 39 Technology re-invigoration ... ... 70
Figure 41 Num ber of com panies in the market ... ... 82
Figure 42 Level of Technology... ... 82
Figure 43 Product units in use ... ... 83
List of Tables
Table 1Multi mode framework for assessing the interaction among technologies ... 37Table 2Lotka-Volterra and System Dynamics compared ... 62
Table 3 Actual data used as input to Lotka-Volterra and System Dynamics models ... 84
Acknowledgements
I am grateful to my thesis advisor, Prof. James M. Utterback, for his guidance and support all through
this study. It was a privilege and unique experience to learn Technology and Innovation Management from him. I am also deeply thankful to Henry B. Weil, for sharing his ideas, experiences and major work on system dynamics based modeling of innovation.
My deep appreciation goes to all SDM staff, particularly, Pat Hale, Director of SDM, and Helen Trimble, Career Development Director, for their constant efforts and support for my career advancement and success in Systems and Technology leadership. I am also thankful to Mr. John Masciola, V.P. of
Instrument R&D, who provided leverage and flexibility during my study, and other co-workers for their support at Caliper Life Sciences, Hopkinton MA.
Finally, I would like to thank to my wife, Nilgun, and my family whose encouragement have sustained me and to all my friends, who shared my experience and joy over the course of my fellowship in the Systems and Technology Management field at MIT, Cambridge MA.
1. Introduction
Technological innovation has been the most powerful thrust behind economic growth and rising standards in our quality of life. In the last century industrial growth and GDP of many nations has been rising at an unprecedented pace, especially in industrialized and emerging nations, which were successful in adopting open-market and free-trade policies and practices. In open markets, firms compete with their products and services depending on their superiority and attributes such as quality, performance, flexibility, cost, or timing. Innovation activities, both inside and outside of firms, are significant determinants of these attributes, and the success or failure of firms [Suarez 2003]. Recently, examining these activities and modeling the dynamics of innovation, both qualitatively and quantitatively, has received significant attention by many scholars, and institutional researchers. As
research in this area reveals more about the dynamics and determinants of success or failure in open markets, the findings will have significant impact on developing better policies, and setting the course for sustainable growth by regulators of established markets and new adopters, and accumulating a valuable knowledge base for the guidance and betterment of players in the open market arenas [Dosi
1982].
This thesis' focus is the comparison of two methodologies, Lotka-Volterra and System Dynamics, used in the quantified modeling of technology industry dynamics. It builds on decades of research and the work
of Abernathy, Clark, Pistorius, Utterback and Weil. The framework for multi-mode interaction among the technologies of Pistorius and Utterback not only identifies different forms of technological battles between competing technologies, it also provides a numerical solution model based on differential Lotka-Volterra equations for n-numbers of technologies [Pisterious and Utterback 1997]. Their unique framework captures the reality that interaction between technologies is not always confrontational. In fact this interaction can manifest itself reciprocally when one technology may either enhance or inhibit
another technology's growth. In their work three possible modes of interaction exist, pure competition where both technologies inhibit the other's growth rate, symbiosis where both technologies enhance the other's growth rate, and predator-prey interaction where one technology enhances the other's growth rate, but the second inhibits the growth rate of the first. The multi-mode framework with model formulation for simulation provides one of the richest frameworks for examining the interaction of
technologies. Multiple modes, further account for the transitionary effects as the interaction between the technologies transgresses from one mode to another, with time.
Recent work of Weil and Utterback captures and analyzes the fundamental dynamics of innovative industries within a System Dynamics model. System dynamics is an approach used to understand the behavior of complex systems over time. It deals with internal feedback loops and time delays affecting the behavior of an entire system. What makes using system dynamics different from other approaches to study complex systems is the use of feedback loops, stocks and flows. These elements help describe how even seemingly simple systems display baffling nonlinearity. In their work, Weil and Utterback selectively reviewed the literature, and identified fundamental dynamics as the sources of innovations and their impacts on firms, markets, and industries, such as entry exit of firms, experimentation and innovation, technology evolution, improvements in cost and performance, emergence of standards and dominant designs, adoption of new technology, network effects, development of a mass market, market growth, market saturation, intensity of competition and commoditization. They created conceptual models capturing these dynamics and then converted them into System Dynamics simulation models representing two competing technologies. The simulation results approximate many actual cases.
In order to provide a common base for comparison, in this thesis we chose two distinct technologies in the photography market, which have been in competition since early 1990s. Digital and film camera technologies excluding camera phones are our choice for this particular case. When Kodak's first digital camera appeared on the market more than a decade ago, it was perceived as more novel than practical for both professional and amateur photographers. Prices were well above the thousands, image resolution and quality was poor, and the cameras were bulky and inconvenient to use. Over time as key performance metrics drastically improved, and many new entrants rushed into emerging market, each year hundreds of new models flooded the mass market, rapidly melting the dominance of film based cameras. After a two decades transition period, many industry analysts agree that the technology transition is over, and the only question remaining is whether film cameras can stay forever in with, may be one or two niches, or will they only be staged in technology museums.
Outline
In the second chapter we summarize key concepts and models in technological innovation. We reviewed the literature and major contributions to the field. Focus areas include, technological innovation, emergence of dominant design, patterns of emergence in disruptive innovations. We overview predominant examples in technology history, such as the evolution of the printing business, and hard disk drive industry. Then we highlight marketing frameworks such as technology diffusion and lead user
innovation. We also examine product architecture by relating it to industry structure, and reviewed essential frameworks, developed by world renowned scholars.
In chapter three, we dive into the details of the Lotka-Volterra model, and its formulation. We drive its numerical solution and explain in detail its use in the multi-mode framework of technology competition. Similarly in chapter four we explain the details of the System Dynamics model which is developed for simulating the dynamics of innovative industries. Although we go through the conceptual models in this chapter, the details of simulation model are placed in the Appendix for user's review.
In chapter five, we compare the outputs of both models in detail. First the outputs of System Dynamic model are presented. System dynamics model provides us with a rich portfolio of results in several attributes of technology competition. For the simulation of the Lotka-Volterra model, we go step by step through how the numerical solution of the model is implemented in a spreadsheet and its linear optimization package is used to generate optimal parameters in order to do best curve fitting on the actual data. Later, the model with optimized parameters is used for predicting future dynamics of competition between two technologies.
In chapter six, we discuss two models, and the results of camera market case study. We not only compare the simulation outputs, but also incorporate the findings and research of media, industry articles, and analysis reports of market research companies in order to reflect on real market conditions,
in each compared dimension.
2. Overview of key concepts and models in technological innovation
Innovation and industrial evolution
The model proposed by Abernathy and Utterback captures the dynamics of the rate of major innovation over time within an industry. This model cuts through two dimensions: 1) the components of product innovation, process innovation, competitive environment and organizations; and 2) the life cycle of the industry, itself.
The model characterizes the evolution of an innovative industry in three phases; fluid, transitional, and specific. These three phases are associated both with rate of innovation and the underlying dimensions of the product, process, competition, and organization. The dynamic model of the rate of innovation and the significant characteristics of each phase, as they apply to product, process, competition and organization, are presented in figure 1.
Fluid Phase
In the fluid phase of a technology's evolution, the rate of innovation is very high and rapid. The technologies in the market are usually, crude, expensive, and unreliable. Uncertainty defines user needs and new technologies worked on. Functional product performance is the main basis for competition among competitors in the industry, which usually has an entrepreneurial character. Importance of Intellectual Property is very high as propriety technologies are firms' core resource for capturing and improving market share.
Process innovation takes secondary attention at this stage. Frequent changes in product design, features and characteristic, uncertainty in technologies and market conditions, relatively small and fragmented market sizes, high profit margins caused by proprietary technologies do not provide enough motives for investing in process innovation. Manufacturing requires high flexibility, which can be best attained by a skilled labor force, conducted in small scale plants, and generally located close to the source of the technology.
Organizations are usually smaller in size, informal, and entrepreneurial. Competitors are few but growing in number and size as the market grows. Entry barriers into industry are low and the number of firms rapidly increases as the market signals prospects of growth and profit.
Product innovation
Process innovation
Fluid phase Transitional Specific phase
phase
Figure 1 The dynamics of innovation1
Utterback, J.M., "Mastering the dynamics of innovation", HBS, p. 91, 1994
13
Product From high variety, to dominant design, to incremental innovation on standardized products
Process Manufacturing progresses from heavy reliance on skilled labor and general purpose equipment to specialized equipment tended by low-skilled labor
Organization From entrepreneurial organic firm to hierarchical mechanistic firm with defined tasks and procedures and few rewards for radical innovation
Market From fragmented and unstable with diverse products and rapid feedback to commodity-like with largely
undifferentiated products
Competition From many small firms with unique products to an oligopoly of firms with similar products
Transitional Phase
As the market grows, acceptance of a dominant design by the market will take place. As market characteristics and user needs are better understood, products and innovation start to converge into certain areas, which become more certain.
Concept of dominant design
The term dominant design was first coined by the work of Utterback and Abernathy, to signify the emergence of a dominant technology in an industry.
A dominant design in a product class is the one that wins the allegiance of the marketplace, the
one that competitors and innovators must adhere to if they hope to gain significant market share [Utterback 1994]. Usually, the dominant design takes the form of a new product by the fusion of individually technological innovations introduced interdependently during the fluid form of an industry.
During the recent history of computing, the emergence and dominance of the IBM PC is a predominant example of dominant design among all other alternative PC designs manufactured
by competitors such as Apple, Tandy, etc. This landmark event in PC industry happened in 1981 by the introduction of IBM PC with a list price of $3000. Although this product did not offer any
technological breakthroughs, it was equipped with innovative components, such as Intel 8088 microprocessor, floppy disk, CRT monitor, standard QWERTY keyboard, and fused by open architecture and standards. By betting on an open architecture strategy, IBM leveraged many suppliers such as Intel and Microsoft, which helped the development of the IBM PC in less than
18 months. It also became the center of gravity for many hardware and software manufacturers
in the industry who wanted to be "IBM compatible" and command a market share in the industry.
In this phase the product and process innovations are more tightly linked. Designs require more consideration from manufacturing technologies and the cost efficiency of production. Expensive equipment brought into manufacturing and islands of automation began to appear the in shop floor. The growing rigidity in manufacturing and operations mean that design changes slows down and
Specific Phase
In specific phase, the objective of the firms remaining in the industry is to produce specific products at a very high level of efficiency. At this time, basis of competition turns from innovative products and new features to the value ratio of quality to cost. The link between product and process are very close. Manufacturing equipment used is highly specialized, automated, expensive, and geared towards highly efficient, low unit cost production of highly specified products. Therefore the cost of changing designs and implementing radical innovations in products are extremely high and disruptive to manufacturing systems of the organizations.
Organizationally, firms are more structured, managed by rigid rules and goals. Inventors are replaced by managers who monitor and control the smooth working of production systems. Competitors are few, with stable market shares. Entry barriers into industry are high, caused by saturated markets and high capital and technology investments of the existing firms.
Dominant design and industry landscape
James Utterback studied the business of printing covering four major innovation cycles in the industry. Mechanical typewriters, electrical typewriters, word processors, and personal computers have one fundamental objective: to put words on paper neatly and efficiently. The reader should refer to Prof. Utterback's Mastering the Dynamics of Innovation for the breathtaking story of this industry and its evolution over a period of more than a century. Figure 2 presents the ecology of business succession by graphing the total number of firms in this industry. It must be noted that each time technology shifted,
new dominant firms emerged and their predecessors usually exited the industry if they failed to adopt the new technology and standards. During 1900 Underwood, Remington, Royal, and L.C. Smith &
Brothers were supposed to dominate the American market. During the electric typewriter era, IBM controlled 60 percent of the market. During early 1970s, dedicated word processors began to appear
and replace typewriters. New companies emerged such as Wang, Olivetti, Xerox and led the market along with IBM. In the age of PCs, Apple, Tandy, Commodore emerged as the innovators, until IBM entered the market and changed the industry structure from vertical to horizontal by its open-architecture and aggressive outsourcing strategy. During this structural shift in the PC industry, new players such as Compaq and Dell emerged where the old leaders Tandy and Commodore struggled and finally exited the industry.
E
L.
E
1875
1900
1925
1950
1975
2000
2005
Figure 2 Ecology of business succession2
If chapters in the printing industry are examined in more detail, the common pattern of number of firms and its relation with dominant design would become clearer. Figure 3 depicts the number of entries, exits, and total number of firms in U.S. market of typewriter industry over a course of six decades. Initially the growth was rather slow and the peak level in the industry took almost three decades. In early 19th century there were over 30 firms in U.S. market and until that time typewriter manufacturers
offered products with few standardized characteristics. Underwood introduced its Model 5 in 1899. This was the first typewriter allowing the typist to see what he or she actually typed as the keys struck the
page. It was also the first to have a tabulator which makes columnar presentations much simpler, and it
was able to cut stencils and make good copies. These features helped the Model 5 to grasp the dominant share of the market quickly, and it formed users expectations of what an ideal typewriter should look like.
2Utterback, J.M., Disruptive Technologies lecture notes, Sloan school of management, MIT, 2006
N C 3C r S5C c r IC s ZL 1C n -- ENTFV --- EXT - TOTAL r "
PI- Q C C 0' '4 '. 00 - P0 C' C 4'I adI) 4
V•qso (fron 1874 to 1936)
Figure 3 Number of firms in the U.S. typewriter industry
After Underwood's Model 5 became the dominant design, the irreversible decline in the industry started
in 1907. By 1940, only five manufacturers had a share in the market; Remington, Royal, Smith and
Underwood, each having 20% market share and IBM with 10% share. After its peak time, more than 90% of the firms entered the industry either bankrupted or exited the industry [Utterback 1994].
Many scholars studied a variety of industries; automobiles, televisions, transistors, integrated circuits, etc. The pattern presented in figure 3, can be similarly recognized in all of these industries, although not always as close to a bell shape curve as in typewriter industry.
Patterns in the emergence of disruptive innovations
S-curveThe recurring phenomenon in every industry is the dynamics between an established product and an invading product having a radical technological innovation. This generalized pattern, also known as an
S-3Utterback, J.M., "Mastering the dynamics of innovation", HBS, p.33, 1994
curve model, can be seen in many product markets as periods of continuity, when the rate of innovation
is incremental and infrequent, and periods of discontinuity when product or process changes occur. Radical innovation creates new businesses and destroys existing ones, just as ice maker machines destroyed the New England ice-harvesting industry, personal computers killed mini computers, and digital cameras conquered almost all of the photography market analog cameras once had [Utterback 1994].
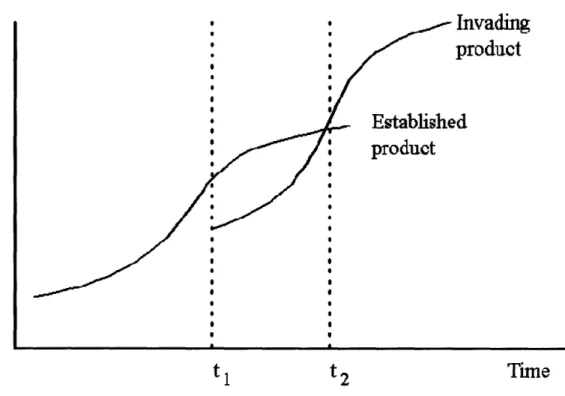
An invading technology has the potential for delivering radically better product performance or lower production costs, or both. In the fluid phase of an industry, the performance of a particular product improves rapidly as many different design approaches are tried. After a dominant design emerges and major advances have been made, a period of incremental innovation and infrequent change sets in. At this stage, when invading technology appears, the established technology offers~better performance or cost than its challenger. However if invading technology has real merit, it typically enters a period of rapid development, as mature technology enters a stage of slow improvements with descending speed (Figure 4).
Invading
product
Time
Figure 4 Performance dynamics of an established and an invading product4
Utterback, J.M., "Mastering the dynamics of innovation", HBS,p.159, 1994 18
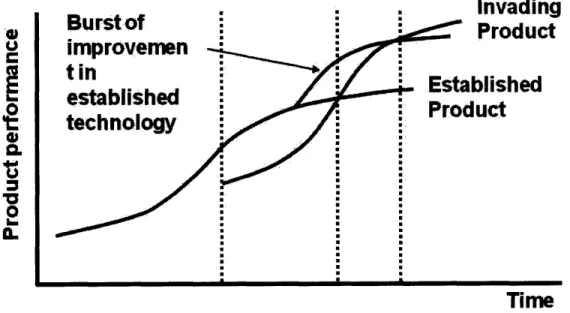
In such scenarios, the established players do not always sit back and relax. Most of them fight back. The burst of improvement from the established player in figure 5, symbolizes this behavior. The established player briefly enjoys this burst of improvement, however eventually performance of invading products surpass the established product, which has the improvement becoming marginal over time.
Invmdinn
Product
ablished
duct
Time
Figure 5 Burst of improvement in challenged products
Manager's dilemma: to listen or not to listen to the customer?
Among many patterns identified by scholars in technology industries, Clayton Christensen's framework on Disruptive Technologies is one of the most stunning. Christensen investigates why many successful companies in their industries fail suddenly, and defeated by a small and entrepreneurial, new entrant to the industry, which they ignored.
Many established and well managed companies try to solve rationale questions in order to stay competitive and increase their market performance. When they are working on a new technology product, they ask whether their mainstream customers will want it? Is the market big enough that, their investments for the technology are justifiable? In answering all these questions, they unknowingly find
5 Utterback, J.M., "Mastering the dynamics of innovation", HBS, p.160, 1994
19 U,
o
9
CL
0 b, I 'U ,themselves in the heart of a management paradox. For many established companies staying close only listening to mainstream customers and being ignorant to emerging markets were lethal.
Research proves that most well managed companies consistently deliver new technologies and products, as long as those technologies address the next generation performance needs of their mainstream customers. However, these very same companies rarely show interest in technology appealing to only a small or emerging market, having no affiliation with their mainstream customers. Christensen identified this pattern repeatedly in many industries that confronted technological change. In each instance, the companies listened to their prime customers, delivered them the products they needed, and in the end disrupted by those technologies their customers led them to ignore.
The history of the hard disk drive industry reflects this disruptive pattern multiple times. The managers of established hard disk companies stumbled at each instance of technology change, when the diameter of disk drives shrank from 14 inches to 8 inches to 5.25 inches then to 3.5 inches and finally to 1.8
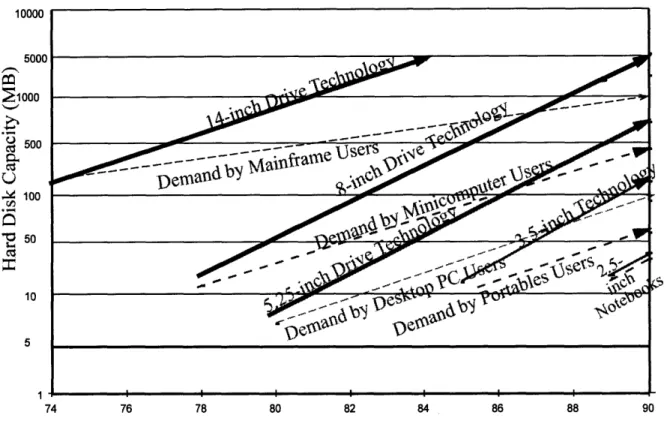
inches. Each new architecture, which essentially had dimensional and weight merit, initially offered the market substantially less storage capacity than its predecessor. As an example, the first 8 inch drives offered 20 MB when it was first introduced, while 14 inch drives were offering about 200 MB at the time. The leading mainframe manufacturers rejected 8 inch architecture at first. As a result hard disk manufacturers shelved their projects for developing 8 inch architectures and focused all their best resources to improve the capacity of 14 inch drives. The pattern was repeated with 5.25, 3.5, and 1.8 inch disk drives; established computer manufacturers rejected the new drives as their capacity was inadequate for their customers and so did disk-drive suppliers.
10000 5000 C1000 500 100 '0 50 10 5 1 74 76 78 80 82 84 86 88 90
Figure 6 Capacity demanded vs. capacity supplied in Hard Disks6
To explain the reasons behind these events, the concept of performance trajectories, the rate which the performance of a product has improved, and is expected to improve, can be used. It is possible to identify a critical performance metric in almost every industry. In digital photography, it is the resolution of pictures (measured in Mega Pixels), in microprocessor industry it is speed of execution of
mathematical operations (nowadays measured in Giga Hertz range), or in the hard disk industry it is the storage capacity (which reached Giga Byte levels early 90s). Figure 6 portrays the performance trajectories of each disk drive architecture, from 14 inch to 2.5 inch over approximately two decades. Two observations can be made from this figure. First, sustaining technologies tend to maintain a rate of
improvement and give customers better performance in the attributes they already have. For instance, thin-film components in drives, which replaced conventional ferrite heads and oxide disks between 1982 and 1990, enabled capacity increase. Second, disruptive technologies introduce a very different package of attributes from the one mainstream customers have and they usually perform a lot worse in the attributes that mainstream customer value. When the first 8 inch drive was introduced its capacity was
6 Bower, J.L, Christensen, C.M., "Disruptive Technologies: Catching the Wave", Harvard Business Review, Jan-Feb,
less than the average capacity of 14 inch disks by 1/50. However in physical dimensions and weight, it was considerably smaller than 14 inch. Unfortunately, these were attributes mainframe users did not value much, and nor did manufacturers. Indeed, while offering less capacity, the disruptive architectures created other new attributes as well as smaller sizes; internal power suppliers(8 inch drives), low cost stepper motors(5.25 inch drives), ruggedness, light weight, and low power consumption (3.5 inch drives). The disruptive architectures in disk drives made possible the emergence of new markets which created minicomputers, desk top PCs, and portable computers, respectively [Christensen 2002].
How to identify a disruptive technology?
The pattern of disruptive technologies can be generalized as in figure 7. Proven in many cases, it is noticeable that once the disruptive technology became established in their new markets, sustaining innovations raises its performance so steep that, it soon reaches the performance trajectory the market needs. At this point, the defended technology might have a performance well above what the marketplace can absorb. This state actually makes the defended technology vulnerable in marketplace [Bower and Christensen 1995].
Further, Christensen suggests a method to spot and cultivate disruptive technologies. The first step in identifying a disruptive technology is to examine internal disagreements over the development of new products and technologies. Usually financial and marketing managers rarely support a disruptive technology because they will have a very tiny managerial or financial incentive. On the other hand, technical groups often persist in the disruptive technology and the market it will create. The next step is to ask the right questions to the right people. Managers generally ask questions and assess a new
technology for their mainstream customers and hoping to get good feedback. Generally these customers will be pushing the product performance higher to stay ahead of the game and they will be accurate when they are assessing the potential of a sustaining technology. However they will be the
(L
I--marketplace
Time
Figure 7 Pattern of the disruptive technology7
Once managers have determined a technology is disruptive, the next step is to locate the initial markets for that technology. Usually traditional market research techniques fail, as there may not even be a concrete market, for the disruptive technology. Under this condition, managers should create information about emerging markets, such as, who could be potential customers, and what are the segments, use context, valuable features, and price points. The best way to create this type of information is to experiment with rapid new releases of a product line. It is easier for small and entrepreneurial companies to experiment like this, but for established companies which are strict with processes and managerial hierarchy, it is very difficult. Often, the best choice for them is to keep an eye on small and agile companies and acquire the technology when it becomes sufficiently proven and the market shows sign of expansion. If an established company decides to develop a disruptive technology organically, creating a separate organization is necessary; with the conditions that disruptive technology has a lower profit margin than the mainstream business, and should serve the unique needs of a new set of customers.
A manager can spot and either incubate or acquire a disruptive technology, by utilizing the techniques briefly described above, but one should differentiate between recognizing the pattern and breaking the pattern, they are very different. Generally, disruptive technologies are financially very unattractive to established companies. The potential revenues from the emerging markets are very small, or even
nonexistent. Hence, managers typically find themselves in a dilemma when making a decision. One
7Utterback, J.M., Disruptive Technologies lecture notes, Sloan school of management, MIT, 2006
option is going down market with the disruptive technology, accepting the smaller markets and lower profit margins. The other is to go up market with sustaining technologies and enter market segments, which has attractive and large market sizes and lucrative profit margins. In most well managed companies, latter choice is the rational path to take in order to reduce risk and advance careers.
Technology adoption, lead user innovation and communities
Diffusion of Innovations
Before moving into lead user innovation, it is necessary to briefly examine the technology adoption lifecycle model first proposed by Everett Rogers, in his famous book Diffusion of Innovations.
Early Majority
34%
Late Majority
34%
Figure 8 Rogers' technology adoption lifecycle models
The technology adoption lifecycle depicted in figure 8, models adoption of a new innovation or product, according to the demographic and psychological characteristics of defined adopter groups. The process of adoption is illustrated with a bell curve, segmenting adopters in five categories: starting with
innovators, early adopters, early majority, late majority and finally laggards. Rogers' model characterizes these five segments as follows [Rogers 1995]:
1. Innovators - They are venturesome, and educated. These people are eager to take risks for big
returns.
8 Roger, E., "Diffusion of Innovations", Free Press, 1995
2.5%
2. Early adopters- They are social leaders, popular, and educated. They like to try new ideas but are not techies like innovators.
3. Early majority - They are deliberate and thoughtful people, accepting change more quickly than
average. They usually have many informal social contacts.
4. Late majority - They are skeptical, traditional, and a lower socio-economic status. They will use new ideas or products only if the early majority is using it.
5. Laggards -They are traditional, and conservative. They will accept new ideas only when it
becomes mainstream or traditional. Neighbors and friends are their main info sources and they are very risk averse.
Further, Geoffrey Moore builds on Rogers' model in his famous 1999 book, "Crossing the Chasm". He argues there is a chasm between the early adopters of the product (the technology enthusiasts and visionaries) and the early majority (the pragmatists). Moore believes visionaries and pragmatists have very different expectations. He attempts to explore those differences and suggest techniques to successfully cross the "chasm," including choosing a target market, understanding the whole product concept, positioning the product, building a marketing strategy, and choosing the most appropriate distribution channel and pricing [Moore 1999].
Lead user innovation
Almost all models about technological innovation and evolution have a common fundamental assumption that innovation is developed by manufacturers and delivered to users in order to perform one or more functions. On the contrary, the lead user theory assumes that innovation not necessarily always happens by a manufacturer in a manufacturing setting. Instead, the theory suggests most commercially attractive products and product modifications are developed by users with lead user characteristics. Eric Von Hippel, world renowned scholar on lead user innovation, claims lead users have two distinguishing characteristics: 1) They are at the leading edge of an important market trend, and experiencing needs that will be experienced by many users in that market, 2) They anticipate high benefits from obtaining a solution to their needs, so they innovate [von Hippel 2005]. As depicted in figure 9, lead users are actually the innovators constituting the first segment of Rogers' innovation adaption curve. However a significant change in the view is that the first segment of lead users innovate to satisfy their own needs, not to adopt an innovation from a manufacturer.
Several scholars studied a variety of industries to find empirical proof, that innovation is done by users and often commercial products are derived from this innovation. Franke and Shah studied user
innovation in sports. They studied four communities of sports, canyoning( a popular sports in the Alps), gliding, boardercross (six snowboarders competing in a downhill race), and handicapped cyclists that need improvements in their equipment to accommodate their disabilities. Their research revealed that users' innovations varied a great deal. In the sailplane community, users developed innovations such as a rocket-assisted emergency ejection system. Snowboarders improved their boots and bindings. Canyoners' invented ways to cut loose a trapped rope by using a chemical etchant. They also found that
23% of the innovations were soon produced for sale by a manufacturer [Franke and Shah 2003].
Only. lead user
prototypes
available
I AJ
-numb
useen
need
Conmmrercial viersions ot product
tavailable
Figure 9 Lead user innovation9
The advent of the World Wide-Web and the consequent proliferation of open-source software projects around the world has became a focal point for many researchers from academia on the phenomenon of user innovation communities. A predominant example is the Apache open-source web server. The server software was first developed by Rob McCool, while he was working at the National Center for Supercomputing Applications (NCSA). As he posted his source on the web, a small group of webmasters decided to continue using and developing it. After extensive feedback from many users and modifications, Apache 1.0 was released on Dec. 1, 1995. Four years later, with improvements by many
users, Apache became most popular Web server on the internet despite strong competition from Microsoft and Netscape [Von Hippel 2001].
Von Hippel, E., "Democratizing innovation", MIT press, p.134, 2005
Product architecture and platforms
Defining architectural innovation
The types of innovation discussed so far can be grouped into two categories. Radical innovation establishes a new dominant design with a new set of design concepts and creates a new set of core design concepts. Incremental innovation refines and improves the performance of an established product. In incremental innovation improvement often only occurs in individual components, but the underlying design concepts and links between them stays the same. Architectural innovation, a third type occurs when a product's architecture changes but the components and the core design concepts are left unchanged.
The framework of Abernathy and Clark classifying innovation types is given in figure 10. This framework consists of four quadrants representing innovations: Architectural, Niche, Incremental, and Revolutionary. In addition to the three types mentioned, the niche quadrant represents innovation called by Utterback as "sales maximization", in which a stable and specified product is refined and improved so that it will support a new marketing thrust. In figure 10, the market transilience scale is in the vertical dimension, and technology transilience scale in the horizontal. (The term "transilience of innovation" was coined by Abernathy and Clark to indicate the significance of innovation to influence a firm's existing resources, skills, and knowledge) [Abernathy and Clark 1985].
Niche Creation
$ (Maximize sales with thrust for
(U .! new markets) Incremental m•E Incremental (Conserve/entrench existing competence) Techn Architectural (Disrupt existing/create new linkages) Revolutionary (Disrupt/obsolete existing competence) Lloyv transilience
Figure 10 Abernathy and Clark' s framework for innovation types10
10 Adopted from, Abernathy, W.J., Clark, K.B., "Innovation: mapping the winds of creative destruction", Research Policy, 14, 3-22, 1985 27
Revolutionary innovation is at the heart of Schumpeter's theory of innovation and economic development in which "creative destruction" is the vehicle for growth. These types of innovation, which creates new industries and is often propelled by scientific research, have been extensively reviewed in literature. However, as products become more and more complex with blurred boundaries between software, hardware and services, architectural innovation gains in importance. That is what we shall review here and discuss how it is used as a competitive weapon for superior transilience in markets by established companies.
The essence of architectural innovation is the reconfiguration of an established system to link together existing components in a new way. This does not mean that component technology never changes. Architectural innovation is often triggered by a change in a component, creating new linkages and interactions with other components in the established product. Here is an illustrative example given by Henderson and Clark from the HVAC (Heating Ventilating Air Conditioning) industry: If a room's ceiling air fan is an established technology, improvements in its blade design, or the motor would be incremental innovations. A central air conditioning unit would be a radical innovation, with a completely different set of technology and design. However introduction of a portable fan for the large ceiling fan manufacturers would be an architectural innovation. While the components of the products will be pretty much the same, the architecture of the product would be different [Henderson and Clark 1990].
Product architecture and industry cycles
Every product has architecture. Product architecture is classified in two categories: Integral or modular. In his book Clockspeed, Charles Fine explains product architecture types and their relationship with industry dynamics using the recent history of the computer industry.
In the 1970s and early 1980s the computer industry structure was vertical. The three largest companies, IBM, Digital Equipment Corporation and Hewlett-Packard were highly integrated as well as other small players referred to as "BUNCH". In this early stage of the computer industry, products and systems exhibited integral architectures. Almost all of the components of a computer, microprocessors, operating, systems, and peripherals etc. were manufactured in house by the firms in the market. There were no industry standards or interfaces available; hence there was little or no interchangeability across different companies' systems.
Computer Industry Structure, 1975-85
IBM
"3
Cna
C)Coo_
DEC
r-O 0•C1 rC (I)
BUNCH
0
CL~
O t-C)c/)
Figure 11 Vertical Industry Structure and Integral Product Architecture in the Computer Industry"
During these years, IBM gained significant market power by keeping its integral product architecture close, and holding their existing customers hostage. In the late 1970s, IBM faced fierce competition from Apple with a smaller product called a Personal Computer. In response IBM launched a new business division and a new personal computer of its own.
However for its new PC, IBM chose different product architecture, -modular architecture-, outsourcing almost all major components, such as the microprocessor to Intel and, operating system to Microsoft. The dominant design became an IBM-compatible computer. Many companies entered the industry as subsystem supplies; semiconductors, application software, peripherals, networks, and PC design and assembly. IBM strategy created a shift from a vertical/integral (Figure 11) industry structure to a horizontal/modular one (Figure 12). Within this horizontal structure new companies emerged and competition became very fierce in each supply segment [Fine and Whitney 1996].
11Fine, C. H., "ClockSpeed: Winning Industry Control in the age of Temporary Advantage", Perseus Books, p.44, 1998
Computer Industry Structure, 1985-95
Intel
IMoto I AMD etcMicrosoft
IMac Unix
HP Epson Seagate etc et
Microsoft
Lotus
I
Novell
I
etc
AOL/Netscape
IMicrosoft IEDS ýetc
HPI
Compaql IBM
I
Dell
ltc
Figure 12 Horizontal Industry Structure and Modular Product Architecture in the Computer Industry12
The fierce competition fueled healthy growth in the industry. The IBM-compatible PCs subsystems drastically improved performance curves and delivered product systems which were far more superior to Apple's Macintosh computer. Quite surprisingly, IBM lost about $1 billion in market value after its strategic move, since it was squeezed by assembler like; Compaq, Gateway, Hewlett-Packard, Dell, and many other domestic and international PC assemblers. With a vast amount of supplier options, continuous price-decrease in almost every supplier segment, and an industry wide accepted standard; IBM-compatible entry barriers into PC design and assembly business was almost non-existent.
Fine's Double-Helix model generalizes the behavior of this industry shift from vertical/integral to modular/horizontal. He suggests that the cycle is reciprocal. Horizontal structures are as unstable as vertical structures. Horizontal structures tend to create fierce, commodity competition across layers. When a player in a segment gains power and an edge in costs, quality, and technology, for example, it will drive out weaker competitors. Once a firm finds market power in its row, it will seek opportunities to extend vertically as well. Both Microsoft and Intel, the most powerful players of their respective segments, exhibited this behavior. Microsoft, dominating Operating Systems, entered into application software, network software, multimedia content, and peripheral hardware segments. Intel expanded from microprocessors to the design and assembly of motherboards and, graphics processors. Figure 13
Fine, C. H., "ClockSpeed: Winning Industry Control in the age of Temporary Advantage", Perseus Books, p.46, 1998
30 Microprocessors Operating Systems Peripherals Applications Software Network Services Assembled Hardware
illustrates the dynamic cycle modeled as a double helix. When the industry structure is vertical and product architecture is integral, the forces pushing towards a horizontal industry structure and modular product architecture include [Fine 1998]:
1. The entry of niche competitors to pick off discrete industry segments.
2. The challenge of keeping ahead of the competition across many dimensions of technology and products.
3. The organizational rigidities that often constraint established companies for innovation in
particular technologies.
Figure 13 The Double Helix Model13
On the other hand, when an industry has a horizontal structure, another set of forces push towards more vertical integration in industry and integral architecture in products. These forces include:
1. Technical advances in one subsystem make the commodity scarce in the chain and the powerful and greedy owner will seek entry into adjacent segments to pick up market share.
2. Market power in one subsystem encourages bundling with other subsystems to increase control and add more value.
13 Fine, C. H., "ClockSpeed: Winning Industry
Control in the age of Temporary Advantage", Perseus Books, p. 49, 1998
3. Market power in one subsystem encourages engineering integration with other subsystems to
develop profitable integral solutions, delivering higher performance in specific attributes.
Product platforms
While architectural innovation is a challenge to companies with rigid organizational structures, many companies were able to use strategies based on product architecture to create business value, conquer new markets, and reach new levels at cost-effectiveness.
A product platform is a set of subsystems and interfaces forming a common structure from which a
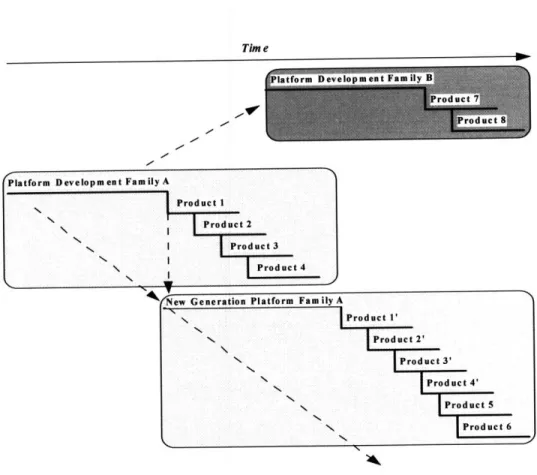
stream of derivative products can be efficiently developed and produced. A single product's architecture is considered a product platform architecture when it is designed and used as a foundation for the architecture of several other derivative products. When many products share the same product architecture, they are called a product family [Meyer and Utterback 1993]. A general framework for effective use of product families as proposed by Meyer and Utterback is presented in figure 14. This figure represents a single product family (Product family A) starting with initial development of a product platform. Using this platform successive families are followed by major advancements to the core product and process technology of that platform, with derivative products in each generation. Platform family B represents a new generation of products intended to extend the core capabilities of the company to a new market using the very same platform.
Tim e
-'Vp,
Platform Development Family A
Product 1
\ Product2
I | Product 3
\Product I 4
Figure 14 The product family approach to new product development"
A product family typically addresses a market segment, while particular products address market niches within that segment. The commonality of technologies and architecture used across multiple product families leads to efficiency and effectiveness in design, manufacturing, distribution, and service, as the firm tailors its core competencies to the specific needs of customer clusters. Black & Decker was one of the pioneers of platform strategy in the U.S. in the early 1970s. The company had dozens of products, jig saws, drills, and sanders using thirty different motors, sixty different motor housings, and dozens of different operation controls. Black & Decker, in order to remain competitive decreased its costs one third by adopting common product platforms across in entire product families. With a budget of $20
million allocated to this effort, engineers designed standard motor housings, controls, and adhesive-bonded armature which can be used in multiple families. Product costs dramatically reduced by 50 percent, and shares soared from 20 percent to dominant pie in most of the product markets that Black and Decker competes in [Meyer and Lehnerd 1997].
14 Meyer M., H., Utterback, J.M., "The product family and the dynamics of core capability", Sloan Management Review, p.32, Spring 1993
33
'New Generation Platform Family A
Product 1' Product 2' Product 3' Product 4' Product 5 Product 6 A ~---~---
-Further, Meyer and Lehnerd identified four different strategies for using Product Platforms. These strategies are depicted in figure 15 on market segmentation grids. In a market segmentation grid, horizontal segments denote cost/performance tiers, "low cost, mid range, high cost", or "low performance, mid range, high performance". Vertical segments denote different business segments that where the company is active.
Niche-specific Platforms (Ford pre'96)
Pit. 1 Plt. 2
Plt. 3 Pit 4 Pit. 5
Seg. A Seg. B Seg. C
Horizontal Leverage (Cross, B&D, HP, Gillette)
HCIHP MR LC/LP
I itial Platfor
Initial Pla form
Seg. A Seg.B Seg.
C---Seg. A C---Seg. B C---Seg. C
Vertical Scaling (Civic-Accord) Beachhead Strategy (Compaq, EMC)
Seg. A Seg. B Seg. C
HC/HP MR LC/LP
4,
*---
---Seg. A Seg. B Seg. C
Figure 15 Platform Strategies's
Many other well know established companies used platform strategy. For Sony, there has been no greater success than the Walkman. Sony dominated the market, worth $1 billion worldwide, for over a decade and stayed market leader despite fierce competition from world class consumer electronics manufacturers. According to Sanderson and Uzumeri's research, Sony's Walkman strategy was an example of outstanding product family management. Sony followed a disciplined and creative approach to focus its sub-families on clear design goals and target models to distinct market segments.
15Utterback, J.M., Disruptive Technologies lecture notes, Sloan school of management, MIT, 2006
34 HC/HP MR LCILP HC/HP MR LC/LP
NY Discount Price ($) no 'I110 WDD "upefrrmawt GENERATIONAL COMPONENT TECHNOLOGES
twl¶ o2r l1o4 1M IN$8 1*
YEAR
Figure 16 Generational walkman innovations at Sony16
Sony offered 20 new models each year and during the 1980s almost 250 models into the US market. From 1980 to 1988, the average market life of a Sony model was 1.97 years. This is twice as long as its competitors. Figure 16 depicts major platforms and two major component technologies developed in Walkman by Sony. Superflat motors enabled dramatic size and weight reduction in Walkman, further augmented by chewing gum batteries, taking advantage of low power consumption of the superflat motors and redesigned electro-mechanics. With platforms as a basis, most of these models were achieved by making small changes in features, packaging and appearance. Sanderson and Uzumeri categorized these non-platform changes into two further categories: incremental and topological innovations. To support the level of variety generated by systematic platform approach and incremental and topological innovations, Sony invested in flexible manufacturing extensively so that it could make many Walkman models on small production runs. By combining industrial design with flexible manufacturing Sony generated designs that had dramatic market impacts and little marginal cost [Sanderson and Uzumeri 1995].
16 Sanderson S., Uzumeri, M., "Managing product families: The case of Sony walkman", Research Policy, 24, p.768, 1995
For companies like Intel and Microsoft, platform leadership is a very different ball game. These platform leaders drive industry wide innovation for evolving systems (such as PCs), which has pieces separately developed in an industry. As much as these two companies are dependent on each other for innovation and future development of their products, they are also dependent on many complementor companies in their industry. Intel considers this situation a challenge, since it cannot be certain that its own key complementors will continue to produce market-expanding innovations as fast as Intel does. Nor can it be sure its target platform, the personal computer, will evolve in compatible ways. For example the platform around the engine may limit the engine, they need to make sure the platform keeps pace on improving, so that the microprocessor can deliver its potential [Cusumano and Gawer 2002].
3. Lotka-Volterra model and dynamics of competition
Multi-mode interaction among technologies
The concept of multi-mode interaction among two or more technologies was first proposed by Pistorous and Utterback. Multi-mode framework suggests three modes of interaction among competing technologies, all are based on the reciprocal enhancement or inhibition of a technologies' growth rate. The concept was introduced by considering four uni-directional modes of interaction; an emerging technology which can have a positive or negative influence on the growth of a mature technology, and a mature technology which can have a positive or negative influence on the growth of an emerging technology.
These four uni-directional modes are combined to yield the three major modes in the multi-mode framework [Pistorious and Utterback 1997]:
* Pure competition: An emerging technology has a negative influence on the growth of a mature technology, and the mature technology has a negative influence on the growth of the emerging technology.
* Symbiosis: An emerging technology has a positive influence on the growth of a mature technology, and the mature technology has a positive influence on the growth of the emerging technology.
* Predator-prey: An emerging technology has a positive influence on the growth of a mature technology, and the mature technology has a negative influence on the growth of the emerging technology, or an emerging technology has a negative influence on the growth of a mature technology, and the mature technology has a positive influence on the growth of the emerging technology.
Table iMulti mode framework for assessing the interaction among technologies17
Multi mode framework for interaction of Effect of A on B's growth rate
technology A and B Positive Negative
Effect of B on A's Positive Symbiosis Predator(A) - Prey (B)
growth rate Negative Predator(B) - Prey (A) Pure Competition
Pistorius, C.W.I., Utterback, J.M., "Multi-mode interaction among technologies", Research Policy, 26, p.75, 1997