Phenotypic characterization of the indigenous chickens (Gallus gallus) in
the Northwest of Algeria
Article in Archiv fur Tierzucht · February 2016
DOI: 10.5194/aab-59-79-2016 CITATIONS 2 READS 373 4 authors:
Some of the authors of this publication are also working on these related projects:
Poultry biodiversity in BelgiumView project
Characterization of collagen fibrils after equine suspensory ligament injury: An ultrastructural and biochemical approachView project Lahouari Dahloum
Université Abdelhamid Ibn Badis Mostaganem
18PUBLICATIONS 3CITATIONS SEE PROFILE Nassim Moula University of Liège 83PUBLICATIONS 228CITATIONS SEE PROFILE Miloud Halbouche
Université Abdelhamid Ibn Badis Mostaganem
47PUBLICATIONS 33CITATIONS
SEE PROFILE
Sandrine Grasteau
French National Institute for Agricultural Research
139PUBLICATIONS 1,952CITATIONS
www.arch-anim-breed.net/59/79/2016/ doi:10.5194/aab-59-79-2016
© Author(s) 2016. CC Attribution 3.0 License. Archives Animal Breeding
Phenotypic characterization of the indigenous chickens
(Gallus gallus) in the northwest of Algeria
L. Dahloum1, N. Moula2, M. Halbouche1, and S. Mignon-Grasteau3 1Faculty of Nature and Life, Department of Agronomy, University of Mostaganem,
Mostaganem, 27000, Algeria
2Department of Animal Production, Faculty of Veterinary Medicine, University of Liège, Liège, Belgium 3INRA, UR83 Recherches Avicoles, 37380 Nouzilly, France
Correspondence to: L. Dahloum (hdahloum@yahoo.fr)
Published: 16 February 2016
Abstract. This study was conducted to characterize local chickens in the northwest of Algeria based on some phenotypic traits and to look at prediction of body weight from morphometric measurements (linear body). The results indicated that the predominant comb colour was dark red (77.8 %), followed by light red (22.2 %). Tarsus colour was either white (40.9 %), grey (31 %), yellow (15.39 %), dark (8.05 %), or green (4.51 %). Most chickens (81.7 %) had orange eyes, while 10.37 and 7.92 % had yellow and dark-brown eyes, respectively. The dominant earlobe colour was white (73.96 %), followed by red (16.81 %). The remaining proportion included yellow and red-mottled yellow and black earlobes. Proportions of the adaptive genes were low. Incidences of Na, F, Pti, Cr, R, and P genes were 8.82, 0.45, 1.22, 5.54, 3.35, and 4.7 %, respectively. The calculated gene frequencies ranged from 0.002 to 0.045. Variations were also found in quantitative morphological traits. Sex-associated differences (P <0.001) were observed in almost all the parameters evaluated with higher values recorded for males. Phenotypic correlations of body weight and biometric traits ranged from −0.13 to 0.88 and −0.15 to 0.97 for males and females, respectively. From the factor analysis with varimax rotation of the intercorrelated traits, three principal components which accounted for 71.6 and 73.2 % of the total variance were extracted in males and females, respectively. Orthogonal body shape characters derived from the factor analysis accounted for 84.3 and 94.2 % of the variation in body weight of males and females, respectively. Information obtained from this study could be useful in an appropriate management, breeding programmes for selection and utilization of Algerian chicken genetic resources.
1 Introduction
Village chickens make substantial contributions to household food security throughout the developing world, as they rep-resent almost 80 % of poultry production in Africa (Sonaiya, 1997). Indigenous chickens serve as an investment for house-holds in addition to their use as meat and egg sources both for consumption and for selling (Muchadeyi et al., 2007; Moula et al., 2011). These indigenous chickens are generally kept according to an extensive or scavenging system with few or no inputs for housing, feeding, and health care (Mtilleni et al., 2012). These breeds are well adapted to the local cli-matic conditions, feed, and management stresses, with better
resistance to diseases (Iqbal and Pampori, 2008). Some ma-jor genes have been found potentially useful to the tropical production environment (Fayeye, 2006). Due to the global climate change, it is expected that the Mediterranean zone will expand northwards to the French Massif Central. In the south, heat waves and droughts are predicted to become more frequent. The ability of livestock to adapt to climatic vari-ations will therefore be a factor of great importance in the Mediterranean region, which reinforces the interest for the conservation of these breeds adapted to these harsh con-ditions and for their selection for improved performances. This implies that these breeds first have to be characterized (Mbap, 1985). The first phase of characterization involves
the identification of populations based on morphological de-scriptors that can also provide useful information on the suit-ability of breeds for selection (Ajayi et al., 2012). Up to now, the body weight (BW) prediction from some morphological traits has not been reported in Algerian indigenous chickens. In Algeria, few studies have concerned the characterization and identification of local populations of chickens (Moula et al., 2009, 2012; Halbouche et al., 2009; Mahammi et al., 2014, 2016). The present study therefore sought first to char-acterize the local chickens of the northwest of Algeria based on some qualitative and quantitative traits and second to use these criteria to estimate body weight through multiple linear regression.
2 Materials and methods
2.1 Description of the study area
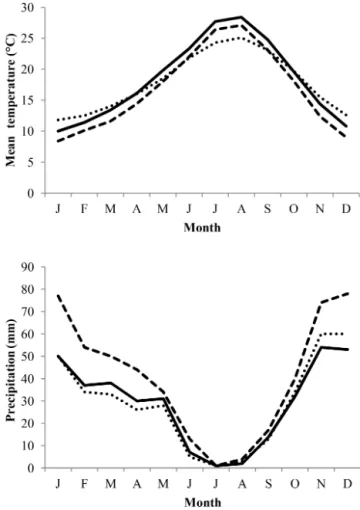
The survey area includes three provinces: Mostaganem, Re-lizane, and Mascara. It is located in the northwestern part of Algeria between the Mediterranean Sea and Saharan At-las chain. Different landscapes can be found in the area, due to influence of several topographic factors (latitude, altitude, distance from sea) on climate and, consequently, on geomor-phological and pedological processes. Mostaganem (littoral zone) is located at 35◦5505200N, 0◦0502100E, at an altitude of 85 m, has an area of 2269 km2 large, and is character-ized by a Mediterranean climate. Relizane (plains zone) is located at 35◦4400000N, 0◦3300000E, at an altitude of 139 m, has an area of 4851 km2, and is characterized by a semi-arid climate. Finally, Mascara (mountainous zone) is located at 35◦2304700N, 0◦0802400E, at an altitude of 600 m, with an area of 5135 km2, and is characterized by a semi-arid climate. The average yearly temperatures and total precip-itation amounts are 17.9◦C and 347 mm for Mostaganem, 16.7◦C and 347 mm for Mascara, and 18.3◦C and 349 mm for Relizane, but maximal temperatures are higher by 3.4 to 4.1◦C. Monthly variations in temperatures and precipitation amounts in these regions can be found in Fig. 1.
2.2 Experimental animals and their management The study has been carried out in 18 districts according to the following distribution: (1) Aïn Nouïssy, Bouguirat, For-naka, Hadjaj, Oued El Kheïr, and Sayada from Mostaganem province; (2) Beniane, Bouhnifia, El-Bordj, Ghomri, Ghriss, and Tighennif from Mascara province; and (3) Ami Moussa, Mazouna, Oued El Djemâa, Oued Rhiou, Yellel, and Zem-moura from Relizane province. Three separate villages were selected from each district. Villages in close proximity to large cities were avoided to keep at minimum the influence of urban-affiliated farming systems on a typical rural village-based chicken management system (Desta et al., 2013). A to-tal of 1552 chickens including 409 males and 1143 females over ∼ 5 months of age were randomly sampled from 180
Figure 1.Climatic data on the regions of Mostaganem (dotted line), Relizane (full line), and Mascara (dashed line) obtained from the website www.fr.climate-data.org.
households. The data were collected between April 2012 and May 2013. The chickens were reared by rural farmers ac-cording to the traditional scavenging system. During the day-time birds are often left to search for their own food and roam freely close to the homestead. Almost all the farmers in the study areas provided supplementary feed to their birds throughout the year. The chicken shelters were mostly made of bricks, wood, corrugated sheeting, and plastic. These were in poor hygienic condition and did not offer sufficient protec-tion from cold during the night.
2.3 Data collection
For qualitative traits, all the birds were individually observed for various phenotypic attributes, including feather distri-bution (naked neck, feather tarsus, and crested head) and feather structure (frizzled feather), comb type (simple, rose, and pea comb), comb colour, tarsus colour, earlobe colour, wattle colour, and eye colour as described by FAO (2012). We recorded the genotype for several major genes known for their implication in resistance to heat, such as the naked neck gene (Na / na), frizzle gene (F / f), feathered shank gene
(Pti / pti), rose comb gene (R / r), and crested-head gene (Cr / cr). Occurrence and distribution of the qualitative traits among the population was expressed as a percentage of the total number of birds. The theoretical frequency p of the dominant alleles (Na, F, Pti, R, Cr) and the theoretical fre-quency q of the recessive alleles (na, f, pti, r, and cr) were calculated using the Hardy–Weinberg equilibrium as follows:
q =r m
t and p = 1 − q, (1)
where m is the observed number of birds with recessive phe-notypes under consideration and t the total number of birds.
Nine quantitative traits were taken from 778 birds, of which 456 were females and 322 males. Body length (BL, in cm), wing span (WS, in cm), tarsus length (TL, in cm), tarsus circumference (TC, in cm), beak length (BkL, in cm), wat-tle length (WL, in cm), and comb length (CL, in cm) were measured using a tailor’s tape, while breast width (BrW, in cm) was measured using a calliper. Live body weight (LBW, in g) was taken by direct measurement using a digital 5 kg scale. All measurements and weighings were taken by the same person to avoid individual variations.
2.4 Statistical analysis
A chi-square test (χ2) was used to compare proportions for comb colour, tarsus colour, eye colour, earlobe colour, and those of dominant alleles of major genes between bird popu-lations sampled in the three provinces and between males and females. This analysis followed the procedure of Marascuilo (1966) to determine which pairs of provinces have statisti-cally differing qualitative traits proportions.
Least-squares means and standard errors (SE) were cal-culated for body weight and body linear measurements. Province and sex effect on each parameter was assessed by the following general linear model (GLM) of SAS (Statisti-cal Analysis System, 2001):
yij k = µ + Ai+Bj+(AB)ij+eij k, (2) with yij k as the studied parameters measured on the hen,
µ the mean, Ai the effect of province (i: Mascara, Mosta-ganem, and Relizane), Bj sex effect (j : male and female), (AB)ij the interaction between province and sex, and eij k the residual. Tukey’s test was used to correct for multiple comparisons for the province effect and for the interaction between sex and province. Differences were considered sig-nificant at P <0.05.
In a second step, the relationship between morphometric traits was assessed through the Pearson coefficients of corre-lation between quantitative traits.
In a third step, a principal components analysis (PCA) was done to propose linear relationship equations between mor-phometric traits that explain the largest part of variability be-tween our populations, and which are statistically indepen-dent by construction. Bartlett’s test of sphericity was used
to check whether the correlation matrix between traits was significant or not. Data were also inspected for multiple co-linearity and singularity.
In a last step, a multiple regression procedure using a step-wise variable selection was used to obtain models of predic-tion of body weight from body measurements and from es-tablished principal components factors:
BW = a + b1X1+. . . + bkXk, (3)
BW = c + d1PC1+. . . + dkPCk, (4)
where BW is the body weight, a and c are the regression in-tercepts, biand diare the ith partial regression coefficients of the ith linear body measurement or principal component, and
Xi and PCiare the ith morphometric traits or principal com-ponent. Cumulative proportion of variance criterion was em-ployed in determining the number of principal components to extract. Statistical analysis was carried out using SPSS ver-sion 22.0 (SPSS Inc., Chicago, IL, USA) and R Commander version 3.1.1.
3 Results and discussion
3.1 Frequency of major genes
Qualitative traits recorded on chickens in the study area are presented in Table 1. The predominant comb colour was dark red (77.8 %), which is consistent with results obtained by Moula et al. (2012) on indigenous chickens in Kabylie. Males had significantly darker combs than females. This finding agrees with results of Guni et al. (2013) in Tanza-nia and Liyanage et al. (2015) in Sri Lanka. As the intensity of the red colouration is an indication of the quality of sperm in the case of male birds (Navara et al., 2012), our results in-dicate that there is probably good fertility in the birds inves-tigated. Moreover, it is biologically important to study this phenotype because it is an indicator of chickens’ health and egg laying status (Hume, 2011).
Various leg colours were observed in the current study. Overall, white and grey tarsi were much more frequent than yellow and black tarsi, with green being the least frequent. A region effect was observed for this trait, due to a higher oc-currence of black (P <0.001) and green colouring (P <0.05) and a lower occurrence (P <0.001) of white colouring in Mostaganem province (12.6 %). Our study thus highlighted the large variability in tarsus colour between local popula-tions as previously studies reported more frequent white and yellow tarsi in the humid forest zone of Cameroon (Fosta et al., 2010) and in the districts of Jarso and Horro in Ethiopia (Desta et al., 2013) but more frequent black tarsi in Nige-ria (Egahi et al., 2010) and Libya (El-Safty, 2012). The occurrence of various types of tarsus colours in this study might have been due to combinations of pigment-controlling genes responsible for colour determination. We also more frequently observed green tarsus in males than in females
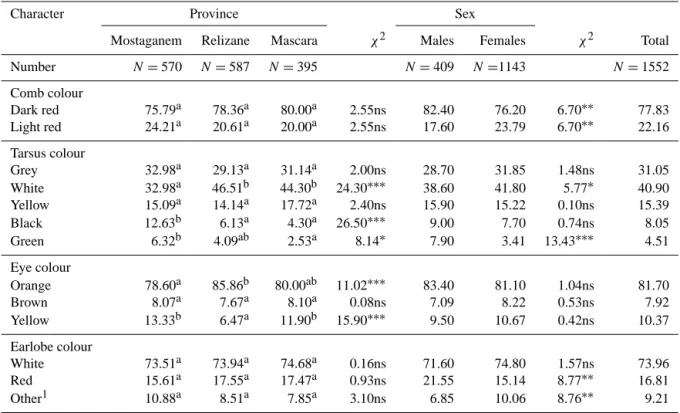
Table 1.Occurrence (%) of comb colour, tarsus colour, eye colour, and earlobe colour of 1552 local chickens from the northwest of Algeria summarized by province and by sex.
Character Province Sex
Mostaganem Relizane Mascara χ2 Males Females χ2 Total
Number N =570 N =587 N =395 N =409 N =1143 N =1552 Comb colour Dark red 75.79a 78.36a 80.00a 2.55ns 82.40 76.20 6.70∗∗ 77.83 Light red 24.21a 20.61a 20.00a 2.55ns 17.60 23.79 6.70∗∗ 22.16 Tarsus colour Grey 32.98a 29.13a 31.14a 2.00ns 28.70 31.85 1.48ns 31.05 White 32.98a 46.51b 44.30b 24.30∗∗∗ 38.60 41.80 5.77∗ 40.90 Yellow 15.09a 14.14a 17.72a 2.40ns 15.90 15.22 0.10ns 15.39 Black 12.63b 6.13a 4.30a 26.50∗∗∗ 9.00 7.70 0.74ns 8.05 Green 6.32b 4.09ab 2.53a 8.14∗ 7.90 3.41 13.43∗∗∗ 4.51 Eye colour Orange 78.60a 85.86b 80.00ab 11.02∗∗∗ 83.40 81.10 1.04ns 81.70 Brown 8.07a 7.67a 8.10a 0.08ns 7.09 8.22 0.53ns 7.92 Yellow 13.33b 6.47a 11.90b 15.90∗∗∗ 9.50 10.67 0.42ns 10.37 Earlobe colour White 73.51a 73.94a 74.68a 0.16ns 71.60 74.80 1.57ns 73.96 Red 15.61a 17.55a 17.47a 0.93ns 21.55 15.14 8.77∗∗ 16.81 Other1 10.88a 8.51a 7.85a 3.10ns 6.85 10.06 8.76∗∗ 9.21
Percentages within a row with different superscripts are significantly different:∗P <0.05;∗∗P <0.01;∗∗∗P <0.001; ns: not significant (P ≥0.05);1yellow and red-mottled yellow and black earlobes.
(P <0.001). However, white tarsus was more commonly ob-served in females than males (P <0.05). Frequencies of other colours did not show a sex effect (P >0.05). According to Desta et al. (2013), the low incidence of green-shanked chickens observed in this study is not surprising, because it is unfavourably correlated with adult viability. The variabil-ity in eye colour is much less than for tarsus as orange rep-resents 81.7 % of the total, with yellow and brown showing much lower frequencies, consistent with data in the literature (Fosta et al., 2010). Variation in eye colour to a large ex-tent depends on the pigmentation (carotenoid pigments) and blood supply to a number of structures within the eye (Craw-ford, 1990, as cited in Eskindir et al., 2013). Differences be-tween districts for this feature were observed. The proportion of orange-eyed chickens was higher in Relizane (P <0.001) than in Mostaganem, while yellow eyes were less frequent (P <0.001). Variations were also observed in earlobe colour. White earlobes were the most frequent (73.96 %) in the three regions, followed by red earlobes (16.81 %). This is consis-tent with the findings of other researchers (Roxas et al., 1996; Egahi et al., 2010; Faruque et al., 2010). White earlobe is a characteristic feature of chickens of the Mediterranean re-gion (Sørensen, 2010). The remaining proportion (9.21 %) is a mix of yellow, red-mottled, yellow, and black earlobes. A higher proportion of red earlobe chickens was observed in males (P <0.01).
The frequencies of the dominant alleles of major genes in the population were quite low, ranging between 0.45 and 8.82 % depending on the gene considered (Table 2), con-sistent with previous findings of Abdelqader et al. (2008) in Jordan, Sola-Ojo et al. (2011) and Fajemilehin (2010) in Nigeria, and Hassaballah et al. (2014) in Chad. The low fre-quency of these major genes, despite the advantage they give for heat stress adaptation, is probably attributable to social reasons, as naked neck and frizzle-feathered birds are judged ugly and thus sold at lower prices (Yakubu, 2010). Moreover, Fajemilehin (2010) reported that these birds are used in ritu-als and sacrifices as people consider these birds to be either fetishes or witches. Finally, in the case of the frizzle gene, the low frequency could also be due to the lethality of the gene in its homozygotic state (Haaren-Kiso et al., 1995, as cited in Fayeye et al., 2006).
Frequencies of the dominant alleles varied among re-gions for all genes except pea comb and crested head. The same pattern was observed for all genes, with a significantly (P <0.01) lower frequency of dominant alleles in the region of Mostaganem than in Relizane, with Mascara showing an intermediate value. This might be explained by the ecolog-ical characteristics of the areas (plains vs. mountains, urban vs. rural) as indicated by Halbouche et al. (2012) and/or sig-nificant variation in farmers’ preferences for some particular mutant traits.
Table 2.Occurrence (%) of major genes carriers in 1552 local chickens from the northwest of Algeria summarized by province and by sex.
Phenotype Province Sex
Mostaganem Relizane Mascara χ2 Males Females χ2 Total
N 570 587 395 409 1143 1552 [Na] 5.61a 11.40ab 9.60b 12.50∗∗ 10.51 8.22 1.96ns 8.82 [F] 0.00a 1.02b 0.25ab 7.90∗ 0.73 0.35 0.98ns 0.45 [Pti] 0.20a 2.00b 1.52ab 8.70∗ 1.95 0.96 2.46ns 1.22 [R] 0.70a 5.60b 3.80b 21.90∗∗ 6.11 2.36 13.08∗∗ 3.35 [P] 5.01a 3.20a 6.30a 5.30ns 0.49 6.21 22.00∗∗ 4.70 [Cr] 5.30a 4.30a 7.90a 5.90ns 1.96 6.82 13.64∗∗ 5.54 [Other1] 83.20b 72.50a 70.63a 26.30∗∗ 78.25 75.07 1.65ns 75.90
ns: Not significant (P ≥ 0.05);∗P <0.01;∗∗P <0.001;1Individuals exhibiting none of the characters studied.
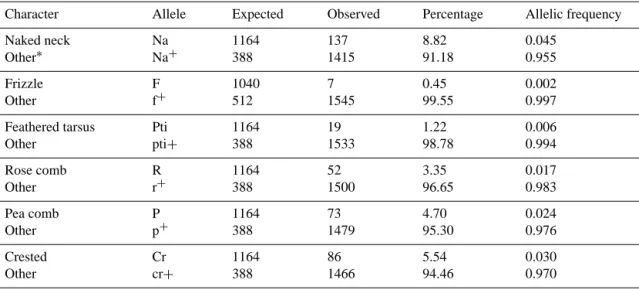
Table 3.Percentages (%) and allelic frequencies of visible genes from 1552 local chickens in the northwest of Algeria. Character Allele Expected Observed Percentage Allelic frequency Naked neck Other∗ Na Na+ 1164 388 137 1415 8.82 91.18 0.045 0.955 Frizzle Other F f+ 1040 512 7 1545 0.45 99.55 0.002 0.997 Feathered tarsus Other Pti pti+ 1164 388 19 1533 1.22 98.78 0.006 0.994 Rose comb Other R r+ 1164 388 52 1500 3.35 96.65 0.017 0.983 Pea comb Other P p+ 1164 388 73 1479 4.70 95.30 0.024 0.976 Crested Other Cr cr+ 1164 388 86 1466 5.54 94.46 0.030 0.970
∗Individuals exhibiting none of the characters studied.
A higher proportion of crest-headed birds and pea combs were observed in females than in males (P <0.001), while the rose comb chickens were observed more in males than in females (P <0.001). However, the exact number and ge-ographical distribution of these mutant phenotypes are not clearly established in Algeria, and only a very limited num-ber of works have been published (Moula et al., 2009; Ma-hammi et al., 2014).
Table 3 shows the gene frequencies of naked neck, friz-zled, ptilopody, crested, rose comb, and pea comb birds as 0.045, 0.002, 0.006 0.03, 0.017, and 0.024 respectively. The expected phenotypic ratio and gene frequencies for the feather distribution gene (F / f) were calculated with the as-sumption that the number of homozygous dominant individ-uals (FF) eqindivid-uals zero. This is because the homozygous dom-inant FF is mostly lethal (Osewa, 2003, as cited in Sola-Ojo et al., 2011). The low frequencies for these dominant genes suggest that they are at the brink of extinction. The results of
this study agree with that of Sola-Ojo et al. (2011) where the calculated gene frequencies of 0.077 was obtained for naked neck, 0.078 for frizzle, 0.076 for ptilopody, and 0.074 for crested in the Nigerian Fulani ecotype chickens. Incidence of pea and rose comb reported in this study is consistent with the results of Ikeobi et al. (2001), which showed gene frequencies of 0.02 and 0.01, respectively, in Nigerian local chickens.
This situation requires scientific concern to ensure that these adaptive genes are preserved and available for utiliza-tion in future livestock improvement programmes. Naked neck and frizzle gene frequency should be increased as they have been shown to have a favourable effect on production traits under heat stress (Mathur and Horst, 1988). Wright et al. (2009) noted that the pea comb is an adaptive trait in cold climates as it reduces heat loss and makes the chicken less susceptible to frost lesions. Shoffner et al. (1993) also observed that birds with ptilopody had better body weight
Table 4.Least-squares means (LSM ± SE) of province and sex effect for live body weight (g) and eight linear measurements (cm) of 778 local chickens from the northwest of Algeria (Mostaganem: males = 106, females = 145; Relizane: males = 102, females = 163; Mascara: males = 114, females = 148). Explanations on trait abbreviations can be found in Sect. 2.3.
Trait Sex Province1 Pvalue2
Mostaganem Relizane Mascara All Province (P) Sex (S) P × S R2
LBW M 1637.57 ± 25.20a 1814.25 ± 25.69b 1702.00 ± 24.30a 1716 ± 17.53 ∗∗∗∗ ∗∗∗∗ ns 0.23 F 1404.24 ± 21.55a 1494.45 ± 20.32b 1450.53 ± 21.33ab 1451 ± 10.41 Total 1502.78 ± 18.39b 1617.54 ± 17.90c 1559.95 ± 18.00a BL M 30.07 ± 0.15b 30.93 ± 0.16a 30.75 ± 0.14a 30.6 ± 0.08 ∗∗∗ ∗∗∗∗ ∗∗∗∗ 0.30 F 28.86 ± 0.13b 28.88 ± 0.12b 28.24 ± 0.12a 28.7 ± 0.08 Total 29.36 ± 0.12ab 29.67 ± 0.11b 29.33 ± 0.11a WS M 46.82 ± 0.37b 47.60 ± 0.38b 46.30 ± 0.35a 46.9 ± 0.11 ∗∗∗∗ ∗∗∗∗ ∗ 0.31 F 40.97 ± 0.31a 43.09 ± 0.30b 41.79 ± 0.31a 42.0 ± 0.22 Total 43.44 ± 0.28a 44.83 ± 0.28b 43.76 ± 0.28a TL M 9.49 ± 0.10b 10.15 ± 0.10a 9.90 ± 0.09a 9.85 ± 0.06 ∗ ∗∗∗∗ ∗∗∗∗ 0.24 F 8.94 ± 0.08a 8.61 ± 0.08b 8.93 ± 0.08a 8.81 ± 0.04 Total 9.18 ± 0.07 9.20 ± 0.07 9.35 ± 0.07 TC M 4.60 ± 0.05a 4.82 ± 0.05b 4.50 ± 0.05a 4.63 ± 0.02 ∗∗∗∗ ∗∗∗∗ ns 0.37 F 3.69 ± 0.05a 4.02 ± 0.04b 3.77 ± 0.04a 3.83 ± 0.03 Total 4.07 ± 0.04a 4.33 ± 0.04b 4.09 ± 0.04a BrW M 5.80 ± 0.07b 5.49 ± 0.07a 5.54 ± 0.07a 5.61 ± 0.04 ns ∗∗∗∗ ∗∗∗∗ 0.10 F 5.90 ± 0.06a 6.14 ± 0.05b 5.97 ± 0.06a 6.01 ± 0.03 Total 5.86 ± 0.05 5.89 ± 0.05 5.78 ± 0.05 BkL M 2.44 ± 0.04 2.43 ± 0.04 2.45 ± 0.03 2.44 ± 0.17 ns ∗∗ ns 0.05 F 2.39 ± 0.03 2.38 ± 0.03 2.38 ± 0.03 2.38 ± 0.02 Total 2.41 ± 0.02 2.40 ± 0.02 2.41 ± 0.02 CH M 3.56 ± 0.05b 3.61 ± 0.05b 3.77 ± 0.05a 3.65 ± 0.03 ∗∗ ∗∗∗∗ ∗∗∗ 0.74 F 1.85 ± 0.04a 1.97 ± 0.04b 1.85 ± 0.04a 1.89 ± 0.02 Total 2.57 ± 0.06 2.60 ± 0.6 2.69 ± 0.06 WL M 2.92 ± 0.05a 3.08 ± 0.05b 3.01 ± 0.05ab 3.00 ± 0.03 ns ∗∗∗∗ ∗∗ 0.50 F 1.97 ± 0.05 1.87 ± 0.04 1.86 ± 0.05 1.89 ± 0.02 Total 2.37 ± 0.05 2.34 ± 0.05 2.36 ± 0.05
1Least-squares means within an effect (province or interaction between province and sex) with different superscripts are significantly different (P <0.05).2P, S, P × S: province, sex, and interaction between province and sex fixed effects; ns: P ≥ 0.10;∗
P <0.10;∗∗
P <0.05;∗∗∗
P <0.01;∗∗∗∗
P <0.001.
and egg production. However, the rose comb gene should be counter-selected as it is associated with reduced fertility, es-pecially in homozygous roosters (Buckland et al., 1969).
3.2 Province and sex effect on quantitative traits Descriptive statistics for live weight and body measurement traits of adult chickens in the northwest of Algeria are pre-sented in Table 4. The average live weight of the sampled chickens was 1716 ± 17.53 g for males and 1451 ± 10.41 g for females, which is higher than the findings of Moula et al. (2012) (males = 1427 ± 18 g; females = 1144 ± 18 g) for Kabylie chickens from Algeria and Getu et al. (2014) (males = 1630 ± 0.03 g; females = 1370 ± 0.02 g) for chick-ens from north Gondar zone in Ethiopia. Higher live weights were reported from Fulani ecotype chickens in Nigeria
(males = 2400 ± 0.14 g; females = 1500 ± 0.14 g) (Jesuyon and Salako, 2013) and for Southern Highlands chickens of Tanzania (males = 2095 ± 29.9 g; females = 1525 ± 15.9 g) (Guni et al., 2013). According to Desta et al. (2013), live weight may vary because of inaccuracies of weighing scales, individual differences in measuring accuracy, age of the bird, and season of the year in which the chicken is weighed (during seasons of relatively better feed supply most likely chickens have higher live weight). Moreover, genetic and other environmental (stochastic) factors possibly affect the live weight of village chickens.
Results showed that live weight and all morphometric traits showed a significant sexual dimorphism in favour of males, except for breast width, which was 6.7 % larger in females. Sexual dimorphism was especially pronounced for comb height and wattle length, i.e. two traits that are highly
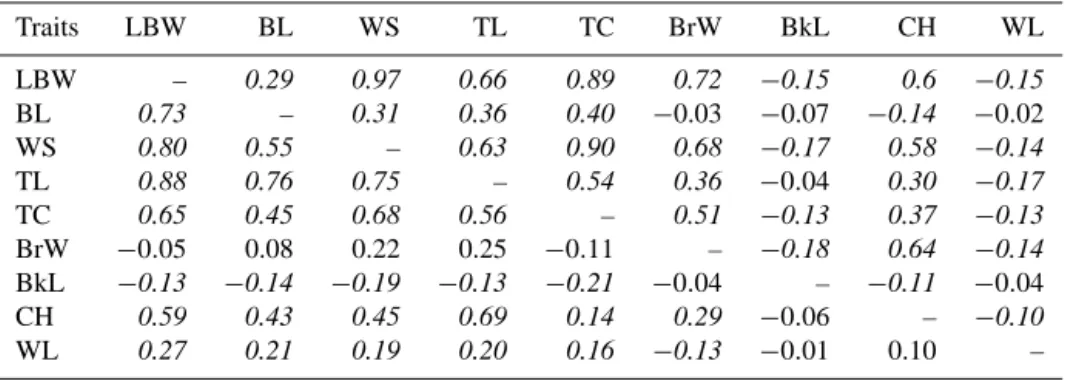
Table 5. Pearson correlations between traits recorded for males (below diagonal divide, n = 322) and females (above diagonal divide, n =456). Correlations that are significantly different from zero are written in italics.
Traits LBW BL WS TL TC BrW BkL CH WL LBW – 0.29 0.97 0.66 0.89 0.72 −0.15 0.6 −0.15 BL 0.73 – 0.31 0.36 0.40 −0.03 −0.07 −0.14 −0.02 WS 0.80 0.55 – 0.63 0.90 0.68 −0.17 0.58 −0.14 TL 0.88 0.76 0.75 – 0.54 0.36 −0.04 0.30 −0.17 TC 0.65 0.45 0.68 0.56 – 0.51 −0.13 0.37 −0.13 BrW −0.05 0.08 0.22 0.25 −0.11 – −0.18 0.64 −0.14 BkL −0.13 −0.14 −0.19 −0.13 −0.21 −0.04 – −0.11 −0.04 CH 0.59 0.43 0.45 0.69 0.14 0.29 −0.06 – −0.10 WL 0.27 0.21 0.19 0.20 0.16 −0.13 −0.01 0.10 –
involved in sexual selection (+93.1 and +58.7 % in males compared to females, respectively). The size of the combs and wattles are associated with gonad development and se-cretion of sex hormones (Nesheim et al., 1979). It was mod-erate (between 11.8 and 20.9 %) for traits related to general size of the birds and lower for body length and beak length (less than 6.6 %). The effect of province was highly signifi-cant (P <0.001) for live body weight, wing span, and tarsus circumference. As for major genes frequencies, there was a gradient between Relizane birds with higher values and Mostaganem birds with lower values, with Mascara birds showing intermediate values. According to Abdelqader et al. (2008), the wide variations in local chicken performance are ascribed in their study to many factors, mainly the vari-ations in management practices between households, the ef-fects of crossbreeding with exotic lines, and the availability of scavenging feed resources and feed supplements. In addi-tion, empirical support relating morphometric variation and regional climates in birds is provided by a number of stud-ies (Rand, 1936; James, 1970; Power, 1970, as cited in Bul-garella et al., 2007).
Finally, the interaction of between region and sex was highly significant (P <0.01) for body length, tarsus length, breast width, and comb height. For body length and tarsus length, birds of the region of Mostaganem had the lowest values among the three regions in males but the highest in females. It was also true for wattle length but with a much lower amplitude. Conversely, for breast width, males from Mostaganem regions showed the highest values and females the lowest values. Otherwise, ecotype × sex interaction ef-fects was highly significant (P <0.01) in BrW : LBW ratio (data not shown). The highest values were recorded in male and female birds of Mostaganem.
3.3 Phenotypic correlations between traits
Pairwise correlations between body weight and linear body measurements for males and females are presented in Ta-ble 5. These correlations were generally high in both sexes, except for beak length and wattle length. This has been the
trend in most studies (Semakula et al., 2011; Ajayi et al., 2012; Egena et al., 2014). The high and significant corre-lations between body measurements and body weight sug-gest that we would have a good predictability of body weight based on other measures. This is because an increase in any of the body measurement will invariably lead to a corre-sponding increase in the body weight of the chickens (Ajayi et al., 2008). A similar observation was reported by Udeh and Ogbu (2011). Correlations between traits within males and females were generally comparable, but in some cases we observed a large difference of correlations between both sexes. This was the case for correlations between breast width and either body weight, wing span, tarsus circumfer-ence, or comb height, which were higher in females than in males. Conversely, the correlations between body length and either body weight, tarsus length, or comb height were larger in males than in females. Studying morphometric traits and correlation between body weight and body size traits in Isa Brown and Ilorin ecotype chickens, Fayeye et al. (2014) observed that linear body measurements measured on male birds were more highly correlated with body weight (0.68– 0.95) than in female chickens, except for breast breadth. Se-makula et al. (2011), working with indigenous chickens of the Lake Victoria Crescent Agro-ecological Zone in Uganda, reported that all measurements were strongly correlated with body weight in males, while in females all measurements were significant except body length and femur length in 6–8-month-old chickens. These differences between males and females suggest that the traits included to predict body weight from body measurements would differ between males and females.
3.4 Principal components analysis
The principal component matrices for males and females chickens are presented in Table 6. The sampling adequacy was 0.68 for males and 0.67 for females, above the 0.50 limit value recommended by Kaiser (1974) for a reliable in-terpretation of the analysis. Communalities ranged between 0.57 and 0.91 for males and 0.55 and 0.92 for females,
in-Table 6.Eigenvalues and share of total variance along with factor loading and communalities for eight linear body measurements of male and female chickens. Bold indicates variables with a strong association (|r|>0.7) with the principal component.
Males Females
Traits PC1 PC2 PC3 Communality PC1 PC2 PC3 Communality
BL 0.80 −0.06 −0.04 0.65 −0.29 0.85 −0.08 0.82 WS 0.84 0.01 −0.25 0.77 0.71 0.65 −0.03 0.92 TL 0.94 0.13 −0.03 0.91 0.34 0.70 0.17 0.63 TC 0.64 −0.37 −0.44 0.74 0.51 0.74 −0.02 0.81 BrW 0.23 0.81 0.06 0.71 0.86 0.17 −0.03 0.77 BkL −0.12 −0.05 0.83 0.71 −0.23 −0.09 0.73 0.59 CH 0.69 0.40 0.21 0.68 0.87 0.00 0.02 0.76 WL 0.36 −0.56 0.35 0.57 −0.20 −0.11 −0.71 0.55 Eigenvalue 3.860 1.305 1.034 3.424 1.364 1.066 Percentage of variance 42.33 16.31 12.93 42.79 17.05 13.33 explained by the axis
Cumulative percentage of 42.33 58.64 71.57 42.79 59.84 73.17 variance explained by the axes
dicating that a good amount of variance has been accounted for by the component solution. Similarly high communalities have been reported by Egena et al. (2014) in Nigerian indige-nous chickens raised according to an extensive management system and in different breeds of broiler chickens (Mendes, 2011; Ajayi et al., 2012).
In this study, three principal components with eigenval-ues higher than 1 were extracted for each sex and accounted for 71.6 and 73.2 % of the total variance in males and in fe-males, respectively. In fe-males, PC1 is comprised of the gen-eral size of the birds, with high importance of tarsus length, wing span, and body length. The second and third axes were almost exclusively explained by breast width for PC2 and beak length for PC3. Consistent with the difference in the matrix of correlations between traits in males and females, the constitution of PCA axes was different in both sexes. In females, PC1 was more correlated with comb height, breast width, and wing span. PC2 was determined by body length, tarsus circumference, and tarsus length (0.70) and was the equivalent of axis 1 in males – i.e. it represented general size. As for males, the third axis had a high contribution of beak length, which also represented an opposite direction between beak and wattle length. The present findings are consistent with the literature, in which general size is generally reported as the main factor of variation and thus constitutive of the first axis of PCA in chickens, rabbits, or turkeys (Shahin and Hassan, 2000; Ajayi et al., 2011; Egena et al., 2014). The principal component analysis allowed for better understand-ing of the complex correlations among the traits and reduced the number of traits, using only the three first PCs, without loss of information.
3.5 Prediction of body weight
Body weight is an important attribute in poultry production as it forms the basis for not only assessing growth and feed efficiency but also making economic and management deci-sions. However, under some circumstances, a scale may not be available. Practical difficulties in measuring live weight at field level have led scientists to develop prediction models to estimate live weight using linear body measurements (Assan, 2013). Multiple regression models are useful for predicting body weight of the animals, but their biological interpreta-tion may be misleading because of the number of predicted variables included in the model (Mendes, 2009). At the same time, the co-linearity between predictor variables could lead to incorrect identification of the most important predictors (Sharma, 1996), and this would result in incorrect conclu-sions about relationships between dependent and predictor variables. This can be avoided by using the principal compo-nents analysis (PCA) in place of the original variables since the principal components (PCs) are orthogonal and uncorre-lated (Yakubu et al., 2009; Ogah, 2011).
As can be seen from Table 7, TL alone accounted for 78 % of the variation in body weight in males. However, the preci-sion of the regrespreci-sion could be increased up to 91.3 % when including BrW, WS, CH, and BL. The first research that re-lated BW and tarsus length in one breed of chickens had an
R2of 0.66 (Lerner, 1937, as cited in Latshaw and Bishop, 2001). In females chickens (Table 8), WS alone accounted for 97.2 % of the variation in BW and was nearly not im-proved by the addition of BrW, TL, TC, CH, and BL in the regression equation. Liyanage et al. (2015), using a re-gression analysis, showed significant relationships of body weight with every linear trait, while chest circumference and shank length were the best predictors of live weight in
vil-Table 7.Final stepwise equations for prediction of body weight for males.
Step Predictor Intercept a SE Probability R2 Original body measures
1 TL −749.2 250.4 7.41 <0.001 0.781 2 TL −191.7 271.2 10.06 <0.001 0.860 BrW −135.7 3 TL −1906.3 202.4 4.12 0.907 BrW −141.2 <0.001 WS 51.6 4 TL −1979.5 185.2 14.45 <0.001 0.910 BrW −146.1 WS 53.7 CH 47.3 5 TL −2452.1 160.4 5.73 <0.001 0.913 BrW −142.1 WS 54.7 CH 56.5 BL 20.1
Final predictive equation:
LBW = −2452.1 + 160.4 TL − 142 BrW + 54.7 WS + 56.5 CH + 20.1 BL Principal component axes
1 PC1 1716.35 −152.9 7.62 <0.001 0.812 2 PC1 1716.35 −152.9 7.13 <0.001 0.836 PC2 47.8 3 PC1 1716.35 283 6.70 <0.001 0.843 PC2 −48.8 PC3 −31.6
Final predictive equation: LBW = 1716 + 283 PC1 − 48.8 PC2 − 31.6 PC3
PC1, PC2, and PC3: first, second, and third principal component, respectively; a: regression coefficient; R2: coefficient of determination; SE: standard error of model.
lage chickens in Sri Lanka. Yakubu et al. (2009) and Ajayi et al. (2012) reported that the highest contributor to the vari-ation in body weight in normal feathered Nigerian indige-nous chickens was body length, which again highlights the importance of determining specific equations for local pop-ulations, which differ for a lot of characteristics, including genetic background and environmental factors of production. According to the results of PCA, using PC1 as a single pre-dictor already explained 81.2 and 80 % of the total variabil-ity in body weight in males and females, respectively. The accuracy of the models was further improved (R2=0.843 for males and R2=0.942 for females) when including other PC axes in the regression equation. The lower R2 values obtained with the regressions on PC axes than on original measures suggest that the co-linearity between traits leads to overestimation of the goodness of fit of the equation based on original measures. Many researchers have used the inde-pendent factor scores derived from multivariate technique of
principal component factor analysis in chicken data. Egena et al. (2014) reported that the combination of PC1 and PC2 resulted in R2=0.684 for estimation of BW in Nigerian chickens raised according to an extensive management sys-tem. Likewise, Ayayi et al. (2012) reported that the combi-nation of PC1 and PC2 explained 82, 74, 78.8, and 75.5 % of the total variability in BW in normal-feathered, frizzle-feathered, naked neck, and Anak Titan birds in the order listed. Ibe (1989) analysed the body weight of Gallus
gal-lus at different ages, together with four body linear
measure-ments: breast and thigh widths, and shank and keel lengths. In all ages the first two principal components explained at least 85 % of the total variation.
This study, however, did not have the specific objective of obtaining principal components to be used in chicken breed-ing programmes, because, in genetic terms, every ecological niche (i.e. ecological zone or environment) is governed by its own peculiar variability (Egena et al., 2014). Our
objec-Table 8.Final stepwise equations for prediction of body weight for females.
Step Predictor Intercept a SE Probability R2 Original body measures
1 WS −493 46.3 0.37 <0.001 0.972 2 WS −533.6 43.6 3.06 <0.001 0.976 BrW 25.8 3 WS −612.2 40.6 2.04 <0.001 0.980 BrW 29.2 TL 20.4 4 WS −579.6 35.8 5.43 <0.001 0.982 BrW 35.2 TL 21.8 TC 32.4 5 WS −546.9 33.6 3.92 <0.001 0.982 BrW 31.3 TL 22.8 TC 42.7 CH 18.4 6 WS −562.5 33.9 3.45 0.003 0.983 BrW 31.5 TL 22.7 TC 42.5 CH 17.0 BkL 10.3
Final predictive equation:
LBW = −562.5 + 33.9 WS + 31.5 BrW + 22.7 TL + 42.5 TC + 17.0 CH + 10.3 BkL Principal component axes
1 PC1 1451.5 161.8 7.15 <0.001 0.800
2 PC1 1451.5 161.8 2.52 <0.001 0.942
PC2 142.7
Final predictive equation: LBW = 1451.5 + 161.8 PC1 + 142 PC2
PC1 and PC2: first and second principal component, respectively; a: regression coefficient; R2: coefficient of
determination; SE: standard error of model.
tive was to show that the use of orthogonal variables gave a better and more dependable estimation of body weight since it was able to break multicollinearity, a problem commonly connected with the use of interdependent original body di-mensions (Egena et al., 2014).
4 Conclusions
This study has highlighted a great phenotypic and phanerop-tic diversity of local poultry genephanerop-tic resources found in the Algerian rural areas, reared extensively for household con-sumption and obtaining extra income. Phenotypes observed were unevenly distributed across space, reflecting the adap-tive fitness of birds to areas according to specific skills of each phenotype. Other attributes of economic interest in
trop-ical and subtroptrop-ical conditions were also observed, such as naked neck and frizzled. However, the low frequencies of major genes’ dominant alleles under study would suggest that the carrier animals are in serious danger of extinction and are currently endangered. Otherwise, the use of fac-tor and principal component scores in multiple linear re-gression analysis has been shown to be useful in prediction of body weight of indigenous chickens. This might present valuable knowledge for genetically improving body weight. Therefore, indigenous chickens deserve special attention and conservation. These results may be useful in the context of breeding programmes for the future creation of strains that are resistant to harsh climates and efficient in terms of pro-duction.
Acknowledgements. The authors wish to thank A. Chibani for revising the English version of the manuscript and all the indigenous chicken farmers in all the regions visited for accepting to be interviewed and providing their chickens for use in this study. Appreciation is also extended to O. M. A. Jesuyon, the anonymous reviewer, and the journal editor for their valuable comments. Edited by: K. Wimmers
Reviewed by: O. M. A. Jesuyon and one anonymous referee
References
Abdelqader, A., Wollny, C. B. A., and Gauly, M.: On-farm investi-gation of local chicken biodiversity and performance potentials in rural areas of Jordan, Anim. Genet. Resour. Inform., 43, 49– 58, doi:10.1017/S1014233900002728, 2008.
Ajayi, F. O., Ejiofor, O., and Ironke, M. O.: Estimation of body weight from linear body measurements in two commercial meat-type chickens, Global J. Agricult. Sci., 7, 57–59, 2008.
Ajayi, O. O., Yakubu, A., Jayeola, O. O., Imumorin, I. G., Takeet, M. I., Ozoje, M. O., Ikeobi, C. O. N., and Peters S. O.: Multivari-ate analysis of sexual size dimorphism in local turkeys (Melea-gris gallopavo) in Nigeria, Trop. Anim. Health Prod., 44, 1089– 1095, doi:10.1007/s11250-011-0044-6, 2011.
Ajayi, O. O., Adeleke, M. A., Sanni, M. T., Yakubu, A., Peters, S. O., Imumorin, I. G, Ozoje, M. O., Ikeobi, C. O., and Ade-bambo, O. A.: Application of principal component and discrimi-nant analyses to morpho-structural indices of indigenous and ex-otic chickens raised under intensive management system, Trop. Anim. Health Prod., 44, 1247–1254, doi:10.1007/s11250-011-0065-1, 2012.
Assan, N.: Bio prediction of body weight and carcass parameters from morphometric measurements in livestock and poultry, Sci. J. Review, 6, 140–150, 2013.
Buckland, R. B., Wilcox, F. H., and Shaffner, C. S.: Influence of ho-mozygosity for rose comb on fumarase, aconitase, isocitric de-hydrogenase and malic dede-hydrogenase activity in spermatozoa of the domestic fowl (Gallus domesticus), J. Reprod. Fertil., 18, 89–95, doi:10.1530/jrf.0.0180089, 1969.
Bulgarella, M., Wilson, R. E., Kopuchian, C., Valqui, T. H., and McCracken, K. G.: Elevational variation in body size of crested ducks (Lophonetta specularioides) from the central high Andes, Mendoza, and Patagonia, Ornitol. Neotrop., 18, 587–602, 2007. Crawford, R. D. (Ed.): Origin and history of poultry species, in:
Poultry breeding and genetics, Elsevier, Amsterdam, the Nether-lands, 1990.
Desta, T. T., Dessie, T., Bettridge, J., Lynch, S. E., Melese, K.,Collins, M., Christley, R. M., Wigley, P., Kaiser, P., Terfa, Z., Mwacharo J. M., and Hanotte O.: Signature of artificial se-lection and ecological landscape on morphological structures of Ethiopian village chickens, Animal Genetic Resources, 52, 17– 29, doi:10.1017/S2078633613000064, 2013.
Egahi, J. O., Dim, N. I., Momoh, O. M., and Gwaza, D. S.: Vari-ations in qualitative traits in the Nigerian local chicken, Int. J. Poult. Sci., 9, 978–979, 2010.
Egena, S. S. A., Ijaiya, A. T., and Kolawole, R.: An assessment of the relationship between body weight and body measurements of indigenous Nigeria chickens (Gallus gallus domesticus)
us-ing path coefficient analysis, Livest. Res. Rural Dev., 26, avail-able at: http://www.lrrd.org/lrrd26/3/egen26051.htm (last access: April 2015), 2014.
El-Safty, S. A.: Determination of some quantitative and qualitative traits in Libyan native fowls, Egypt. Poult. Sci., 32, 247–258, 2012.
Eskindir A., Kefelegn, K., Tadelle, D., and Banerjee, A. K.: Phe-notypic characterization of indigenous chicken population in Ethiopia, Int. J. Interdisc. Multidisc. Stud., 1, 24–32, 2013. Fajemilehin, S. O. K.: Frequencies of different phenotypes and body
parameters of mature indigenous chicken in deciduous rainforest of Nigeria, Niger. J. Anim. Prod., 38, 4–13, 2011.
FAO: Phenotypic characterization of animal genetic resources, FAO Animal Production and Health Guidelines, 11, Rome, 2012. Faruque, S., Siddiquee, N. U., Afroz, M. A., and Islam, M. S.:
Phe-notypic characterization of native chicken reared under intensive management system, J. Bangladesh. Agri. Univ., 8, 79–82, 2010. Fayeye, T. R., Ayorinde, K. L., Ojo, V., and Adesina, O. M.: Fre-quency and influence of some major genes on body weight and body size parameters of Nigerian local chickens, Livest. Res. Rural Dev., 18, available at: http://www.lrrd.org/lrrd18/3/ faye18037.htm (last access: April 2015), 2006.
Getu, A. and Birhan, M.: Chicken Production Systems, Per-formance and Associated Constraints in North Gondar Zone, Ethiopia, British J. Poultry Sci., 3, 27–35, 2014.
Guni, F. S., Katule, A. M., and Mwakilembe, P. A. A.: Charac-terization of local chickens in selected districts of the Southern Highlands of Tanzania: II. Production and Morphometric traits, Livest. Res. Rural Dev., 25, available at: http://www.lrrd.org/ lrrd25/11/guni25190.htm (last access: April 2015), 2013. Haaren-Kiso, A., Horst, P., and Zarate, A. V.: Direct and indirect
effects of the frizzle gene (F) on the productive adaptability of laying hens, Animal Res. Dev., 42, 98–114, 1995.
Halbouche, M., Dahloum, L., Mouats, A., Didi, M., Benabdel-moumene, D., and Dahmouni, Z.: Sélection d’une souche avi-cole locale thermotolérante en Algérie, Programme et résultats préliminaires, Eur. J. Sci. Res., 71, 569–580, 2012.
Hassaballah, K., Zeuh, V., and Sembene, M.: Phenotypic diversity of local chickens (Gallus domesticus) in three ecological zones of Chad, Int. J. Curr. Res. Biosci. Plant Biol., 1, 1–8, 2014. Hume, T.: Backyard chicken husbandry – Part 1: Companion
Ani-mal., 16, 43–46, doi:10.1111/j.2044-3862.2011.00042.x, 2011. Ikeobi, C. O. N., Ozoje, M. O., Adebambo, O. A., and Adenowo,
J. A.: Frequencies of Feet Feathering and Comb Type Genes in the Nigerian Local Chicken, Pertanika J. Trop. Agric. Sci., 24, 147–150, 2001.
Iqbal, S. and Pampori, Z. A.: Production potential and qualita-tive traits of indigenous chicken of Kashmir, Livest. Res. Rural Dev., 20, available at: http://www.lrrd.org/lrrd20/11/iqba20182. htm (last access: April 2015), 2008.
Jesuyon, O. M. A. and Salako, A. E.: Variability and predictability of productive and body traits of Fulani ecotype chicken, Afr. J. Agric. Res., 8, 6178–6184, doi:10.5897/AJAR12.646, 2013. Kaiser, H. F.: An index of factorial simplicity, Psychometrika, 39,
31–36, 1974.
Latshaw, J. D. and Bishop, B. L.: Estimating body weight and body composition of chickens by using non invasive measurements, Poult. Sci., 80, 868–873, 2001.
Lerner, I. M.: Shank length as a criterion of inherent size, Poult. Sci., 16, 213–215, 1937.
Liyanage, R. P., Dematawewa, C. M. B., and Silva, G. L. L. P.: Comparative study on morphological and morphometric features of village chicken in Sri Lanka, Trop. Agric. Res., 26, 261–273, 2015.
Mahammi, F. Z., Gaouar, S. B. S., Tabet-Aoul, N., Tixier-Boichard, M., and Saïdi-Mehtar, N.: Caractéristiques morpho-biométriques et systèmes d’élevage des poules locales en Algérie occidentale (Oranie), Cah. Agric., 23, 382–392, doi:10.1684/agr.2014.0722, 2014.
Mahammi, F. Z., Gaouar, S. B. S., Laloë, D., Faugeras, R., Tabet-Aoul, N., Rognon, X., Tixier-Boichard, M., and Saidi-Mehtar, N.: A molecular analysis of the patterns of genetic diversity in local chickens from western Algeria in comparison with com-mercial lines and wild jungle fowls, J. Anim. Breed. Genet, 133, 59–70, doi:10.1111/jbg.12151, 2016.
Marascuilo, L. A.: Large-sample multiple comparisons, Psychol. Bull., 65, 280–290, 1966.
Mathur, P. K. and Horst, P.: Efficiency of warm stall tests for selec-tion on tropical productivity in layers, Proceedings of the World’s Poultry Congress, Nagoya, Japan, 4–9 September 1988, 383– 385, 1988.
Mbap, S. T.: The performance of local, exotic and hybrid cattle at Ibadan and Vom in Nigeria, PhD thesis, University of Ibadan, Ibadan, 1985.
Mendes, M.: Multiple regression models based on principal com-ponent scores to predict slaughter weight of broiler, Arch. Geflügelk., 73, 139–144, 2009.
Mendes, M.: Multivariate multiple regression analysis based on principal component scores to study relationship between some pre- and post-slaughter traits of broilers, J. Agri. Sci (Tarim Bil-imleri Dergisi.), 17, 77–83, 2011.
Moula, N., Antoine-Moussiaux, N., Farnir, F., Detilleux, J., and Leroy P.: Réhabilitation socio-économique d’une poule locale en voie d’extinction: la poule Kabyle (Thayazit lekvayel), Annales de Médecine Vétérinaire, 153, 178–186, 2009.
Moula, N., Farnir, F., Salhi, A., Iguerouada, M., Leroy, P., and Antoine-Moussiaux, N.: Backyard poultry in Kabylie (Algeria): from an indigenous chicken to a local poultry breed?, Animal Ge-netic Resources, 50, 87–96, doi:10.1017/S207863361200001X, 2012.
Moula, N., Luc, D. D., Dang, P. K., Farnir, F., Ton, V. D., Binh, D. V., Leroy, P., and Antoine-Moussiaux, N.: The RI chicken breed and livehoods in North Vietnam: Characterization and prospects, J. Agr. Rural Develop. Trop. Subtrop., 112, 57–69, 2011.
Momoh, O. M. and Kershima, D. E.: Linear body measurements as predictors of body weight in Nigerian local chickens, ASSET: An International Journal (Series A), 8, 206–212, 2008.
Mtilleni, M. F. C., Maiwashe, A., Chimonyo, M., and Dzama, K.: Conservation and utilization of indigenous chicken genetic re-sources in Southern Africa, World Poultry. Sci. J., 68, 727–747, 2012.
Muchadeyi, F. C., Wollny, C. B. A., Eding, H., Weigend, S., Makuza, M., and Simianer, H.: Variation in village chicken pro-duction systems among agro-ecological zones of Zimbabwe, Trop. Anim. Health Prod., 39, 453–461, doi:10.1007/s11250-007-9050-0, 2007.
Navara, K. J., Anderson, E. M., and Edwards, M. L.: Comb size and colour relate to sperm quality: a test of the phenotype-linked fer-tility hypothesis, J. Behavioural Ecology., 23, 1036–1041, 2012. Nesheim, M. C., Austic, R. E., and Card, L. E.: Poultry production,
Lea and Febiger, 12th Edn., Philadelphia, 58–92, 1979. Ogah, D. M.: Assessing size and conformation of the body of
Nige-rian indigenous turkey, Slovak J. Anim. Sci., 44, 21–27, 2011. Osewa, G. A.: Inheritance of thermoregulatory frizzled feather and
naked Neck, B. Agric, Thesis, Department of Animal Production, University of Ilorin, Ilorin, Nigeria, 25–30, 2003
R Development Core Team.: R: A Language and Environment for Statistical, R Foundation for Statistical Computing, Vienna, Aus-tria, http://www.R-project.org, 2011.
Roxas, N. P., Villanueva, E. M., and Lambio, A. L.: Protein and isoenzyme polymorphisms in Philippine native chickens, Philipp. J. Vet. Anim. Sci., 22, 43–58, 1996.
Semakula, J., Lusembo, P., Kugonza, D. R., Mutetikka, D., Ssen-nyonjo J., and M. Mwesigwa.: Estimation of live body weight using zoometrical measurements for improved marketing of in-digenous chicken in the Lake Victoria basin of Uganda, Livest. Res. Rural Dev., 23, available at: http://www.lrrd.org/lrrd23/8/ sema23170.htm (last access: December 2015), 2011.
Shahin, K. A. and Hassan, H. S.: Sources of shared variability among body shape characters at marketing age in New Zealand White and Egyptian rabbit breeds, Ann. Zootech., 49, 435–445, doi:10.1051/animres:2000134, 2000.
Sharma, S.: Applied multivariate techniques, John Wiley & Sons, Inc, Canada, 1996.
Shoffner, R. N., Otis, J. S., and Garwood, V. A.: Association of dominant marker traits and metric traits in chickens, Poult. Sci., 72, 1405–1410, 1993.
Sola-Ojo, F. E., Toye, A. A., and Ayorinde, K. L.: Incidence and fre-quencies of adaptative genes in intensively raised Fulani ecotype chickens, Afr. J. Gen. Agric., 7, 163–168, 2011.
Sonaiya, E. B.: African network on Rural Poultry Develop-ment, Proceedings ANRPD Workshop, Addis Ababa, Ethiopia, Progress Report, 134–143, November 1989 to June 1995, 1997. Sørensen, P.: Chicken genetic resources used in smallholder
pro-duction systems and opportunities for their development, FAO Smallholder Poultry Production, Paper No. 5, Rome, 2010. SPSS: Statistical Package for Social Sciences, SPSS Inc, 444
Michi-gan Avenue, Chicago, IL60611, 2001.
Udeh, I. and Ogbu, C. I.: Principal component analysis of body mea-surements in three strains of broiler chicken, Science World Jour-nal, 6, 11–14, 2011.
Wright, D., Boije, H., Meadows, J. R., Bed’hom, B., Gourichon, D., Vieaud, A., Tixier-Boichard, M., Rubin, C. J., Imsland, F., Hallböök, F., and Andersson, L.: Copy number variation in intron 1 of SOX5 causes the Pea-comb phenotype in chickens, PLoS Genet., 5, e1000512, doi:10.1371/journal.pgen.1000512, 2009. Yakubu, A.: Indigenous chicken flocks of Nasarawa state, Nigeria:
Their characteristics, husbandry and productivity, Tropical and Subtropical Agroecosystems, 12, 69–76, 2010.
Yakubu, A., Kuje, D., and Okpeku, M.: Principal components as measures of size and shape in Nigerian indigenous chickens, Thai J. Agric. Sci., 42, 167–176, 2009.