READ THESE TERMS AND CONDITIONS CAREFULLY BEFORE USING THIS WEBSITE. https://nrc-publications.canada.ca/eng/copyright
Vous avez des questions? Nous pouvons vous aider. Pour communiquer directement avec un auteur, consultez la première page de la revue dans laquelle son article a été publié afin de trouver ses coordonnées. Si vous n’arrivez pas à les repérer, communiquez avec nous à PublicationsArchive-ArchivesPublications@nrc-cnrc.gc.ca.
Questions? Contact the NRC Publications Archive team at
PublicationsArchive-ArchivesPublications@nrc-cnrc.gc.ca. If you wish to email the authors directly, please see the first page of the publication for their contact information.
NRC Publications Archive
Archives des publications du CNRC
This publication could be one of several versions: author’s original, accepted manuscript or the publisher’s version. / La version de cette publication peut être l’une des suivantes : la version prépublication de l’auteur, la version acceptée du manuscrit ou la version de l’éditeur.
Access and use of this website and the material on it are subject to the Terms and Conditions set forth at
Seasonal variation in air tightness of two detached houses
Kim, A. K.; Shaw, C. Y.
https://publications-cnrc.canada.ca/fra/droits
L’accès à ce site Web et l’utilisation de son contenu sont assujettis aux conditions présentées dans le site LISEZ CES CONDITIONS ATTENTIVEMENT AVANT D’UTILISER CE SITE WEB.
NRC Publications Record / Notice d'Archives des publications de CNRC:
https://nrc-publications.canada.ca/eng/view/object/?id=e92b30b2-3197-40af-87b8-c853523d0558 https://publications-cnrc.canada.ca/fra/voir/objet/?id=e92b30b2-3197-40af-87b8-c853523d0558
Ser
TH1 I
N21d
National Research Consell nationalno.
1408
I+
cmm~l~mada
d e r c h l ~ h . ~ r r d .c .
2
Institute for Institut deBIBG
Research in recherche en- -
--
Construction constructionSeasonal Variation in
Aitflghtness of
Two
Detached Houses
by A.K. Kim and C.Y. ShawA ~ J w L Y Z E B
Reprinted from
"Measured Air Leakage of Buildings" ASTM STP 904,1986
p. 17-32
(IRC Paper No. 1408)
Price $2.00 NRCC 26402
r
-
5-.,-..-.-
.,..
I - .
. -
... aDee e s s a i s de mise e n p r e s s i o n p a r v e n t i l a t e u r s o n t 6t.5 e f f e c t u h s u r deux rnaisona inoccup€es, une f o i s t o u t e s l e s deux semaines pendant un a n ( d e mai 1982 B j u i l l e t 19831, pour d e t e r m i n e r l a v a r i a t i o n s a i s o n n i e r e de l l b t a n c h E i t € 3 l ' a i r . Les deux h a b i t a t i o n s B t a i e n t i s o l 6 e s e t a o s s a t u r e d e b o i s . La maison no 1 comportait p l u s d ' i s o l a n t que l ' e x i g e a i t l e code du bbtiment l o c a l e t 6 t a i t d o t & d'un pare-vapeur e n poly6thylSne pour a d l i o r e r son B t a n c h € i t € B l ' a i r . La maison no 2, moins Btanche a l ' a i r , comportait d i v e r s e s c a r a c t k i s t i q u e s m r a l e s e t n ' a v a i t
Bte
dot& d'un pare-vapeur e n p o l y e t h y l e n e que s u r deux m r s seulement. L o r s d e s e s s a i s d ' b t a n c h 0 i t B a l ' a i r , on a mesure l ' h u m i d i t e r e l a t i v e i n t e r i e u r e , l e s t e m p e r a t u r e s e x t e r i e u r e e t i n t e r i e u r e , a i n e i que l a t e n e u r e n humidit6 d e s p o t e a w e t d e s s a b l i s r e s d e l ' o s s a t u r e pour s a v o i r s ' i l e x i s t a i t une r e l a t i o n e n t r e c e s facteurs e t l'&t~"",.s,'L > 1 1 - 4 - 1-.
- - - a --
- 2-1-ts -one rev616 s e l o n l a de l ' b t e debut du. maison mc une c e r t a e t l e t a tAndrew
K .
Kim1
and Chia Y.
Shawl
Seasonal Variation in Airtightness of
Two Detached Houses
Authorized Reprint from Special Technical Publication 909
Copyright American Society for Testing and Materials 191 6 Race Street, Philadelphia, PA 191 03 1986
REFERENCE: Kim, A. K. and Shaw, C. Y., "Seasonal Variation in Airtightness of Two Detached Houses," Measured Air Leakage of Buildings. ASTM STP 904, H. R. Trechsel and P. L. Lagus, Eds., American Society for Testing and Materials, Philadelphia, 1986,
pp. 17-32.
ABSTRACT: Fan pressurization tests on two unoccupied houses were conducted once every two weeks for a period of a year (May 1982 to July 1983) to determine the seasonal variation in airtightness. Both houses are of insulated wood frame construction. House No. 1 was built with more insulation than is required by the local building code, and a polyethylene vapor barrier was applied with special care to improve its airtightness. House No. 2, a less airtight house, was built with various wall construction features and a poly- ethylene vapor barrier in only two walls.
Indoor relative humidity, indoor and outdoor air temperatures, and moisture content of the stud and top plates of the wood framing were measured at the time of airtightness testing to determine whether a correlation exists between these factors and house airtight- ness. The results indicate that air leakage varies throughout the year, with the minimum value in late summer and fall and the maximum value in winter and early spring. The difference is more pronounced in the leakier house. There is also indication of a rough correlation between envelope airtightness and indoor humidity ratio.
KEY WORDS: air leakage, measurement, pressure, fan, weather, residential
A measure of airtightness is given by the amount of air that leaks through a building envelope at a specified pressure difference. Air leakage of houses is generally considered to be constant throughout the year, but a recent study by Warren and Webb [I] indicates that there is seasonal variation on the order of 40% for some houses in the United Kingdom. Persily [2] shows, too, that the air leakage values of some .American houses are, on the average, about 2290 lower in the summer months than in the winter. The reason for this variation is not yet understood completely, but it is presumed that the contraction and
'Research officers, Division of Building Research, National Research Council, Ottawa, Can- ada K I A 0R6.
18 MEASURED AIR LEAKAGE OF BUILDINGS
expansion of building materials as a result of changes in relative humidity have some effect on the airtightness of buildings.
To investigate the magnitude of seasonal variations in air leakage of Cana- dian houses, fan pressurization tests were conducted on two unoccupied houses once every two weeks for a period of a year (May 1982 to July 1983). Indoor relative humidity value, indoor and outdoor air temperatures, and the moisture content of the wood framing were measured at the time of airtight- ness testing. Specifically, the study was designed to determine (1) the seasonal variation in airtightness of the two houses and (2) the effect of indoor humid- ity on airtightness.
Test Houses
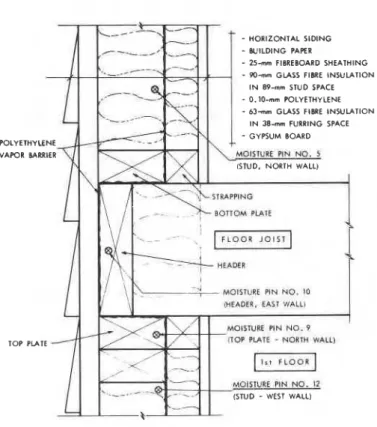
Both test houses are of insulated wood frame construction. House No. 1 (HUDAC MARK XI project house) [3] is a two-story detached house with a full basement located in a developed residential area in the city of Gloucester, Ontario. The house walls are of standard 38 by 89-mm (2 by 4-in.) wood studs with 38 by 38-mm (2 by 2-in.) horizontal wood furring strips nailed on the inside. To improve airtightness, a 0.10-mm (4-mil) polyethylene sheet was installed between the studs and furring to create an insulated space on the inside of the vapor barrier. Inside this sheet, all the electrical outlets and wir- ing were installed without cutting through the polyethylene. Special care was taken to seal all joints in the polyethylene sheet. A cross-section of the wall at the intersection with the second floor is shown in Fig. 1.
House No. 2, less air tight, is located in an open field near the Ottawa air- port. It was built as an experimental house for studying different wall con- struction features. For this reason, a polyethylene vapor barrier was included in only two of the wall construction details. A few of the details are shown in Fig. 2.
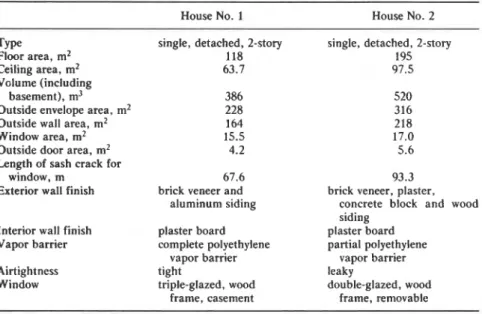
Table 1 provides a brief description of the two test houses. Neither was occupied during the test period, so that there was no internal moisture gener- ation. The only sources of moisture were, therefore, outdoor moisture carried in by air infiltration and, perhaps, ground moisture entering through base- ment walls and the floor.
Tests
The air leakage values of the test houses were determined by means of the fan pressurization test method. Two identical apparatuses were used, each consisting of a 40.6-cm-diameter axial fan with a direct-drive d-c motor. The free discharge capacity of the fan is 1200 L/s.
Each apparatus was located inside the test house, with the discharge side of the fan connected by ductwork to an infill panel in an outside window of
KIM AND SHAW ON SEASONAL VARIATION IN AIRTIGHTNESS 19
- HORIZONTAL SIDING
- UILDING PAPER
- 25mm FIBREBOARD SHEATHING
- POmm GLASS FIBRE INSULATION I N 89-rnm STUD SPACE
- 0.10-mm POLYETHYLENE
- 63mm GLASS FIBRE INSULATION I N 38-rnm FURRING SPACE
- GYPSUM BOARD POLYETHYLENE
VAPOR BARRIER
MOISTURE PIN NO. I0
ilOP U T E
-
NORTH NAIL)MOI5IURE PIN NO. 12
(STUD - WEST WALL)
FIG. I-Typicul wall detail and location of moisture pins. House No. I.
House No. 1 and to an infill panel in a patio door of House No. 2. Both the window and the patio door could be closed on completion of the test without moving the apparatus. The flow rate of the fan was measured with a 20.3-cm orifice plate in House No. 1 and with a pair of total pressure averaging tubes in House No. 2 [4].
Inside-to-outside pressure differences were measured using a diaphragm- type pressure transducer (static error band of 5% full scale). Four pressure taps were installed on the outside faces of the four exterior walls. The taps were manifolded before being connected to the pressure transducer in order to provide an average value of outdoor pressure [ 5 ] .
Each tightness test consisted of measuring the air leakage values at seven or eight pressure differences ranging between 10 and 100 Pa. Measured air leak- age values and pressure differences can be correlated by an expression of the form
d 2 u 3 + a,, < u > ", =
2
+ "7 =-
".KIM AND SHAW ON SEASONAL VARIATION IN AIRTIGHTNESS 21
TABLE 1 -Description of test houses.
House No. 1 House No. 2
Type
Floor area, m2 Ceiling area, m2 Volume (including
basement), m3 Outside envelope area, m2 Outside wall area, m2 Window area, m2 Outside door area, m2 Length of sash crack for
window, m Exterior wall finish
Interior wall finish Vapor barrier
Airtightness Window
single, detached, 2-story 118
67.6
brick veneer and aluminum siding plaster board complete polyethylene vapor barrier tight triple-glazed, wood frame, casement
single, detached, 2-story
195
93.3
brick veneer, plaster, concrete block and wood siding plaster board partial polyethylene vapor barrier leaky double-glazed, wood frame, removable where
Q = air leakage value, L/s,
C = flow coefficient for house, L/(s
-
Pan),A p = pressure difference across exterior wall, Pa, and n = flow exponent.
The values of C and n , or the value of leakage at a specific pressure difference, therefore can be used to characterize the airtightness of the house. In this study, the interpolated leakage at a pressure difference of 50 Pa, designated
QSO, is used as the indicator of the airtightness of the test houses.
Moisture pins (16 in House No. 1 and 8 in House No. 2) were installed at various locations in the exterior walls of the houses. The detailed locations of a few selected moisture pins are shown in Fig. 1 for House No. 1 and in Fig. 2 for House No. 2. All pins were fixed into wood framing members.
Indoor wet- and dry-bulb temperatures were measured using a sling psy- chrometer. The daily mean outdoor air and dew-point temperatures on the test date were obtained from the office of Environment Canada. Moisture contents of the wood framing were measured using a moisture meter with an error band of 1 % during each air leakage test.
22
MEASURED AIR LEAKAGE OF BUILDINGSRepeatability Test and Wind Influence
Although all tests were conducted on relatively calm days (wind speed less than 10 km/h), some variation from one test to another was unavoidable. To corroborate the repeatability of the test results and to determine the effect of wind speed on them, a special series of fan pressurization tests were con- ducted on House No. 1 over a period of seven days. During this time, the air leakage values of the house were determined repeatedly on two calm days, and five air leakage tests were performed on five days when wind speeds ranged from 2 to 24 km/h. The results of the repeatability tests and of the tests with different wind speeds are given in Tables 2 and 3, respectively, in terms of C , n , QS0, and correlation coefficient.
The flow exponent, n , based on the repeatability tests (Table 2), varied between 0.68 and 0.7. To facilitate comparison, values of flow coefficient and leakage were calculated assuming a constant value of n = 0.69 (see Table 2). The variation in flow coefficient, C, is less than 0.5%, suggesting excellent repeatability of the pressurization test results.
Wind around and over a house causes variatiohs in pressure; the amount and pattern of pressure depends on wind direction, building shape, and nearby buildings. Pressures are positive on windward sides and negative on leeward sides. Because of this difference, the correct flow equation under windy conditions should take the form
where i is the variable for the various walls.
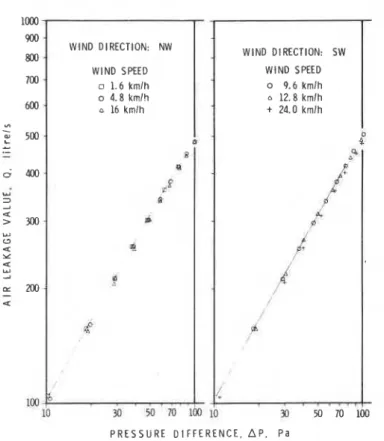
As it is neither practical to solve for C j explicitly from the just-mentioned equation nor possible to conduct all pressurization tests under calm condi- tions, Eq 2 was not used. Thus, the validity of Eq 1 using "average" outside pressure was checked using data measured under various wind speeds and two wind directions. The calculated C and n values for various wind speeds are shown in Table 3 as well as in Fig. 3. The flow exponent, n , varied be- tween 0.69 and 0.7. Again, to facilitate comparison the exponent, n , was as- sumed to be constant at 0.69, and C and Q50 were recalculated. The results indicate that for wind from the exposed side of the house, northwest, the flow coefficient for a wind speed of 16 km/h is about 4% less than that obtained under calm conditions (1.6 km/h). For wind approaching from the shielded side of the house, southwest, the variation in flow coefficient is less than 5% for wind speeds up to 24 km/h. Assuming that the data obtained under a wind speed of 1.6 km/h are correct, Fig. 3 shows that at wind speeds less than 10 km/h the wind effect is negligible.
TABLE 2-Repeatability test {House No. I I .
Correlation C ( n fixed)
a.
( n fixed), CorrelationTest C , L/s(Pa)" n Qso, " L/s Coefficient L/s(Pa)" n L/s Coefficient
(a) WIND SPEED = 4.8 km/h
1 19.9 0.697 304 0.9999 20.4 0.690 304 0.9999 ?! 19.7 0.700 303 0.9999 20.4 0.690 303 0.9999
z
2 305 0.9993 D 3 20.4 0.692 305 0.9996 20.5 0.690 Z 0 (b) WIND SPEED = 1.6 km/h V) I 4 21.1 0.688 311 1.000 20.9 0.690 311 0.9999 5 22.0 0.677 311 0.9996 21.0 0.690 312 0.9978$
6 22.0 0.678 311 1.000 21 .O 0.690 312 0.9994 21 .O 0.690 312 0.99944
7 22.0 0.677 311 1.000 V,= air leakage rate at 50 Pa pressure difference.
6
0
TABLE 3-Effect of wind on air leakage value (House No. I ) .
2
0
Wind C Qso z
-
Wind Speed, C, Correlation ( n fixed). ( n fixed), Correlation Z
24 MEASURED AIR LEAKAGE OF BUILDINGS W I N D DIRECTION: SW W I N D SPEED o 9.6 kmlh 6 12.8 kmlh + 24.0 kmlh P R E S S U R E D I F F E R E N C E , A P . P a
FIG. 3-Effect of wind on air leakage, House No. I .
Results and Discussion
An attempt was made to correlate the seasonal variation of house air leak- age with one or other of the parameters (indoor and outdoor humidity ratios, air temperatures, and moisture content of wall framing), which also vary sea- sonally. In text that follows, the air leakage value at a pressure difference of 50 Pa (QS0) is used to characterize house tightness.
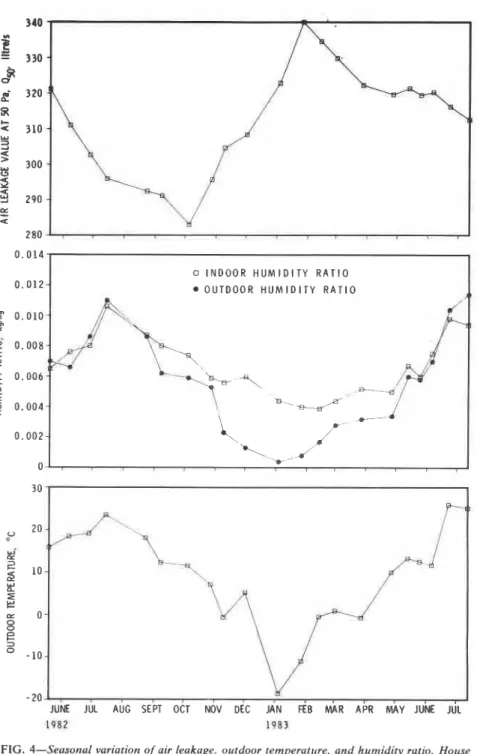
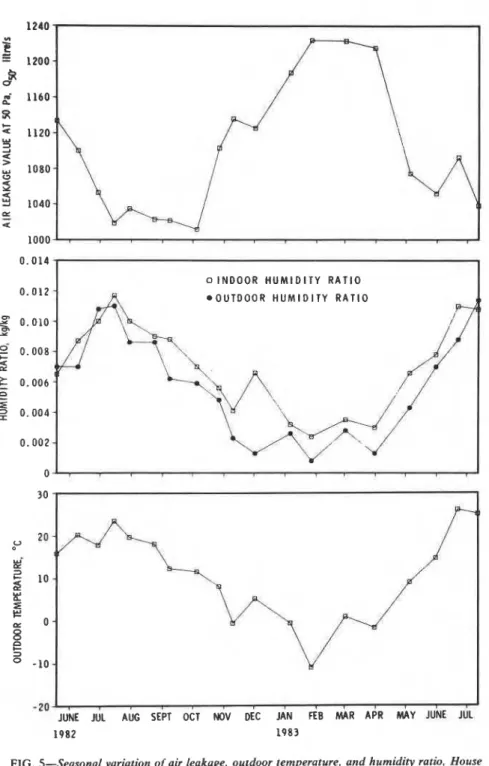
Figures 4 and 5 show the variation of QS0, daily mean outdoor temperature,
and indoor and daily mean outdoor humidity ratios with time for Houses Nos.
1 and 2, respectively. The results indicate a seasonal variation in airtightness.
The houses were tightest in late summer and fall and leakiest in winter and early spring. In each case the maximum air leakage value was about 20% greater than the minimum value. The results also show that (in general) as the humidity ratios and outdoor temperatures decreased, the air leakage values increased.
KIM AND SHAW ON SEASONAL VARIATION IN AIRTIGHTNESS
25
FIG. 4-Seasonal variation of air leakage. outdoor temperature. and humidity ratio, House No. I .
26 MEASURED AIR LEAKAGE OF BUILDINGS 1240 "3 2 E 1200 2 0
2
1160 S: 1120 W 3 A 4 > % 1080 4 Y9
1040 E5 a innnFIG. 5-Seasonal variation of air leakage, ouzdoor temperature, and humidity ratio, House
KIM AND SHAW ON SEASONAL VARIATION IN AIRTIGHTNESS
27
thy that the indoor humidity in House No. 2 was generally lower than that in House No. 1 in winter and higher in summer. This is probably due to differ- ences in both basement moisture gains and airtightness. Because House No. 1 was tighter than House No. 2, its indoor humidity ratio was probably affected less by outdoor conditions.Figures 6 and 7 show the time variation of moisture content in the wall
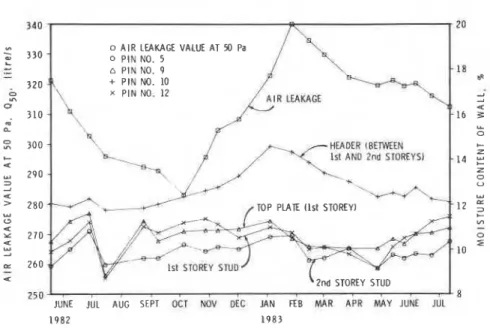
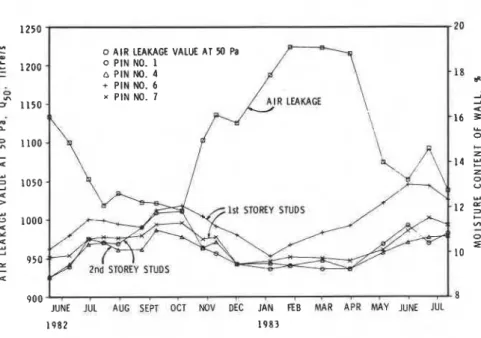
framing for Houses Nos. 1 and 2, respectively. The air leakage values at 50 Pa also are shown. The moisture readings have been corrected for temperature at the tip of the moisture pin. This was estimated from the thermal resistance values of the wall componenis and the indoor and outdoor air temperatures. The results indicate that the moisture contents of the walls in both houses
were reasonably low (in the range of 8 to 14%), and that a trace of seasonal
variation in the moisture content of the wood framing could be detected. Figure 6 shows that Pin No. 10 measured a higher moisture content than all the other moisture pins, and that its pattern of variation was different from theirs. The reason for this difference is that Pin No. 10 was located on the inside of the polyethylene vapor barrier on the east side of the second floor header, while all other pins were located on the outside of the polyethylene. Moreover, Pin No. 10 was the only one located on the cold side of the wall, as shown in Fig. 1 .
Figure 7 shows that Moisture Pins Nos. 6 and 7, located in first-story studs, give slightly higher moisture content values. This could have been due to their
o AIR LEAKAGE VALUE AT 50 Pa 0 P I N NO 5 n P I N NO 9 + P I N NO. 10 x PIN NO. 12 HEADER I 8 N E N PLAIE (1st STOREY)
JUNE JUL AUG SEPT OCT NOV OFC JAN FEE WR APR MAY JUNE JUL
1 9 8 2 1 9 8 3
28 MEASURED AIR LEAKAGE OF BUILDINGS
900 ,
JUNE JUL AUG SEPT OCT NOV DEC JAN FEB MAR APR M Y JUNE JUt
FIG. 7-Seasonal variation of moisture content of woodframing. House No. 2.
location (first story versus second story) or, more probably, to the absence of a vapor barrier.
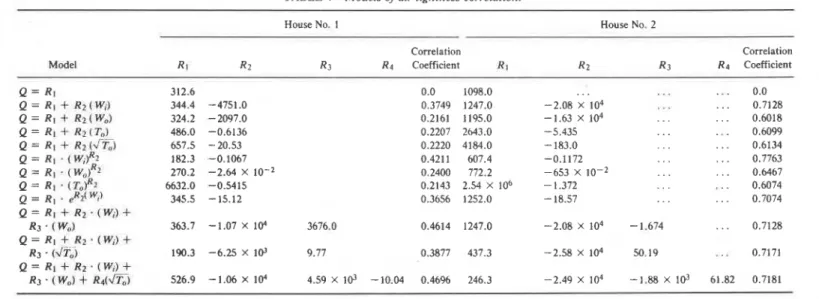
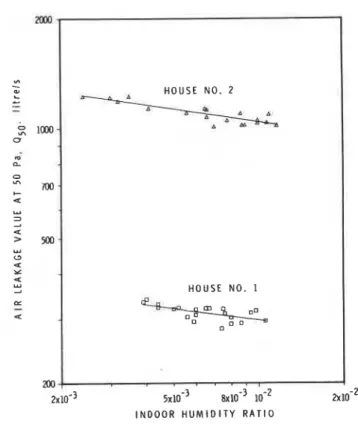
It appears that there is a correlation between airtightness and indoor and daily mean outdoor humidity ratio as well as daily mean outdoor tempera- ture. An attempt was made, therefore, to correlate the air leakage value at 50 Pa with these parameters. Various models were tested. The results shown in Table 4 suggest that the best single-parameter model would be a power law expression relating'air leakage value and indoor humidity ratio (Fig. 8).
where
&
= air leakage value at 50 Pa, L/s,R = dimensional constant, L/s,
W i
= indoor humidity ratio, kg/kg, and(Y = exponent.
The values of R and a were determined as 182.6 and -0.11 for House No. 1 and 607.4 and -0.12 for House No. 2. The difference in R is the differ- ence in the air leakage characteristics of the two houses. To facilitate compar- ison, the air leakage values and indoor humidity ratios of each house were
TABLE 4- Models of air tightness c o r r e l a t i ~ n . ~
House No. I House No. 2
Correlation Correlation M d e l R1 R2 R3 Rq Coefficient R I R2 R3 Rq Coefficient Q = R I 312.6 0.0 1098.0 ... ... . . . 0.0 Q = R1
+
R2(Wi) 344.4 -4751.0 0.3749 1247.0 -2.08 X 10⁴ ... . . . 0.7128 Q = R i + R2(W0) 324.2 -2097.0 0.2161 1195.0 -1.63 X lo4 . . . . . . 0.6018 Q = R l + R z ( ? & 486.0 -0.6136 0.2207 2643.0 -5.435 . . . . . . 0.6099 Q = R I+
RI ( V To) 657.5 -20.53 0.2220 4184.0 -183.0 . . . . . . 0.6134 Q = R l - ( w i f i 182.3 -0.1067 0.4211 607.4 -0.1172 . . . . . . 0.7763 Q = R I.
( w,)*~ 270.2 -2.64 X 0.2400 772.2 -653 X 10W2 . . . . . . 0.6467 Q = R1.
( ~ ~ 1 ~ 2 6632.0 -0.5415 0.2143 2.54 X lo6 -1.372 . . ..
. . 0.6074 Q = R I .pl(Wo)
345.5 -15.12 0.3656 1252.0 - 18.57 . . . . . . 0.7074 Q = R 1 + R I . ( W ~ ) + R3.
( W.1 363.7 -1.07 X 10⁴ 3676.0 0.4614 1247.0 -2.08 X 10⁴ -1.674 . . . 0.7128 Q = R I + R z s ( W i ) + ~3 . (JT,) 190.3 -6.25 X 1Q' 9.77 0.3877 437.3 -2.58 X 10⁴ 50.19.
..
0.7171 Q = R1+
R > - I W i ) + R3.
( W o )+
R ~ J T ~ J 526.9-
1.06 X 10⁴ 4.59 X 10³ -10.04 0.4696 246.3 -2.49 X 10⁴ -1.88 X lo3 61.82 0.7181" W i = indoor humidity ratio, kg/kg;
W,, = outdoor humidity ratio, kg/kg;
30 MEASURED AIR LEAKAGE OF BUILDINGS
- ,,
I N D O O R H U M I D I T Y R A T I O
FIG. 8-Relation between air leakage and humidity rutio. Houses Nos. I und 2.
normalized using seasonal average values. The relation between the normal- ized air leakage value and the indoor humidity ratio is
where
= air leakage value at 50 Pa, L/s,
QS0 = seasonal average of the air leakage value at 50 pa, L/s,
K = constant,
W i
= indoor humidity ratio, kg/kg,wi
= seasonal average of indoor humidity ratio, kg/kg, and0
= exponent.The values of
fl
for Houses Nos. 1 and 2 were found to be -0.11 and -0.12, respectively, and of K were 0.995 and 0.986, respectiVely. As thefl
KIM AND SHAW ON SEASONAL VARIATION IN AIRTIGHTNESS 31
2 . 0 0
-
0 Y\!_o 1 . 7 5 - 0 HOUSE NO. 1
0 Y\ 6 HOUSE NO. 2 0
-
1 . 5 0 - 0 0 Y\ 1 . 2 5 - a Y 0 a 1 . 0 0 - a S on O O h Y a ,A 0~ ~ ~ t . .
6 A m M A P: 0 . 7 5 --
a n 0 . 5 0 --
A a2
0 . 2 5 - 0 Z 0 , 0 0 . 2 0 . 4 0 . 6 0 . 8 1 . 0 1 . 2 1 . 4 1 . 6 1 . 8 2.0 N O R M A L I Z E D INDOOR H U M I D I T Y R A T I O . w i l W iFIG. 9-Relation between normalized air leakage value and humidity ratio.
combined in Fig. 9 in estimating the values of
B
and K applicable to both. The values of /3 and K were found t a b e -0.11 and 0.991, respectively. Summary1. Air leakage values measured in two unoccupied houses show seasonal variation, being lowest in late summer and fall and highest in winter and early spring. The maximum air leakage value is approximately 20% greater than the minimum value for both houses.
2. The results indicate that there is a strong relation between air leakage value and indoor humidity ratio. For the two unoccupied houses, this relation may be expressed by the equation
Acknowledgment
The authors wish to acknowledge the assistance of D. L. Logan in conduct- ing the tests. This paper is a contribution of the Division of Building Re-
32
MEASURED AIR LEAKAGE OF BUILDINGSsearch, National Research Council of Canada, and is published with the ap- proval of the director of the Division.
References
[ I ] Warren, P. R. and Webb, B. C.. "Ventilation Measurements in Housing," CIBS Sympo-
sium, Natural Ventilation by Design, London, 1980, Chartered Institution of Building Ser- vices, London.
[ 2 ] Persily, A., "Understanding Air Infiltration in Homes," Report PU/CEES 129, Princeton University, Princeton, NJ, 1982.
[ 3 ] Quirouette, R. L., "The Mark XI Energy Research Project-Design and Construction," Building Research Note 131. National Research Council of Canada, Division of Building Research, Ottawa, Canada, Oct. 1978.
[ 4 ] Shaw, C. Y . and Jones, L., ASHRAE Transactions, Vol. 85, Part 1, 1979, pp. 85-95.
1.51 Gumley, S. J . , Journal of Wind Engineering and Industrial Aerodynamics, Vol. 12, 1983, pp. 189-228.
DISCUSSION
David Saum' (written discussion)-What was the 50 Pa air changes per hour (ACH) of the leaky house? What was the percent error in ACH measure- ments that was not due to seasonal variations?
A. Kim and C. Y. Shaw (authors ' closure)-The ACH of the leaky house at
50 Pa was about 8 ACH. The percent error in ACH measurements was less
than 2%.
John S h a G (written discussion)-I assume that the house configuration did not change between winter and summer. Therefore, what is the cause of the winter/summer differences that were observed?
A. Kim and C. Y. Shaw (authors'c1osure)-It seems that the moisture con-
tent of the exterior envelope has some effect on the change in house airtight- ness.
Donald Colliver) (written discussion)-It takes a finite amount of time for the materials in the house to pick up/release moisture and therefore to ex- pand or extract. Are your humidity measurements instantaneous measure- ments or are they an average of prior hours humidity measurements?
A. Kim and C. Y. Shaw (authors' closurel-They are instantaneous mea- surements.
'Infiltec, Waynesboro, VA.
*U.S. Department of Energy, Environmental Measurements Laboratory, New York, NY 10014.
T h i s paper i s being d i s t r i b u t e d i n r e p r i n t form by t h e I n s t i t u t e f o r Research i n C o n s t r u c t i o n . A l i s t of b u i l d i n g p r a c t i c e and r e s e a r c h p u b l i c a t i o n s a v a i l a b l e from t h e I n s t i t u t e may be o b t a i n e d by w r i t i n g t o t h e P u b l i c a t i o n s S e c t i o n , I n s t i t u t e f o r Research i n C o n s t t u c t i o n , N a t i o n a l Research C o u n c i l of C a n a d a , O t t a w a , O n t a r i o ,