HAL Id: hal-02145303
https://hal.archives-ouvertes.fr/hal-02145303
Submitted on 23 Oct 2020
HAL is a multi-disciplinary open access
archive for the deposit and dissemination of
sci-entific research documents, whether they are
pub-lished or not. The documents may come from
teaching and research institutions in France or
abroad, or from public or private research centers.
L’archive ouverte pluridisciplinaire HAL, est
destinée au dépôt et à la diffusion de documents
scientifiques de niveau recherche, publiés ou non,
émanant des établissements d’enseignement et de
recherche français ou étrangers, des laboratoires
publics ou privés.
htsint: a Python library for sequencing pipelines that
combines data through gene set generation
Adam J. Richards, Anthony Herrel, Camille Bonneaud
To cite this version:
Adam J. Richards, Anthony Herrel, Camille Bonneaud. htsint: a Python library for sequencing
pipelines that combines data through gene set generation. BMC Bioinformatics, BioMed Central,
2015, 16 (1), �10.1186/s12859-015-0729-3�. �hal-02145303�
S O F T W A R E
Open Access
htsint: a Python library for sequencing
pipelines that combines data through gene set
generation
Adam J. Richards
1*, Anthony Herrel
2,3and Camille Bonneaud
1,4Abstract
Background: Sequencing technologies provide a wealth of details in terms of genes, expression, splice variants, polymorphisms, and other features. A standard for sequencing analysis pipelines is to put genomic or transcriptomic features into a context of known functional information, but the relationships between ontology terms are often ignored. For RNA-Seq, considering genes and their genetic variants at the group level enables a convenient way to both integrate annotation data and detect small coordinated changes between experimental conditions, a known caveat of gene level analyses.
Results: We introduce the high throughput data integration tool, htsint, as an extension to the commonly used gene set enrichment frameworks. The central aim of htsint is to compile annotation information from one or more taxa in order to calculate functional distances among all genes in a specified gene space. Spectral clustering is then used to partition the genes, thereby generating functional modules. The gene space can range from a targeted list of genes, like a specific pathway, all the way to an ensemble of genomes. Given a collection of gene sets and a count matrix of transcriptomic features (e.g. expression, polymorphisms), the gene sets produced by htsint can be tested for ‘enrichment’ or conditional differences using one of a number of commonly available packages.
Conclusion: The database and bundled tools to generate functional modules were designed with sequencing pipelines in mind, but the toolkit nature of htsint allows it to also be used in other areas of genomics. The software is freely available as a Python library through GitHub at https://github.com/ajrichards/htsint.
Keywords: Gene set analysis, Gene ontology, RNA-Seq
Background
The use of archived knowledge when analyzing sequenc-ing data is both typical and necessary to navigate the often vast quantities of gene-oriented results produced with high-throughput sequencing technologies. These sequencing techniques, when applied to the transcrip-tome, are referred to as RNA-Sequencing (RNA-Seq) and their use has taken a key role in transcriptomics [1]. The organization of transcriptomes is naturally modular [2] and the integration of heterogeneous data improves our ability to resolve relevant biological processes [3].
*Correspondence: [email protected]
1Station d’Ecologie Expérimentale du CNRS, USR 2936, Route du CNRS, 09200 Moulis, France
Full list of author information is available at the end of the article
Different forms of experimental data capture different aspects of a larger, more complex biological system. Sub-ramanian and colleagues introduced the method of Gene Set Enrichment Analysis (GSEA), which both emulates the modular nature of biological systems and provides a generalizable framework to integrate multiple sources of data into transcriptomic analysis pipelines [3].
GSEA, or more generally referred to as Gene Set Analysis (GSA), is a diverse group of statistical meth-ods that conceptually can be divided into three gen-eral approaches. Arguably the most popular approaches are singular enrichment methods, which can be distin-guished from the other methods because they are gen-erally based on the hypergeometric distribution, a Chi-square test, a Fisher’s exact test, or a Binomial probability.
© 2015 Richards et al. Open Access This article is distributed under the terms of the Creative Commons Attribution 4.0 International License (http://creativecommons.org/licenses/by/4.0/), which permits unrestricted use, distribution, and reproduction in any medium, provided you give appropriate credit to the original author(s) and the source, provide a link to the Creative Commons license, and indicate if changes were made. The Creative Commons Public Domain Dedication waiver (http://creativecommons.org/publicdomain/zero/1.0/) applies to the data made available in this article, unless otherwise stated.
Richards et al. BMC Bioinformatics (2015) 16:307 Page 2 of 7
For discussion see [4]. Generally these methods are used to test a group of differentially expressed genes for ‘enrich-ment’ with genes that are annotated with a particular term, which yields a p-value for each term. Clearly, sin-gular enrichment methods are useful for understanding how genes in a group are related. However, there are two main concerns: (1) one has to devise a summarizing met-ric and (2) the relationship among terms is not considered. For example, if we have a group of genes that contain a mixture of annotations consisting of neuron differen-tiation (GO:0030182), neuron remodeling (GO:0016322) and neuron development (GO:0048666) it is possible that none of the individual terms are significantly enriched, yet the group of genes are undoubtedly related to the progression of neurons over time.
The remaining two approaches for GSA require that there are gene sets, relevant to the goals of the exper-iment, in hand before analyses are undertaken. Often, these gene sets take the form of curated biochemical pathways, like those maintained by KEGG (Kyoto Ency-clopedia of Genes and Genomes [5] or they may be based on an ontology, of which the Gene Ontology (GO) [6] is the standard for most organisms. The distinction between the other two approaches is made between meth-ods that compare values among genes in the set against all other genes in the experiment and those that use the values to test for differences between two phenotypes [7]. There is a lack of consensus among methodologies and suggested ‘best practices’ for GSA methods that require gene sets a priori. A number of reviews discuss the topic [8–10].
Resources are abundant for carrying out the func-tional analyses of gene sets and among them the software DAVID [11] is one of the most frequently used. DAVID is a web-based platform that is accessible to a broad range of users and carries out a number of tasks useful for RNA-seq pipelines including the following: namespace map-ping, functional annotation, enrichment analyses, and importantly a variety of ways to navigate the results. In the past decade, the use of functional annotations has experienced unprecedented growth, be it statistical, algo-rithmic or tool specific [12], but a disproportionately small amount of effort has been placed on the critical step of gene set generation, perhaps helping to explain why sin-gular enrichment methods are more frequently used than
a prioribased ones, despite the perceived advantages of GSA.
htsintis a software library that enables the creation of genes sets independently of the method employed by the user to test these sets for significance. Because gene sets are produced using an unsupervised approach and because it is well-known that high-throughput sequencing results are difficult to interpret, visualization tools were included as part of htsint.
Implementation
Conceptually, the aim of htsint is to use compiled annotation information from one or more genomes in order to calculate distances among all genes in a specified gene space. This implies a need for efficient annotation querying at the level of taxa. To address this along with name-space mapping, and related organizational tasks, a database is included as an integral part of the library. A common task in bioinformatics is to map gene names to protein space or vice versa and this capacity is facilitated through the database. In addition to the database compo-nent there are Gene Ontology, blast mapping, and pipeline components. These three components comprise the core of the library and additional tools are present in a support role.
Python is an efficient programming language for bioin-formatics because it is object-oriented, flexible, syntacti-cally clean and there is a growing ecosystem of packages [13]. Recently, the package HTSeq was released to pro-vide a Python-centric environment for high-throughput sequencing pipelines [14]. HTSeq has a developed set of tools for managing reads, assemblies, performing quality assurance, and generation of count matrices. htsint is complementary to HTSeq as it aggregates annotation data specifically for hypothesis testing, while HTSeq and other environments, like Bioconductor [15], facilitate the rest of the pipeline. Convenient packages that include SeqGSEA [16] and GSA [17] exist to carry out the significance testing portion of the pipeline.
Database
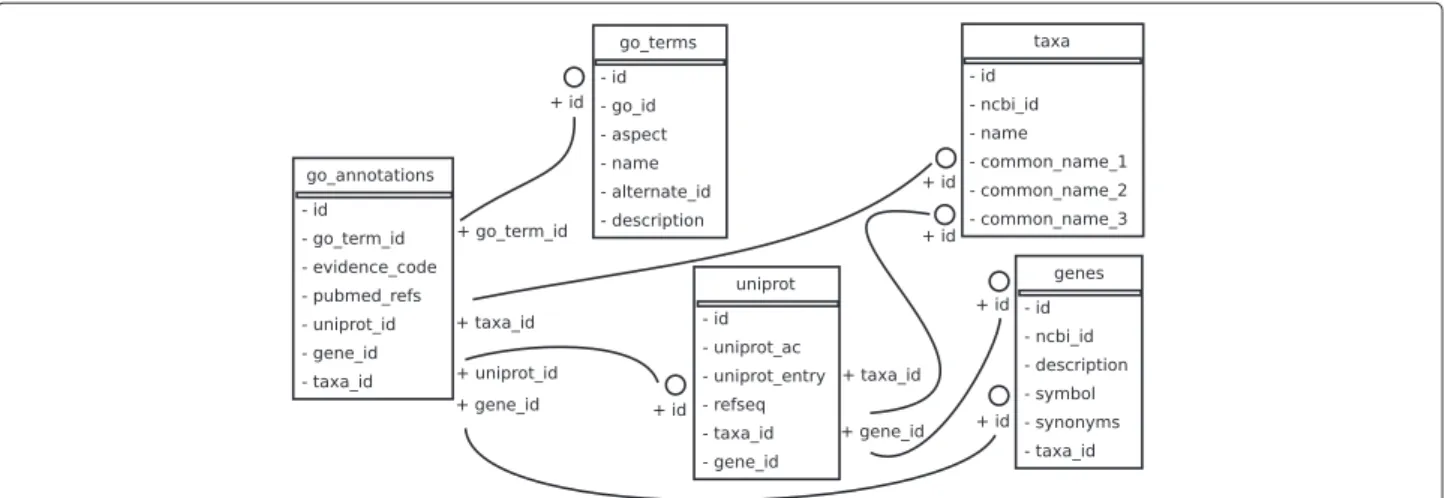
The database considers by default some of the most commonly studied taxa and for each corresponding gene and protein, GO information is populated either at database initialization or afterwards. The content of the database reflects a list of taxa that are specified in a configuration file. It is possible to populate the database with all available taxa; however, this is not nec-essary in most cases. The module gathers data, from the National Center for Biotechnology Information (NCBI) ftp://ftp.ncbi.nlm.nih.gov, Uniprot [18] and the GO. The database tables are genes, taxa, uniprot, go_terms, and go_annotations. They are shown as a database schema in Fig. 1. We used the object relational mapper available as part of the Python package SQLAlchemy http://www. sqlalchemy.org to keep the database accessible, extensible, and flexible.
Gene ontology
The GeneOntology class exists for organizing anno-tations and building GO graphs. Several helper func-tions are also available to fetch GO annotafunc-tions from the database and these are described with examples, in the documentation. The Python package NetworkX [19] is
Fig. 1 Database entity diagram. Data collected from NCBI, the Gene Ontology, and UniProt are organized for efficient taxa related queries. The
database tables or entities are shown along with their attributes. The relationships among tables are designated with edges that connect specific attributes
central to the GeneOntology class, because the library is mature enough to handle all graph manipulations natively. GeneOntology is a container for a NetworkX Graphclass, which removes much of the burden asso-ciated with the graph representation and makes it easier for the general community to develop new algorithms. Furthermore, the visualization of GO networks (or clus-ters) is simplified through NetworkX as it interfaces with Matplotlib [20], the standard Python library for scien-tific plotting, and it can export to the powerful network visualization tool Cytoscape [21].
BLAST
The clustering of genes, based on distances estimated from annotation data, does not directly require homol-ogy mapping, but in the context of RNA-Seq pipelines, sequence alignment becomes a necessity. The command line tool, BLAST+, [22] is used either directly or through BioPython [23] to produce a mapping of transcripts against a relevant database like the SwissProt portion of UniProt [18]. The htsint class BlastMapper inter-faces these results with the database and pipeline com-ponents of the library. The class can be used broadly to summarize the taxa that are associated with an assembled transcriptome or to map between the transcripts and mul-tiple taxa. If mulmul-tiple taxa are used to create a collection of gene sets, then identifying orthologous and paralogous genes is a required step before GSEA methods may be employed.
Pipeline
The pipeline to create gene sets is the same for DNA-Seq and RNA-DNA-Seq. This process has been generalized so gene space can refer to a genome, a transcriptome or any arbitrary gene space defined by the user. The user first
defines a list of genes x, as well as a list of taxa t to use for functional inference. There are several core classes in htsintthat are used to carry out the basic steps involved in the pipeline described below, with a more detailed explanation following.
1. Define the gene spacex
2. Define the taxa spacet as the unique taxa from x 3. Create a GO scaffoldG (Fig. 2a)
4. Annotate all terms inG with terms from t (Fig. 2b) 5. Weight the edges ofG using a measure of semantic
similarity
6. Find all pairwise shortest paths inG to create Gc
(Fig. 2c)
7. Map term-term shortest paths in Gcto gene space
8. Use spectral clustering to partition the genes into clusters
In RNA-Seq pipelines, the gene sets are generally used for significance testing and it follows that genes must be in x or have reasonable sequence homology with genes in
xto be considered for testing. It is useful to BLAST all the genes to be used for testing against t so that there is a mapping between the produced gene sets and the genes that will be used for testing. The core of the pipeline is shown graphically in Fig. 2 to highlight how data from multiple species are integrated through the production of gene sets. The entire pipeline, including steps for BLAST mapping, is demonstrated in the tutorial section of the documentation.
As shown in Fig. 2, a GO graph is first cre-ated for all the terms in a given GO aspect (e.g. biological_process). Then all annotations corre-sponding to the genes (x) and taxa (t) are appended to the graph. Next, the GO graph is trimmed and the edges
Richards et al. BMC Bioinformatics (2015) 16:307 Page 4 of 7
A B C
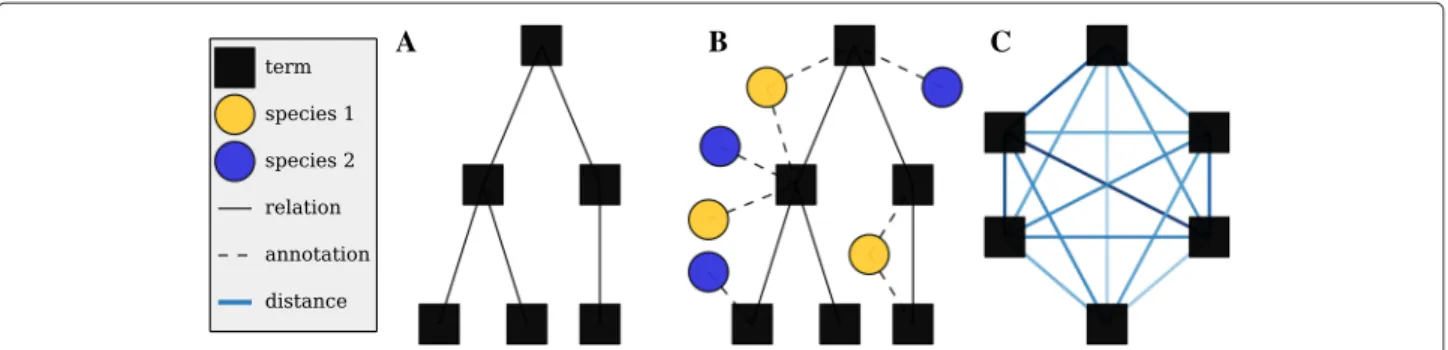
Fig. 2 Calculating distances. a Represent a specific aspect of the GO (e.g. biological process) as a directed acyclic graph with solid edges
corresponding to the is_a and part_of relationships and nodes representing specific ontology terms. b Genes for one or more taxa are added to the network via annotations (dashed edged) and they are used to calculate term-term distances. c The term relationships can be re-drawn as a fully connected graph where each weighted edge corresponds to a pairwise shortest path from (b). The graph is then represented in gene space as a distance matrix for subsequent clustering
are weighted by estimating all term-term distances—a computationally intensive step. The distance is based on information theory, where differences in the Informa-tion Content (IC) of semantic entities are employed as a measure of the semantic distance [24, 25].
IC(t) = − ln P(t),
such that P(t) is the number of annotation instances of the term divided by total number of annotation instances from the annotation database. We can then define the semantic distance between a parent-child pair of GO terms as
dist(tp, tc) = |IC(tp) − IC(tc)|.
GO co-mentioning is included as an optional way to augment the GO graph with edges representing shared gene products [26]. Additional measures of semantic dis-tance will be included in later releases of htsint [27]. Given the graph weighted with semantic distances, all pairwise shortest paths between terms are subsequently computed using a parallel version of Dijkstra’s algorithm [28]. For graphs with more than a few thousand ontology terms, it is recommended to carry out the distance calculations in a parallel environment. The term specific distance matrix is then mapped to a gene specific distance matrix to be used as input in an implementation of the spectral clustering algorithm, a graph partitioning method [29]. Gene to gene distances are set to the shortest path among all possible term-term paths that connect two given genes.
The idea of using spectral clustering in this way is based on previous work where it was shown that the method reasonably partitions gene sets into meaning-ful functional modules even in the presence of unrelated genes [26]. Additional methodological details and discus-sion are provided therein where several experiments with pathways and molecular interaction data provide ratio-nale. In particular, there is evidence that multiple sources
of annotation information can be combined at the level of affinity matrices to improve the quality of functional modules. The integration of arbitrary annotation informa-tion (chromosomal locainforma-tion, cis-regulatory informainforma-tion, phenotype data etc.) using the scaffolding of the GO is the future of htsint. However, it was necessary to first provide a flexible library with expandable database capabilities before the integration aspects of the package were investigated and implemented. The gene sets pro-duced under this scheme may be referred to as functional modules.
An example and documentation
Historically, an important vertebrate model for embry-ology and developmental biembry-ology has been Xenopus
lae-vis, but because the genome is pseudotetraploid many researchers have turned, in recent years, to the related
Xenopus tropicalisin order to work with its more tractable diploid genome. The genome of X. tropicalis has been published [30] and the developmental transcriptome was detailed more recently [31]. These studies are part of a larger effort that has converged in the form of the Xenopus genomics resource Xenbase [32].
In the tutorial example of the htsint documen-tation, we combine all available functional informa-tion for X. tropicalis and X. laevis at the level of biological_process. All animal related procedures and experiments used to produce the expression data in the tutorial were approved by the Comité Cuvier at the Muséum National d’Histoire Naturelle (Paris, France). To minimize the runtime for the documentation example, we exclude annotations that are inferred electronically, also designated as inferred electronic annotations (IEA). Whether or not IEA annotations should be included when generating gene sets is project and taxa dependent. This is because they will increase the amount of genes included in the gene sets, but they will also make use of non-curated annotations, that may or may not be appropriate
for a given project. It should be noted, however, that the reliability of these annotations has improved with recent algorithmic advances [33].
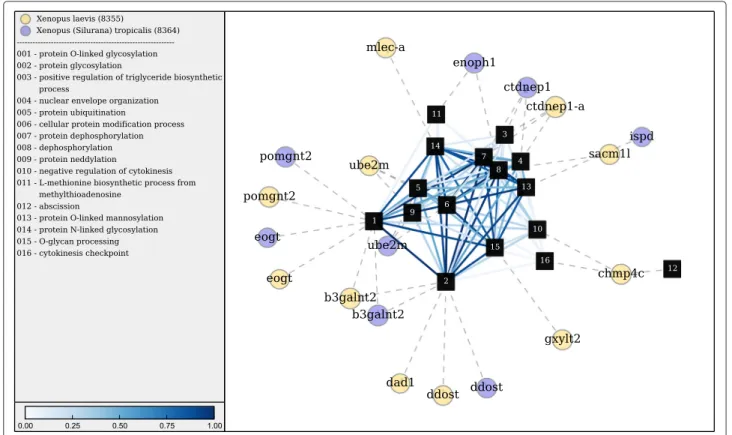
The documentation includes an important discussion on parameter estimation and details the entire process that begins with selecting taxa/genes and ends with gene set visualization. The documentation is written using a tool designed for reproducible research, lpEdit [34]. The literate programming style of documentation embeds functional code within the prose of the tutorial. In the tutorial example, a de novo assembly of X. tropicalis pro-vides context and serves as a working example of htsint. The produced gene sets are tested for significance using GSA [17] and the most significant gene set is visual-ized. The gene set (shown in Fig. 3) is dominated by glycosylation and other post-translational modifications providing a point of entry for further investigation into genes associated with transcript differential expression.
Results and discussion
Constructing gene sets from user-specified annotation data is comparable to using the literature to generate hypotheses for testing. For a given organism, partitions
provide a functional map of the genome based on accu-mulated biological knowledge. In general, the gene sets derived from this process provide a faithful description of the annotated (curated or inferred) portion of the tran-scriptome, but there will remain a percentage of the genes that are not included in significance testing. Although adding well-annotated taxa helps alleviate this problem, this comes at the cost of potentially introducing mislead-ing annotation data. Visualizmislead-ing gene sets as a network complete with taxa-specific annotation data is a way to evaluate the quality of a gene set based on gene and term functional relationships.
Much of the discussion has been about gene set gen-eration; however, it is important to reiterate that gene set methods themselves offer important advantages over gene-level based analyses. Differential expression can occur as a coordinated change among a group of biologi-cally relevant genes and when these differences are small, then the efficiency of gene-level statistics may be impeded due to a lack of statistical power and a need to correct for multiple comparisons.
A major goal of htsint is to provide users with the ability to explicitly specify taxa (and evidence codes)
Fig. 3 Gene set visualization. htsint was used to visualize a gene set that is produced in the tutorial section of the documentation. Gene Ontology
terms are shown as square nodes with the rank according to the number of connections indicated by the label. Additionally, the full name for each term is provided in the legend. Terms are connected by edges representing their semantic distance, which is scaled and shown only for a percentile cutoff (default is 25th) for visualization purposes. Genes are represented as circular nodes with NCBI gene symbols overlaid as labels. The gene nodes
Richards et al. BMC Bioinformatics (2015) 16:307 Page 6 of 7
based on experimental context—that is based on what the domain expert feels is best. We feel that a form of phyloge-netic distance is the most biologically meaningful way to select species, but from a practical perspective the anno-tation coverage will play a more important role in the selection process. Annotation coverage can be calculated using the database and a phylogenetic distance calculator will be soon included as part of the library.
Conclusion
Now that sequencing technologies are being applied more frequently to non-model organisms, there is a demand for customizable tools that aid functional analyses. Partition-ing genes based on information from a list of designated taxa gives the user control over which information is used to generate the gene sets to be used for hypothesis test-ing. GSA methods are a natural way to test the generated gene sets for statistical significance, and the large num-ber of GSA variants that exist allow generated gene sets to be used in the context of numerous experimental scenar-ios. Most importantly, this pipeline for gene set creation keeps the analysis intuitive, without requiring detailed algorithmic or mathematical knowledge, as the produced gene sets can be visualized based on connecting annota-tions and semantic distance. Viewing a pathway, genome or a transcriptome as a set of functionally coherent build-ing blocks is a powerful way to investigate biological phenomena.
Availability and requirements
Project name:htsint
Project home page:https://github.com/ajrichards/htsint
Operating system(s):Platform independent
Programming language:Python
Other requirements: PostgreSQL, NumPy, NetworkX, SQLAlchemy, Psycopg2, Biopython
License:MIT
Any restrictions to use by non-academics:None
Abbreviations
htsint: High-Throughput data INTegration library, GSA: Gene Set Analysis, RNA-Seq: RNA sequencing, GSEA: Gene Set Enrichment Analysis, GO: Gene Ontology, IEA: Inferred from Electronic Annotation, IC: Information Content, DAVID: Database for Annotation, Visualization and Integrated Discovery, HTSeq: Python package for High-Throughput Sequencing, SeqGSEA: Sequencing Gene Set Enrichment Analysis (R package), KEGG: Kyoto Encyclopedia of Genes and Genomes, NCBI: National Center for Biotechnology Information.
Competing interests
The authors declare that they have no competing interests. Authors’ contributions
All authors contributed to the conception of the software. The software was written and is currently being maintained by AJR. Iterative performance and feature improvements were made through the biological context provided by CB and AH. All authors have read and approved the final version of the manuscript.
Acknowledgements
We would like to thank Michel Baguette and Hervé Philippe for providing valuable resources and discussion. Support for this work was provided by the Agence Nationale de la Recherche (ANR; France) MOBIGEN [ANR- 09- PEXT-003] and by a NERC research grant (NE/M00256X/1; UK). We also thank the anonymous reviewers for their comments and suggestions to improve the software and manuscript.
Author details
1Station d’Ecologie Expérimentale du CNRS, USR 2936, Route du CNRS, 09200 Moulis, France.2UMR 7179 CNRS/MNHN, Département d’Ecologie et de Gestion de la Biodiversité 57 rue Cuvier, Case postale 55, 75231 Paris, France. 3Ghent University, Evolutionary Morphology of Vertebrates, K.L.
Ledeganckstraat 35, B-9000 Ghent, Belgium.4Centre for Ecology &
Conservation, College of Life and Environmental Sciences, University of Exeter, Penryn TR10 9FE, Cornwall, UK.
Received: 25 March 2015 Accepted: 8 September 2015
References
1. Wang Z, Gerstein M, Snyder M. RNA-Seq: A revolutionary tool for transcriptomics. Nat Rev Genet. 2009;10(1):57–63.
2. Tanay A, Sharan R, Kupiec M, Shamir R. Revealing modularity and organization in the yeast molecular network by integrated analysis of highly heterogeneous genomewide data. PNAS. 2004;101(9):2981–986. 3. Subramanian A, Tamayo P, Mootha VK, Mukherjee S, Ebert BL, Gillette MA, et al. Gene set enrichment analysis: a knowledge-based approach for interpreting genome-wide expression profiles. PNAS. 2005;102(43): 15545–50.
4. Khatri P, Dr˘aghici S. Ontological analysis of gene expression data: current tools, limitations, and open problems. Bioinformatics. 2005;21(18): 3587–595.
5. Kanehisa M, Goto S, Hattori M, Aoki-Kinoshita KF, Itoh M, Kawashima S, et al. From genomics to chemical genomics: new developments in KEGG. Nucleic Acids Res. 2006;34(Database issue):354–7.
6. Ashburner M, Ball CA, Blake JA, Botstein D, Butler H, Cherry JM, et al. Gene ontology: tool for the unification of biology. Nat Geosci. 2000;25(1): 25–9.
7. Goeman JJ, Bühlmann P. Analyzing gene expression data in terms of gene sets: methodological issues. Bioinformatics. 2007;23(8):980–7. 8. Hung JH, Yang TH, Hu Z, Weng Z, DeLisi C. Gene set enrichment
analysis: performance evaluation and usage guidelines. Brief Bioinform. 2012;13(3):281–91.
9. Maciejewski H. Gene set analysis methods: statistical models and methodological differences. Brief Bioinform. 2013;15(4):504–18. 10. Rahmatallah Y, Emmert-Streib F, Glazko G. Comparative evaluation of
gene set analysis approaches for RNA-Seq data. BMC Bioinforma. 2014;15(1):397.
11. Huang DW, Sherman BT, Lempicki RA. Systematic and integrative analysis of large gene lists using DAVID bioinformatics resources. Nat Protoc. 2009;4(1):44–57.
12. Fang G, Bhardwaj N, Robilotto R, Gerstein MB. Getting started in gene orthology and functional analysis. PLoS Comput Biol. 2010;6(3):1000703. 13. Bassi S. A primer on python for life science researchers. PLoS Comput Biol.
2007;3(11):199.
14. Anders S, Pyl PT, Huber W. HTSeq - A Python framework to work with high-throughput sequencing data. Bioinformatics. 2015;31(2):166–9. 15. Gentleman RC, Carey VJ, Bates DM, Bolstad B, Dettling M, Dudoit S, et
al. Bioconductor: Open software development for computational biology and bioinformatics. Genome Biology. 2004;5:80.
16. Wang X, Cairns MJ. Seqgsea: a bioconductor package for gene set enrichment analysis of rna-seq data integrating differential expression and splicing. Bioinformatics. 2014;30(12):1777–9.
17. Efron B, Tibshirani R. On testing the significance of sets of genes. Ann Appl Stat. 2007;1(1):107–29.
18. Consortium U. Activities at the universal protein resource (uniprot). Nucleic Acids Res. 2014;42(Database issue):191–8.
19. Hagberg AA, Schult DA, Swart PJ. Exploring network structure, dynamics, and function using NetworkX In: Varoquaux G, Vaught T, Millman J,
editors. Proceedings of the 7th Python in Science Conference (SciPy 2008). Pasadena, CA, USA; 2008. p. 11–16.
20. Hunter JD. Matplotlib: A 2d graphics environment. Comput Sci Eng. 2007;9(3):90–5.
21. Shannon P, Markiel A, Ozier O, Baliga NS, Wang JT, Ramage D, et al. Cytoscape: a software environment for integrated models of biomolecular interaction networks. Genome Res. 2003;13(11):2498–504. 22. Camacho C, Coulouris G, Avagyan V, Ma N, Papadopoulos J, Bealer K, et
al. BLAST+: architecture and applications. BMC Bioinforma. 2009;10:421. 23. Cock PJA, Antao T, Chang JT, Chapman BA, Cox CJ, Dalke A, et al.
Biopython: freely available python tools for computational molecular biology and bioinformatics. Bioinformatics. 2009;25(11):1422–3. 24. Resnik P. Using information content to evaluate semantic similarity in a
taxonomy. In: Proceedings of IJCAI. IJCAI’95. San Francisco, CA, USA: Morgan Kaufmann Publishers Inc.; 1995. p. 448–53.
25. Lin D. An information-theoretic definition of similarity. In: Proceedings of the Fifteenth International Conference on Machine Learning. ICML ’98. San Francisco, CA, USA: Morgan Kaufmann Publishers Inc.; 1998. p. 296–304. 26. Richards AJ, Schwacke JH, Rohrer B, Cowart LA, Lu X. Revealing
functionally coherent subsets using a spectral clustering and an information integration approach. BMC Syst Biol. 2012;6(Suppl 3):7. 27. Pesquita C, Faria D, Falcão AO, Lord P, Couto FM. Semantic similarity in
biomedical ontologies. PLoS Comput Biol. 2009;5(7):1000443. 28. Dijkstra EW. A note on two problems in connexion with graphs. Numer
Math. 1959;1:269–71.
29. Ng AY, Jordan MI, Weiss Y. On spectral clustering: Analysis and an algorithm In: Dietterich TG, Becker S, Ghahramani Z, editors. Advances in Neural Information Processing Systems 14. Cambridge, MA: MIT Press; 2001. p. 849–56.
30. Hellsten U, Harland RM, Gilchrist MJ, Hendrix D, Jurka J, Kapitonov V, et al. The genome of the western clawed frog Xenopus tropicalis. Science. 2010;328(5978):633–6.
31. Tan MH, Au KF, Yablonovitch AL, Wills AE, Chuang J, Baker JC, et al. RNA sequencing reveals a diverse and dynamic repertoire of the Xenopus tropicalis transcriptome over development. Genome Res. 2013;23(1): 201–16.
32. Bowes JB, Snyder KA, Segerdell E, Gibb R, Jarabek C, Noumen E, et al. Xenbase: a xenopus biology and genomics resource. Nucleic Acids Res. 2008;36(Database issue):761–7.
33. Skunca N, Altenhoff A, Dessimoz C. Quality of computationally inferred gene ontology annotations. PLoS Comput Biol. 2012;8(5):1002533. 34. Richards A, Kosinski A, Bonneaud C, Legrand D, Owzar K. lpEdit: an
editor to facilitate reproducible analysis via literate programming In: van der Walt S, Millman J, Huff K, editors. Proceedings of the 12th Python in Science Conference; 2013. p. 85–89.
Submit your next manuscript to BioMed Central and take full advantage of:
• Convenient online submission • Thorough peer review
• No space constraints or color figure charges • Immediate publication on acceptance
• Inclusion in PubMed, CAS, Scopus and Google Scholar • Research which is freely available for redistribution
Submit your manuscript at www.biomedcentral.com/submit