HAL Id: hal-02108788
https://hal.archives-ouvertes.fr/hal-02108788
Submitted on 24 Apr 2019
HAL is a multi-disciplinary open access
archive for the deposit and dissemination of
sci-entific research documents, whether they are
pub-lished or not. The documents may come from
teaching and research institutions in France or
abroad, or from public or private research centers.
L’archive ouverte pluridisciplinaire HAL, est
destinée au dépôt et à la diffusion de documents
scientifiques de niveau recherche, publiés ou non,
émanant des établissements d’enseignement et de
recherche français ou étrangers, des laboratoires
publics ou privés.
Fine-tuning of chemical and physical polymer surface
modifications by atmospheric pressure post-discharge
plasma and its correlation with adhesion improvement
Lucie Bres, Audrey Sanchot, Bertrand Rives, Nicolas Ghérardi, Nicolas
Naudé, Maëlenn Aufray
To cite this version:
Lucie Bres, Audrey Sanchot, Bertrand Rives, Nicolas Ghérardi, Nicolas Naudé, et al.. Fine-tuning of
chemical and physical polymer surface modifications by atmospheric pressure post-discharge plasma
and its correlation with adhesion improvement. Surface and Coatings Technology, Elsevier, 2019, 362,
pp.388-396. �10.1016/j.surfcoat.2019.01.102�. �hal-02108788�
OATAO is an open access repository that collects the work of Toulouse
researchers and makes it freely available over the web where possible
Any correspondence concerning this service should be sent
to the repository administrator:
tech-oatao@listes-diff.inp-toulouse.fr
This is an author’s version published in:
http://oatao.univ-toulouse.fr/23772
To cite this version:
Bres, Lucie
and Sanchot, Audrey
and Rives, Bertrand and Ghérardi,
Nicolas
and Naudé, Nicolas
and Aufray, Maëlenn
Fine-tuning of
chemical and physical polymer surface modifications by atmospheric pressure
post-discharge plasma and its correlation with adhesion improvement. (2019)
Surface and Coatings Technology, 362. 388-396. ISSN 0257-8972
Fine-tuning of chemical and physical polymer surface modifications by
atmospheric pressure post-discharge plasma and its correlation with
adhesion improvement
Lucie Brès
a,
b, Audrey Sanc
h
ot
a,
b, Bertrand Rives
a, Nicolas Gherar
di
b, Nicolas Naudé
b•
•
,
Maëlenn Aufrar
'IRT Satnt•Exupûy, Toulouse, France
"LAPLACE, Université de Toulouse, CNRS, Toulouse, France
'CJRJMAT, Université de Toulouse, CNRS, INfYf, UPS, 4 allée ÉmUe Monso, BP 44362, 31030 Toulouse, France
ARTICLE INFO ABSTRACT
Keywords:
Three•polnt bendlng test Cross-eut test Adheslon mechanJsms Atmospherlc pressure plasma PEEKmatrlx
Our study focuses on the use of a remote atmospheric pressure plasma process for the improvement of polymer surface reactivity. Indeed, surface activation of carbon-fiber -reinforced polymers that use a poly etheretherketone matrix is required to achieve strong and long-term adhesion of paint on the composite. Emphasis 111,ill be placed on the contribution of gas plasma used on surface modification. We use two techniques to characterize adherence improvement: a qualitative and industrial approach with a cross-eut test and a quantitative approach with a three-point bending test. However, to provide a better understanding of the plasma-induced modifications ttsing air or nitrogen gas, diagnostics of the surface are also necessary. The wettability improvement, chemical surface modifications, and topography are analyzed by using contact angle measurement, X-ray photoelectron spectroscopy, and atomic force microscopy, respectively. The combination of these diagnostics highlights the capability of plasma treatrnent to tune the plasma/surface interactions de pending on gas plasma, which results in improved adhesion.
1. Introduction
The increasingly widespread use of carbon-fiber-reinforced poly mers (CFRPs) in structural engineering can be explained by their low weight coupled with their good mechanical properties [1,2]. Poly
etheretherketone (PEEK) matrix composites are particularly appre ciated in aeronautic applications because of their high thermal stability and chemical resistance, in conjunction with a good ability to withstand high mechanical loads [3]. The literature shows several studies aimed at improving the surface energy of such materials to obtain strong and durable adhesive properties [ 4,5]. In this context, knowledge of adhe sion mechanisms is fundamental for the control of the PEEK CFRP/ coating interface and interphase. This is especially true because these interactions depend on the surface quality and bonding conditions [6].
Nowadays, in industry, surface preparation methods by chemical or mechanical means mostly to combine manual sanding and degreasing. The performance of the implemented method, that is the sanding (with Scotch Brite hand pads), is very operator-dependent because it is a manual process. Moreover, it generates a lot of dust, which can
• Corresponding author.
potentially cause contamination and bad adhesion if it is captured under the painting film. Increasingly strict environmental standards and security constraints have led to the development of new technol ogies for "greener" surface preparation [7]. Atmospheric pressure plasma (APP) processes are particularly promising in this context. From an industrial point of view, one of the strengths of APP for surface preparation, in comparison with mechanical means, is the absence of dust and degradation on a large scale. Furthermore, the process can be partially or fully automated, which introduces robustness and relia bility.
Surface activation with APP processes generally consists of mod ifying the surface free energy or surface reactivity through surface oxidation and chemical grafting [8,9]. Studies have also shown the influence of roughness on the coating wettability after plasma activa tion. These two complementary effects can lead to an increase in ad hesion phenomena at the interface between the coating and composite [10,11]. Sorne processes involving air or nitrogen gas have been shown to be effective ways to irnprove the adhesion properties with a coating (paint, glue, or resin) [12,13].
E-mail address: nicolas.naude@laplace.univ-tlse.fr (N . Naudé).
In this study, we have characterized industrial PEEK composites prior to and after activation with a remote atmospheric pressure cold plasma torch [14]. Two different gas carriers, air and nitrogen, were used to generate the plasma. In addition to adherence tests by cross cutting and three-point bending, the surface modifications were also investigated by using contact angle measurements, X-ray photoelectron spectroscopy (XPS), and atomic force microscopy (AFM).
2. Materials and methods
2.1. Atmospheric pressure plasma setup
The experimental setup consists of an industrial UL-SCAN arc plasma torch supplied by AcXys Technologies©, which is operated at atmospheric pressure. The discharge is obtained by the brea.kdown of the gas flowing between two electrodes. An afterglow region over a few centimeters, namely the post-discharge, as indicated Fig. 1, is created at the outlet of the nozzle, which is directed toward the sample [15]. The post-discharge contains reactive species such as metastables, neutrals, and radicals, but not ionized species [9,16].
The working gas can be either dry (dew point temperature < 3 'C), oil-free (oil residues < 0.01 mg/m3), and compressed filtered air (free
of particles with diameter > 0.1 µm) or compressed nitrogen (99.9998% purity, Air Liquide©). A certain number of process para meters illustrated in Fig. 1 can be tuned by the operator:
- Scan speed of the torch (set at 0.3 mis);
- Gap which is defined as the distance between the plasma equipment
and the substrate (set at 27 mm); - Gas flow rate ranges from 30 to 60 slm. 2.2. Description of sample
Activations with the remote APP system described above are done on an industrial CFRP with a PEEK matrix. This composite material is manufactured in an autoclave with several carbon plies encapsulated between two glass plies. Hence, the top surface is mainly composed of the PEEK matrix. The composite material shows a visually planar sur face, that is slightly rough (Ra= 3.7 :!: 1.2nm) and is around 2 x 10⁻³ m thick. To obtain reproducible initial surfaces before char acterization or activation, samples are manually cleaned three times with moistened wipes of propylene glycol methyl ether (Diestone DLS
Power supply
1 j
230V 501-lz (, lu u
l
(,
Elu1rlci1/ power di!)�Îpate,I in the discharge ' Qfil! :Fig. 1. Schematic representation of the experimental UL-SCAN device.
Table 1
Wettability characteristics of liquids used for contact angle measurements [18). Ali data are expressed in mJ/m2•
Llquld Water Dllodometbane YL 72.8 50.8 21.8 50.8 51 0
wipes from SOCOMORE©). In this study, an extemal polyurethane based coating is applied to untreated and treated PEEK CFRPs. This coating is an industrial paint supplied by Mapaero© that is commonly used on helicopters for protective and aesthetic purposes.
2.3. Wettability measurements
The surface wettability studies by contact angle measurements are carried out by analyzing static sessile drops. A portable dosing instru ment called a Mobile Surface Analyzer, developed by KRUSS© is used.
The polarity of the surface is investigated by using the Owens-Wendt-Rabel-Kaelble (OWRK) theory [17]. The Surface Free Energy (SFE) is expressed by Eq. (1), in which Ys° and y/ are the dispersive and the polar components of the surface tension, respec tively. 0a represents the contact angle of the probing Jiquid, and the subscripts L and S, the liquid and solid phases.
(1) The characteristics of the two reference liquids for the determina tion of the SFE components are presented in Table 1. For each sample, repeatability is checked by analyzing three drops of each liquid at room temperature, 5 s after the deposition of the drop.
2.4. Chemical analysis
Surface chemical analysis limited to 5 nm depth is performed with a Kratos• Nova X-ray photoelectron spectrometer by using a monochro matic Al Ka source. The angle measurement of the analysis is settled at a grazing angle of 0 = 75' (0 is the angle between the source and the photoelectron detector). An area of 1200 µm x 700 µm is irradiated at the center of the sample. The characterization is performed under a vacuum of approximately 10-9Torr. The binding energies of spectra are corrected by using the C=C bond of the Cls pea.k at 284. 7 eV. The standard deviation of the concentration is 0.1 %.
2.5. Topographical analysis
The nanoroughness is characterized with a multimode Nanoscope V microscope (AFM) from Bruker©. Peak Force mode using TESPA probes is selected to scan the surfaces of the composites. The instrument software allows analysis of the topographical images and extraction of two representative pararneters from the image: the nanoroughness
Ra
and the specific surface area S<1r. The former represents the arithmetical mean roughness of the analyzed surface. The latter corresponds to the developed interfacial area ratio. This parameter is expressed as a per centage of the additional surface area induced by the texture relative to the planar definition area. The Ra and Sc1r values are calculated from anaverage of three 5 µm x 5 µm images on three different samples.
2.6. Interface characterization by three-point bending test 2. 6.1. Relevance of the test
Among the wide variety of mechanical tests, three-point bending test according to ISO 14679:1997 [19] presents some advantages in the context of this study. The good repeatability of the results, as a result of the tensile machine, coupled with the numerous types of exploitable information that can be obtained, ma.kes this test useful for a better
1) The slope of the linear part of the curve. Corresponds to the me-chanical response of the entire system (sample with epoxy cube). Stands for the rigidity of the system and, hence, the repeatability of sample fabrication.
2) The drop-in load. Indicates the adherence failure.
3) The Fmax value, the ultimate load before failure initiation.
Considered as an adherence measurement for the coating on the PEEK substrate. We consider that the ultimate load when an ad-hesive failure occurs should be higher than the Fmaxvalue measured for a cohesive failure. In this way, the reported ultimate loads in this study are either equal to (adhesive failure) or lower than or equal to (cohesive failure) the adherence.
2.6.3. Experimental data
Adhesion performance is evaluated by using an INSTRON tensile machine (model 3367) equipped with a three-point bending system and
a 5000 N load sensor (error margin of 0.1%). The distance between supporting pins is 35 mm and the speed of test is 0.5 mm/min. The standard prescribes a distance of 33 mm; however, the machine used has a large bending radius that makes it impossible to carry out tests with this distance. The maximum tensile strength value of each inter-face (recorded with BLUEHILL software) is calculated from the average of eight specimens.
2.7. Interface characterization by cross-cut test
Adhesion performances are also evaluated in the widespread in-dustrial way and in accordance with the ISO 2409:2013 standard [21] by using a semi-automated 430 PI cross-cut tester, developed by Erichsen©. Different setting parameters allow good repeatability of the experiments. Among them the force (between 6 and 17 N), the speed (1000 mm/min), the number of cuts (6), and the space between them (spaced by 1 mm). The detailed stages of the standardized test can be found in [21].
A visual inspection of the surface state after tape removal and comparison to a “GT table” of results (from the standard) allows us to classify the adhesion of the substrate: from grade 0 (excellent adhesion) to grade 5 (very bad adhesion). For industry specifications, only GT0 and GT1 are accepted.
2.8. Ageing of panels
During water ageing, painted samples are completely immersed in water, in accordance with the ISO 2812-2:2007 standard [22]. A tem-perature of 40 ± 1 °C is sustained by using a Memmert™ V76 climatic chamber. In order to meet the specifications of the aeronautical in-dustries, the water ageing test lasts for seven days. Samples are then dried and stored for 24 h before interface characterization.
3. Results and discussion
3.1. Adhesion according to gas plasma
Fig. 3shows the adherence grades, according to the appendix of the ISO 2409:2013 standard, for non-aged (white areas) and aged (hatched areas) systems as a function of the gas plasma used and the discharge power. Untreated CFRP composites present very bad adherence with the coating, as indicated by the GT5 grade under all conditions. This is in accordance with the fact that the PEEK matrix is usually considered to be quite inert toward coatings [23].
After plasma activation and without the ageing step, the adherence is substantially improved as a grade of GT0 or GT1 is always obtained. Plasma activation improves surface reactivity and, hence, adhesion phenomena. However, no clear distinction is observed in correlation with the gas plasma used or the discharge power. No more precise findings can be made from these initial results. Therefore, we decided to carry out water ageing for seven days to discriminate between the different activation systems.
Hatched bars on theFig. 3clearly show different behaviors between the air (a) and nitrogen (b) treatments after water ageing. In the former case, the adherence decreases and it becomes even worse as the power is increased, until it reaches the GT5 grade, which is similar to that for an untreated substrate. In the latter case, an excellent adherence grade is maintained, which suggests different and more efficient activation mechanisms under nitrogen plasma than under air plasma.
To obtain some additional data in order to understand the interface phenomena, a more specific approach is used: the three-point bending test. Reader can refer to thesection 2.6for technical data.
Fig. 4(a) presents the different types of failure obtained after acti-vation, adhesive or cohesive one, in comparison with an untreated and uncovered substrate.Fig. 4(b) and (c) focused on the initiation location, which is always on one of the small edges of the stiffener, as
0.0 0.1 0.2 0.3 0.4 0.5 0.6 0.7 0.8 0 50 100 150 200 250 300
Fmax= Maximal load
Mechanical response of the system = slope Failure initiation Failure propagation Dmax Displacement (mm) Lo ad (N ) Mechanical response of the substrate
Fig. 2. Information extracted from a load versus displacement curve after a three-point bending test.
understanding of adhesion phenomena [20]. In this latter reference precisely, Genty et al. highlighted the contribution of the three point bending test as a differentiation m eans f or t he a dhesion characteriza-tion. Indeed, this technique has the capacity to get more accurate re-sults compared to an efficient bu t li mited se mi-quantitative adhesion test (see paragraph 2.7). Specific samples are dimensioned and manu-factured according to the standard for the compliance to the three point bending test. They consist of a PEEK composite coated with an in-dustrial polyurethane paint. A cube of an Araldite® epoxy is formed on the paint for the sole purpose of creating a discontinuity in the strains and focusing the failure initiation on one of the small edges of the stiffener. Application of the epoxy is carried out with a 0.5 mL syringe and the curing cycle of the product is 3 h at room temperature followed by 3 h at 60 ± 5 °C. Obviously, the adherence of the epoxy on the coating has to be higher than that of the PEEK CFRP/coating and it is not measured in this study. A tensile strength is applied on the top of the substrate and the response in force is measured. Force/displacement curves are recorded by the equipment software.
2.6.2. Information and results
Qualitative data is obtained through visual inspection of the failure face and the location of the failure itself. Two types of failure are possible: a cohesive one, which is located within one of the parts of the system, and an adhesive one, which is located at the PEEK CFRP/ coating interface [6]. The former reflects the cohesion of the concerned parts, whereas the latter reflects the adherence at the join. Hence, only the maximal load that leads to adhesive failure can help in comparing adherence values among different configurations.
Moreover, quantitative data can be extracted from the load/dis-placement curve (see Fig. 2):
(a)
(b)
GT0 GT1 GT5 GT0 GT1i
GT2 !!! � GT3 .::. GT4�
GT5D
Before ageing �Alter ageing 0 820 900Air plasma power CN)
D
Before ageing�Alter ageing
0 1140 1250
Nitrogen plasma power CN)
1320
1320
Fig. 3. Aclherence grades obtained from cross-eut tests prior to and after water ageing of untreated substrates and substrates activated under (a) air and (b) nitrogen plasmas.
represented by the small arrows in Fig. 4(a). These profiles are achieved after water ageing. Air plasma treated substrates give rise to visual adhesive failure initiation between the PEEK substrate and the coating. After nitrogen plasma treatment, the failure initiation types are both adhesive (between the PEEK substrate and the coating) and cohesive (inside the PEEK matrix). Nevertheless, a larger proportion of adhesive ones is noted.
Fig. 5 presents the evolution of the Fmax values obtained with a
water-aged system after the three-point bending test. It underlines two trends in adherence depending on the plasma gas used. First, under air plasma, a decrease in the value is noted, which is in accordance with the GT grades obtained from the cross-eut test (see Fig. 3). At high discharge power, the Fmax values are close to that obtained without activation. Unlike the air plasma, nitrogen plasma treatment gives rise to better adherence properties with values that are approximately twice as high as that of the untreated substrate. This is also in good agreement with the cross-eut test results obtained after ageing by immersion in water. We note that the measurement uncertainties are of the same order as those seen in the literature [24).
During the seven days of ageing, water molecules, with their small size, can act as plasticizers in the system, which results in a diminution of the mechanical cohesion of the studied system [25). More precisely, this phenomenon could appear at different locations:
Before
coating
Aâliesive
initiation
î
Cohesive
initiation
10mm(a) ____________ ____.
Adhesive initiation
Cohesive initiation
Fig. 4. (a) Fracture surfaces of treated substrates after the three-point bending test showing the two types of initiation, (a) aclhesive and (b) cohesive. The location of the initiation is represented by the circles.
- In the PEEK polymer matrix;
- In the coating;
- In the stiffener;
- At the interface between the composite substrate and the coating; or - At the interface between the coating and the stiffener.
The two distinct trends in the maximal Joad according to the gas probably originate from different degrees of surface modification during the plasma treatments. One point to check is that the water
600
Z
500 Cl ëii Î 400 "O 300·�
200 ::E 100 ■ Air!
t
l
□ Nitrogenf
...
Maximal load of!.
....
!
····
f
···
I untreated substrate 800 900 1000 1100 1200 1300 1400 1500 Power(W)Fig. S. Maximal load after ageing, relative to power, in the case of air
■
or nitrogen D plasma treatments. The value before plasma activation is re presented on the figure by the dotted line.ageing done on our final system (the activated and coated PEEK CFRP with the epoxy stiffener) does not influence the measured Fmax values.
Let us not that there is no plasticization of the substrate nor the cube of an Araldite The global properties of the system (rigidity) are main tained and the configurations tested are reproducible. This also con finns that we are correctly measuring the adherence of our PEEK CFRP / coating systems, in cases of both adhesive and cohesive (minimal ad herence) failures.
As highlighted in Fig. 5, the maximal Joad before failure increases after nitrogen plasma treatment up to a power value of about 1300 W, whereas the Fmax value decreases after treatment with air plasma; this suggests that the surface modification and, hence, the quality of ad herence are directly linked to the plasma gas used. At this point, some assumptions can be made with regard to: 1) potential top-surface de gradation under air plasma, which is not a long-range mechanism; and 2) the better adherence observed with nitrogen plasma treatment. In this latter case, it seems that saturation is reached after 1300 W and no more improvement could be obtained.
In order to confirm these two hypotheses and gain further under standing, surface characterizations before the mechanical failure are necessary. Indeed, several studies show the relevance of certain theories in explaining the adhesion between a substrate and a polymer coating [26).
From knowledge of the surface interactions, it is possible to identify and predict adhesion mechanisms between two materials. In the next section, we discuss the hydrophilicity and chemical property enhance ment of the substrate in the context of the wetting [27) and chemical [28) theories, respectively. The surface morphology modifications will then be considered in section 3.3 with regard to the mechanical an choring theory [29).
3.2. Study of the wettability and chemical modifications introduced by plasma activation
The wetting and chemical theories describe adhesion mechanisms through intermolecular (such as Van der Waals interactions) and in teratomic (covalent or ionic) bonds, respectively [27,28).
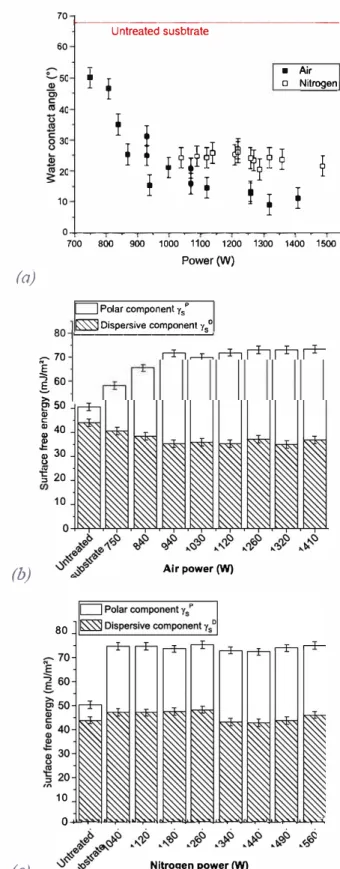
Fig. 6(a) shows a decrease in the Water Contact Angle (WCA, 0w) after both air and nitrogen treatments, with minimal values of around 10• with air plasma and 25• with nitrogen plasma. Nevertheless, the
results with air plasma show a variation in &water according to the
power used; this is not visible with nitrogen plasma From the WCA values, decomposition of the surface free energy is done by using the
(a)
(b)
(c)
70 60 10f--
---
Untreated susbtrate-
-
-
-
-
---
-
-I ■ Air I T □ Nitrogen!
1
j
1 !f �
i
¾Il !
! ! ! ! !
0-+---� 700 800 900 1000 1100 1200 1300 1400 1500 Power(W)D
Polar component 1;� Dispersive component Ys°
80,�---�
f
70§.
60 e, 50 Cl> C: : 40 & 302l '§ 20 10 80 Air power {W) 10 o...,�,.._,>r->,.._,>r->,.._,>r->...,..,..,_,�,..,_,...,.,,.,..-,'-.>C\-.>..1....,.,..,..., Nitrogen power {W)Fig. 6. (a) Water contact angles and surface free energies after (b) air or (c) nitrogen treatment relative to the plasma power.
OWRK model. Fig. 6(b) and (c) reveal the increase in the polar com ponent after plasma treatment. Ali of the observations indicate an in crease in polar groups brought about by plasma activation. However, no significant variation is seen for the dispersive component, which reflects the Van der Waals bonds. This behavior is also described in the literature [30).
The wettability measurements are corroborated by XPS. Table 2
gives the O/C ratio, which corresponds to the oxidation degree of the treated surface, the atomic percentage of nitrogen after plasma treat-ment, and the grafting ratio calculated from the C1s peak. The ratio takes into account contributions of CeO (CeN) at 285.8 eV, C]O
(NeC]O) at 287.2 eV, OeC]O at 288.8 eV, and CO3at 290.0 eV.
From the results inTable 2, air plasma treated surfaces show pro-nounced oxidation, which increases with the power. This is accom-panied by a significant grafting ratio of polar groups, mainly CeO, C] O, and OeC]O. With nitrogen plasma treatment, the oxidation and the grafting ratio both become less significant. These results are in agree-ment with the previous characterization by wettability measureagree-ments. Plasma activation allows the incorporation of oxygen-containing groups, which results in a surface polarity improvement. These ob-servations also constitute additional clues regarding the differences between air and nitrogen plasma effects.
In order to obtain information about the potential top-surface
modifications with air plasma suggested by the results inFig. 5, the intensity of a shake-up is studied from the C1s spectra. Shake-up peaks result from the effect that the sudden creation of the core hole has on the other electrons in the atom. It usually comes from the excitation of plasmons, discrete outer levels, or electrons in the conduction band in metals. Fig. 7 illustrates a decrease in this shake-up for air-treated PEEK, which indicates an opening of the aromatic rings in the PEEK matrix [31]. Let us remember that all measurements are done with a grazing angle such that the results concern a depth of < 5 nm from the surface. Hence, the degradation involves only the first molecular layers without long-range damages.
The XPS characterizations suggest that air plasma treatment is more aggressive than nitrogen treatment and may lead to higher local tem-peratures. In their study, Dupuis et al. also observed an increasing surface oxidation on their PEEK substrates activated with similar re-mote atmospheric pressure plasma [26]. They compared different gas of which air and nitrogen. Even if the tendencies are quite similar, they characterize a greatest degradation of the aromatic rings under nitrogen plasma than under air plasma. It could be arise from the nozzle which present a different shape and treat in a different way (rotary movement in Dupuis's article and linear movement with AcXys equipment).
Table 3summarizes the phenomena occurring with air and nitrogen plasma treatment. Additional experiments were carried out to see the influence of the plasma treatment on topography modifications.
O/C ratio % N Grafting ratio from C1s peaka
Untreated substrate 0.16 0.3 0 Air plasma 820 W 0.35 1 21.7 960 W 0.4 1 28.5 1320 W 0.46 1 31.7 Nitrogen plasma 1150 W 0.28 1.3 14.7 1250 W 0.32 1.6 16.8 1320 W 0.31 1.3 16.1
a Sum of the four contribution concentrations related to grafting: CeO
(CeN), C]O (NeC]O), OeC]O, and CO3.
Fig. 7. Superposition of the C1s peak from an untreated substrate, an air plasma treated substrate, and a nitrogen plasma treated substrate. Contributions of C]C, CeOeC, and shake-up components from the PEEK matrix and CeO, C]O, and OeC]O components from grafting are indicated.
Table 3
Comparative summary of the phenomena occurring with air and nitrogen plasma treatment.
Air plasma Nitrogen plasma
Fmaxafter ageing ↘ ↗
Effect of ageing Bad influence No influence
Hydrophilic properties (θw) ↗ up to 10° Good, without variation (∼25°)
O/C ratio (surface oxidation) ↗ up to 0.46 No variation (∼0.3) Shake-up (aromatic ring integrity) ↘ No variation Table 2
Chemical composition of untreated and treated substrates relative to plasma power. The results indicate greater surface oxidation with air plasma. Measurements are done with a grazing angle of 75°.
3.3. Typical profiles obtained after plasma activation according to gas plasma
The nanoroughness is characterized by AFM in Peak Force mode. The results for substrates without treatment, after air plasma treatment, and after nitrogen plasma treatment are presented inFig. 8.
Nitrogen plasma treatment gives rise to a very specific profile, with nanopeaks of around 20–30 nm height, as observed in Fig. 8(c). This configuration, which presents numerous anchors, should favor adhe-sion [32]. This nanoroughness is not visible in the sample treated with air plasma, the profile of which is very similar to that of an untreated substrate, whatever the discharge power (Fig. 8(b)).
In order to quantify this profile evolution under air and nitrogen plasma, the two parameters described in the Materials and Methods section were measured from the AFM images.Fig. 9(a) and (b) illustrate the variation in Raand Sdrvalues, respectively, relative to those of an untreated substrate. Although the topography image inFig. 8(c) pre-sents a typical profile after nitrogen plasma treatment, Fig. 9(a) in-dicates a slight increase in the nanoroughness [32]. No significant variation is visible with the air plasma treatment, in accordance with the AFM images that is very similar to the reference one. The results support the hypothesis that air plasma treatment provides mostly che-mical modifications. If the use of the Ravalue does not provide enough evidence to draw conclusions about the nitrogen plasma effect, the developed interfacial area ratio Sdr, which corresponds to the specific surface of the samples, does highlight differences between the gases.
Indeed, its increase under nitrogen plasma is about 3%, compared to < 0.5% under air plasma. This behavior is directly linked to an in-crease in anchors per unit area and could explain the very efficient adhesion observed in this study.
Öteyaka et al. [33] also observed somewhat hydrophilic nodules that coalesced together after plasma treatment of a polyethylene ter-ephthalate polymer. They attributed this phenomenon to thermoplastic chain scissions as a result of the energetic species of the plasma. It could be that, in our case, the reactive species from nitrogen post-discharge have a more significant energy than the species from air post-discharge and act like a chemical etching tool. When the plasma torch is quite far from the sample (45 mm), other observations not presented here have shown smooth profiles, in the same way as profiles obtained under air plasma. This can be explained by the fact that nitrogen post-discharge in an air environment induces an increasingly homogeneous mixture further away from the outlet of the nozzle [34]. Fewer nitrogen reactive species are contained in the discharge and an ambient air post-discharge is favored.
One way to support this assumption is to measure the diiodo-methane contact angle (DCA), which is a value that is well-known to be linked to the quantity of anchors per unit surface area [35].Fig. 10
represents the DCA values measured after nitrogen plasma activation
relative to the Sdr values calculated from the AFM images. The
(b) Air
1320W
(a) Untreated
substrate
(c) Nitrogen
1180W
Fig. 8. AFM images (5 μm × 5 μm) of (a) an untreated PEEK substrate, (b) an air plasma treated sample at 1320 W, and (c) a nitrogen plasma treated sample at 1180 W.
(a)
(b)
Fig. 9. (a) Nanoroughness and (b) specific surface evolution data obtained by AFM in Peak Force mode, relative to gas and plasma power. Values before plasma activation are represented by the continuous line.
comparison leads to a proportional relationship with an R2value equal
to 0.9. The increase in specific surface is negatively correlated with the DCA. This indicates a larger anchoring surface, which would improve adhesion phenomena with the future coating by using nitrogen treat-ment.
4. Conclusion
In this study, various characterization methods were used to iden-tify surface modifications and characterize durable adhesion improve-ments. The cross-cut test is a widespread industrial test that allows validation, or not, of the adhesion of a sample. Nevertheless, this ap-proach is insufficient to provide a deeper understanding of the adhesion mechanisms happening at the interface. To this end, three-point bending tests were carried out. This complementary technique is finer and gives both quantitative and qualitative data that can be corrobo-rated with the cross-cut test results.
The nature of the plasma gas has an obvious impact on surface modification. Air plasma treatment has been shown to be relatively aggressive, especially for the first molecular layers at high power. It induces surface oxidation. On the other hand, nitrogen plasma treat-ment leads to a radical surface nanoroughness modification, with the creation of new anchoring points.
By referring to the literature and the different adhesion theories, the following gas-related behaviors were revealed:
- As highlighted by WCA measurements and XPS, air plasma treat-ment mostly gives rise to physico-chemical and chemical modifica-tions. Hydrophilicity explains the good initial adhesion but the low specific surface could be responsible for ageing degradation. - AFM images correlated with diiodomethane contact angle
mea-surements underline the capacity of nitrogen plasma treatment to modify the physical properties of the substrate surface. Nevertheless, only a combination of mechanical anchoring and hy-drophilicity can explain the durable adhesion.
Finally, this paper is an example of a global approach using com-plementary techniques. With this approach, it is possible to obtain ro-bust conclusions concerning improvements in adhesion phenomena after plasma treatment.
Acknowledgements
The authors gratefully acknowledge the IRT Saint-Exupery Surfinnov project partners, especially Airbus Helicopters company, for the financial support.
References
[1] C. Soutis, Carbon fiber reinforced plastics in aircraft construction, Mater. Sci. Eng. A 412 (1–2) (2005) 171–176.
[2] M. Sharma, S. Gao, E. Mäder, H. Sharma, L. Yew Wei, J. Bijwe, Carbon fiber sur-faces and composite interphases, Compos. Sci. Technol. 102 (2014) 35–50. [3] A.A. Collyer, High-temperature engineering thermoplastics, A Practical Guide to the
Selection of High-Temperature Engineering Thermoplastics, Elsevier, Oxford, England, 1990.
[4] B.R.K. Blackman, A.J. Kinloch, J.F. Watts, The plasma treatment of thermoplastic fibre composites for adhesive bonding, Composites 25 (5) (1994) 332–341. [5] A. Ganesan, M. Yamada, M. Fukumoto, The effect of CFRP surface treatment on the
splat morphology and coating adhesion strength, J. Therm. Spray Technol. 23 (1–2) (2013) 236–244.
[6] L.F.M. DaSilva, A. Öchsner, R.D. Adams (Eds.), Handbook of Adhesion Technology, Spinger-Verlag Berlin Heidelberg, Berlin, 2011.
[7] Règlement n°1907/2006 - Ministère du Travail, de la Solidarité et de la Fonction Publique, REACH: Registration, Evaluation and Authorization of CHemicals, (2007).
[8] A. Baalmann, K.D. Vissing, E. Born, A. Gross, Surface treatment of poly-etheretherketone (PEEK) composites by plasma activation, J. Adhes. 46 (1–4) (1994) 57–66.
[9] J. Muñoz, J.A. Bravo, M.D. Calzada, Aluminum metal surface cleaning and acti-vation by atmospheric-pressure remote plasma, Appl. Surf. Sci. 407 (2017) 72–81. [10] S.J. Hitchcock, N.T. Carroll, M.G. Nicholas, Some effects of substrate roughness on
wettability, J. Mater. Sci. 16 (3) (1981) 714–732.
[11] Q. Bénard, M. Fois, M. Grisel, Peel ply surface treatment for composite assemblies: chemistry and morphology effects, Compos. A: Appl. Sci. Manuf. 36 (11) (2005) 1562–1568.
[12] P. B, J. Comyn, L. Mascia, G. Xiao, Plasma-treatment of polyetheretherketone (PEEK) for adhesive bonding, Int. J. Adhes. Adhes. 16 (2) (1996) 97–104. [13] E. Occhiello, M. Morra, G.L. Guerrini, F. Garbassi, Adhesion properties of
plasma-treated carbon/PEEK composites, Composites 23 (3) (1992) 193–200. [14] UL - SCAN Equipement CLE EN MAIN, AcXys Technologies, (2017) [Online].
Availablehttps://www.acxys.com/fr/products/turnkey-equipments/ul-scan.html, Accessed date: 1 September 2017.
[15] F. Fanelli, F. Fracassi, Atmospheric pressure non-equilibrium plasma jet technology: general features, specificities and applications in surface processing of materials, Surf. Coat. Technol. 322 (2017) 174–201.
[16] A.J. Yáñez-Pacios, J.M. Martín-Martínez, Surface modification and improved ad-hesion of wood-plastic composites (WPCs) made with different polymers by treat-ment with atmospheric pressure rotating plasma jet, Int. J. Adhes. Adhes. 77 (2017) 204–213 no. April.
[17] D.K. Owens, R.C. Wendt, Estimation of the surface free energy of polymers, J. Appl. Polym. Sci. 13 (8) (1969) 1741–1747.
[18] C.J. Van Oss, Interfacial Forces in Aqueous Media, 2nd edition, Londres, 2006. [19] AFNOR, ISO 14679, Adhésifs – Détermination des Caractéristiques D'adhésion Par
Une Méthode de Flexion à Trois Points, (1997).
[20] S. Genty, J. Sauvage, P. Tingaut, M. Aufray, Experimental and statistical study of three adherence tests for an epoxy-amine/aluminum alloy system: pull-off, single lap joint and three-point bending tests, Int. J. Adhes. Adhes. 79 (2017) 50–58. [21] AFNOR EN ISO 2409, Peintures et Vernis - Essai de Quadrillage, (2013). [22] AFNOR NF EN ISO 2812-2, Peintures et Vernis - Détermination de la Résistance Aux
Liquides. Partie 2: Méthode par Immersion Dans l'eau, (2017).
[23] S. Jha, et al., Experimental investigation into the effect of adhesion properties of PEEK modified by atmospheric pressure plasma and low pressure plasma, J. Appl. Polym. Sci. 118 (2010) 173–179.
[24] J.-B. Sauvage, M. Aufray, J.-P. Jeandrau, P. Chalandon, D. Poquillon, M. Nardin, Using the 3-point bending method to study failure initiation in epoxide-aluminum joints, Int. J. Adhes. Adhes. 75 (2017) 181–189.
[25] M. Gigliotti, J.-C. Grandidier, M.C. Lafarie-frenot, Vieillissement de matériaux composites à matrice organique - Cas d'études, Techniques de L'ingénieur, AM5323, 2014.
[26] A. Dupuis, et al., Improving adhesion of powder coating on PEEK composite: in-fluence of atmospheric plasma parameters, Appl. Surf. Sci. 357 (2015) 1196–1204. [27] H. Schonhorn, L. Sharpe, Thermodynamic adhesion, Chem. Eng. News 41 (15)
(1963) 67–88.
[28] S. Buchan, W. Rae, Chemical nature of the rubber to glass bond, Trans. Inst. Rubb. Ind. 20 (1946) 205–216.
[29] J. Mac Bain, D. Hopkins, On adhesives and adhesive action, J. Phys. Chem. 29 (2) (1926) 188–204.
[30] N. Encinas, B. Díaz-Benito, J. Abenojar, M.A. Martínez, Extreme durability of wettability changes on polyolefin surfaces by atmospheric pressure plasma torch, Surf. Coat. Technol. 205 (2010) 396–402.
[31] E. Gonzalez, M.D. Barankin, P.C. Guschl, R.F. Hicks, Ring opening of aromatic Fig. 10. Relationship between the specific surface (as a percentage of increase
relative to an untreated surface) and the diiodomethane contact angle after nitrogen plasma treatment with different power and gaps. R2= 0.90.
polymers by remote atmospheric-pressure plasma, IEEE Trans. Plasma Sci. 37 (6) (2009) 823–831.
[32] K. Gotoh, Y. Kobayashi, A. Yasukawa, Y. Ishigami, Surface modification of PET films by atmospheric pressure plasma exposure with three reactive gas sources, Colloid Polym. Sci. 290 (11) (2012) 1005–1014.
[33] M.O. Oteyaka, P. Chevallier, S. Turgeon, L. Robitaille, G. Laroche, Low pressure radio frequency ammonia plasma surface modification on poly(ethylene
[34] E. Pfender, J. Fincke, R. Spores, Entrainment of cold gas into thermal plasma jets, Plasma Chem. Plasma Process. 11 (4) (1991) 529–543.
[35] C.J. Van Oss, R.J. Good, M.K. Chaudhury, Additive and nonadditive surface tension components and the interpretation of contact angles, Langmuir 4 (4) (1988) 884–891.
terephthalate) films and fibers: effect of the polymer forming process, Plasma Chem. Plasma Process. 32 (2012) 17–33.