HAL Id: tel-02948183
https://tel.archives-ouvertes.fr/tel-02948183
Submitted on 24 Sep 2020HAL is a multi-disciplinary open access archive for the deposit and dissemination of sci-entific research documents, whether they are pub-lished or not. The documents may come from teaching and research institutions in France or abroad, or from public or private research centers.
L’archive ouverte pluridisciplinaire HAL, est destinée au dépôt et à la diffusion de documents scientifiques de niveau recherche, publiés ou non, émanant des établissements d’enseignement et de recherche français ou étrangers, des laboratoires publics ou privés.
Durabilité des élastomères thermoplastiques pour
applications marines
Antoine Bardin
To cite this version:
Antoine Bardin. Durabilité des élastomères thermoplastiques pour applications marines. Matériaux. HESAM Université, 2020. Français. �NNT : 2020HESAE004�. �tel-02948183�
Arts et Métiers - Campus de Paris Laboratoire PIMM
École doctorale n° 432 : Sciences des Métiers de l’Ingénieur
Doctorat
T H È S E
pour obtenir le grade de docteur délivré par
l’École Nationale Supérieure d'Arts et Métiers
Spécialité “ Mécanique – Matériaux ”
présentée et soutenue publiquement parAntoine BARDIN
le 6 février 2020Durability of Thermoplastic Elastomers
for Marine Applications
Directeur de thèse : Bruno FAYOLLE Co-encadrement de thèse : Pierre-Yves LE GAC
T
E
Jury
M. Pierre-Antoine ALBOUY, Directeur de Recherche CNRS, lab. LPS, Université Paris-Sud Président
M. Laurent CHAZEAU, Professeur, lab. MATEIS, INSA de Lyon Rapporteur
M. François-Xavier PERRIN, Professeur, lab. MAPIEM, Université de Toulon Rapporteur
Mme Agathe ROBISSON, Professeure, Université Technologique de Vienne Examinatrice
M. Bruno FAYOLLE, Professeur, lab. PIMM, Arts et Métiers Paris Examinateur
M. Pierre-Yves LE GAC, Docteur, IFREMER Examinateur
M. Hervé BINDI, Ingénieur, Thales DMS Invité
M. Gérard ROUX, Ingénieur, Thales DMS Invité
T
H
È
S
E
3
Nous sommes la nature qu’on défonce. Nous sommes la terre qui coule, juste avant qu’elle s’enfonce. Nous sommes le cancer de l’air et des eaux, des sols, des sèves et des sangs. Nous sommes la pire chose qui soit arrivée au vivant. OK. Et Maintenant ? Maintenant, la seule croissance que nous supporterons sera celle des arbres et des enfants. Maintenant nous serons la nature qui se défend. Les furtifs – Alain Damasio
Lorsque tu fais quelque chose, sache que tu auras contre toi ceux qui voudraient faire la même chose, ceux qui voudraient le contraire et l’immense majorité de ceux qui ne voulaient rien faire. Confucius
5
Remerciements
J’entamerai cet exercice de remerciements ô combien scruté par rappeler que cette thèse s’est articulée entre trois organismes, le laboratoire CSM de l’Ifremer Brest, le laboratoire PIMM de l’ENSAM Paris et Thales DMS Sophia-Antipolis, qui m’ont tous accueilli chaleureusement.
Mes premiers remerciements personnels, sûrement les plus importants, s’adressent à mes deux directeurs de thèse, Pierre-Yves Le Gac et Bruno Fayolle. Messieurs, je vous dois beaucoup. Merci pour votre soutien permanent, votre rigueur, votre disponibilité, vos connaissances pointues et bien d’autres choses encore. J’ai pris beaucoup de plaisir à travailler avec vous, ce qui a son importance, je crois, car c’est un critère de réussite majeur de tout projet. Vous avez formé, par vos approches parfois divergentes mais toujours complémentaires, une équipe encadrante formidable.
J’exprime ma gratitude à Thales et notamment à Gérard Roux et Hervé Bindi pour votre confiance et la liberté que vous m’avez accordée durant ces 3 années.
Ces travaux ont été évalués par un jury composé de Pierre-Antoine Albouy, Laurent Chazeau, François-Xavier Perrin et Agathe Robisson. Je tiens à vous remercier pour le temps que vous y avez accordé et pour la pertinence de vos remarques. J’adresse un remerciement tout particulier à Pierre-Antoine, qui m’a accueilli dans son laboratoire et grâce à qui cette étude de la SIC dans les TPEs, présentée dans le chapitre 5 de ce manuscrit, a été possible.
Je souhaite exprimer ma reconnaissance à toutes les personnes qui ont pu m’aider, de près ou de loin, chacune à leur manière, à la réalisation de ces travaux : Maëlenn et Peter pour vos conseils, votre disponibilité et votre gentillesse, Mick et Nico pour toutes les réponses à mes questions pratiques, Paulo pour l’injection des plaques, Sylvie pour ton œil avisé concernant
6
le Pebax, Matthieu pour les analyses GPC et leur interprétation, Vincent Michel pour les essais DRX, Vincent Deret qui, à travers ton stage, a permis la continuité des essais à Brest durant ma période parisienne, ainsi que Sébastien Rolland, Emmanuel Richaud, Nicolas Dumergue, Benoit Bigourdan. Merci aussi au « labo d’à côté », à Brest, et notamment à Maria qui m’a apporté son aide.
Cette expérience n’aurait évidemment pas été la même si elle n’avait pas été partagée avec les équipes brestoise et parisienne de doctorants (et postdoc, Pierre je ne t’oublie pas). Un grand merci à tous ceux qui m’ont précédé et m’auront montré la voie : Maxime, Clément, Tatiana, Corentin H., Alin et Mael. Salutations à mes collègues de promo, Eeva, Antoine LGG, Cédric et Gabriel, félicitations à vous ! Et bonne chance à ceux qui viennent : Quentin, Alban, Romain LLB., Gauthier, Hajar, Corentin LE, Romain D., Antoine-Emmanuel, Fred, Antoine D., Anne… Une petite dédicace spéciale au bureau H4.2.10, alias placard à balais ou bureau 9 ¾, qui m’aura accueilli comme il se doit, petit provincial apeuré que j’étais. Merci à vous tous, d’avoir égayé ces trois années au boulot et en dehors, à travers nos discussions constructives (ou pas).
J’ai également une pensée particulière à tous ceux qui m’ont accueilli chez eux durant mes nombreux allers-retours entre Brest et Paris : Antoine M., Eeva & Martin, Alban, Marie & Anna, ainsi que les Froymonds. Travailler entre deux laboratoires distants de 500 km n’est pas chose simple. Que cela soit sur un matelas gonflable, dans un canapé ou sur un lit digne de ce nom, votre accueil m’a permis de ne pas hésiter à faire les déplacements quand ils étaient nécessaires, m’accordant une précieuse souplesse dans l’organisation de mon temps. J’espère avoir été un squatteur sympathique.
7
Merci aux potes aussi, des Maries & Co. notamment, puisqu’il est indispensable de pouvoir se vider la tête de temps en temps pour continuer à avancer. Merci à toute ma famille de m’avoir soutenu tout au long de cette expérience.
A tous ceux que j’ai pu oublier, pardonnez-moi, mes capacités mémorielles ont été fortement éprouvées ces derniers mois. Si vous le souhaitez j’essaierai de vous glisser dans la prochaine version de ce document (v137 si je ne me trompe).
Je consacre enfin ces derniers mots à Lidivine. Tu auras contribué à ce que cette thèse s’achève avec sérénité. Merci de m’avoir accompagné, ainsi que pour tout le reste.
9
Table of Contents
Introduction ... 13
Durability of thermoplastic elastomers in marine environment ... 17
1.1 Thermoplastic Elastomers ... 18
1.1.1 Structure and morphology ... 18
1.1.2 Mechanical properties ... 22
1.1.3 Strain-induced crystallisation ... 27
1.2 Marine ageing of thermoplastic elastomers ... 31
1.2.1 Water absorption ... 31
1.2.2 Chemical ageing ... 32
1.2.3 Structure-property relationships ... 36
1.3 Strategic approach ... 39
Materials and Methods ... 41
2.1 Materials ... 42
2.2 Methods ... 44
2.2.1 Injection processing ... 44
2.2.2 Thermal treatment ... 44
2.2.3 Seawater and air ageing ... 44
2.2.4 Water uptake measurements ... 45
10
2.2.6 Nuclear Magnetic Resonance (NMR) ... 45
2.2.7 Differential Scanning Calorimetry (DSC) ... 46
2.2.8 Fourier-transform infrared (FTIR) spectroscopy ... 46
2.2.9 X-ray Diffraction (XRD) ... 46
2.2.10 Uniaxial tensile test ... 47
2.2.11 Cracking testing and Essential work of fracture (EWF) concept ... 48
Modelling of the hydrolytic degradation of TPEs ... 49
3.1 Water absorption ... 50
3.1.1 Initial water uptake properties ... 50
3.1.2 Effect of ageing on water content ... 52
3.2 Identification of hydrolytic degradation mechanisms ... 53
3.2.1 Chemical structure change ... 53
3.2.2 Macromolecular structure change ... 54
3.3 Modelling ... 57
3.3.1 Model development ... 57
3.3.2 Initial conditions ... 60
3.3.3 Kinetic parameters determination ... 60
3.3.4 Temperature dependence ... 62
3.3.5 Scissions prediction ... 63
Structure-property relationships in thermoplastic elastomers ... 65
11
4.1.1 Scission mechanism caused by seawater and air... 68
4.1.2 Effect of temperature on scissions kinetics ... 72
4.2 Mechanical properties change ... 73
4.2.1 Uniaxial tension ... 73
4.2.2 Effect of temperature on tensile properties change kinetics ... 75
4.2.3 Essential work of fracture ... 76
4.3 Structure-property relationships ... 81
4.4 Conclusion ... 87
Strain-induced crystallisation in thermoplastic elastomers ... 89
5.1 Experimental device ... 90
5.2 Static XRD analyses ... 92
5.3 In situ XRD during tensile testing ... 94
5.3.1 2D X-ray pattern analysis ... 94
5.3.2 In situ X-ray data processing ... 97
5.3.3 In situ X-ray results ... 99
5.3.4 Effect of ageing ... 101
Conclusion and prospects ... 107
References ... 113
Annexes ... 121
13
Introduction
The concept of thermoplastic elastomers (TPEs) first appeared in the 1960s, which makes it a relatively new polymer family. TPEs originality is to present a thermoplastic structure and to exhibit elastomeric mechanical properties. They are commonly categorized between the conventional thermoplastic polymers and thermoset elastomers. The interest for TPEs is currently growing, particularly to replace thermoset elastomers. This new material is significantly easier to synthesize and manufacture. It also requires less harmful chemicals compared to some rubbers. This last aspect is of interest today, in the context of increasing restrictions towards the chemical risks in industries. This is particularly the case in Europe, with the recently adopted REACH regulation aiming to improve the protection of human health and environment [1]. It covers all chemical substances, including those used in industrial processes. The use of most harmful chemicals, for which associated risks cannot be managed, will eventually be restricted or even forbidden. This regulation impacts all European chemical industries. The composition of rubbers contains only about 30 %w of polymer, the
rest being additives, such as fillers, plasticizers, crosslinking agent (sulphur or peroxide), catalysts and others (moulding agent, stabilizer, anti-UV/oxygen/combustion agents...). Additives put aside, the very nature of the polymer may also be an issue. Among others, vulcanization agents, catalysts or chlorine-based rubbers are considered as potential carcinogen and mutagen [2], and their use is expected to be restricted. In this context, TPEs represent a potential alternative, presenting similar mechanical properties and lower associated chemical risks. The manufacturing process is also significantly easier compared to thermoset elastomer for which the crosslinking process, in particular, requires an accurate control of temperature cycle. In contrast, well known thermoplastic process techniques, such as injection moulding or extrusion, can be used for TPEs. Thanks to their thermoplastic nature, they also
14
have the ability to be recycled. Although TPEs production volume is still inferior to conventional thermoplastic polymers or rubbers, their growth rate is higher [3], which is proof of the current strong interest in these materials. The automotive sector is the major TPEs consumer, with 40 % of the world production. Thanks to their versatility, TPEs are used in versatile domains: medical devices (implants, catheters), cables or hoses, ski boots, seals, films or membranes...
Polymers are frequently used on marine structures, for various applications, such as protective coating for example [4, 5]. In particular, thermoset elastomers are employed as protective panels or seals [6]. Thales naval branch, which designs acoustic and communication systems and subsystems, especially uses these materials. The marine environment, gathering water, air and UV radiation, is known to be very aggressive towards polymers. Therefore, it is essential to understand and control material properties change when exposed to such an environment, when targeted materials lifetime is around 30 years. Thermoset elastomers have been widely studied for more than 170 years, since the discovery of the vulcanization of natural rubber by Charles Goodyear in 1842. Their main interest resides in their unique elastic properties, as well as good chemical resistance required for marine applications. On the other hand, the durability of thermoplastic elastomers in a marine environment remains mostly unknown. In order to determine the possibility for these materials to be used in mid- to long-term application in marine environment, it is beforehand necessary to assess their behaviour in such an environment. This matter is addressed in this work.
Thermoplastic elastomers are commonly categorized in between conventional thermoplastic polymers and thermoset elastomers, but the distinction is not always clear. Considering that both families have been extensively studied, and that their behaviour is rather well known today, is it possible to use the existing laws from one family or the other to describe the TPEs
15
behaviour? Or do they rather tend to represent a specific new polymer group, with its own characteristics? This is the kind of question we tried to answer throughout this thesis. In that matter, TPEs of different natures have been selected for this study, enabling to assess their respective weathering resistance. Durability was assessed through accelerated ageing, in air and seawater, at different temperatures. The first objective was to apprehend the behaviour of TPEs during ageing and to identify the degradation mechanisms involved. Hydrolytic and oxidative degradation processes are known to affect polymers structure through two mechanisms, chain scission and crosslinking. Macromolecular structure change was assessed, particularly with molar mass measurements which is very sensitive to scission and crosslinking events. Based on the data collected, a hydrolytic kinetic model was developed, predicting structural change in TPE during immersion. This matter is addressed in Chapter 3. Mechanical properties change was assessed with uniaxial tensile testing and cracking testing. TPEs embrittlement behaviour, as well as structure-property relationships, are the subjects of Chapter 4. Finally, Chapter 5 focuses on the investigation of the strain-induced crystallisation (SIC) phenomenon in TPEs. More specifically, we will investigate the effect of ageing on the SIC, which will enable to assess its contribution to failure properties considered in Chapter 4.
17
Durability of thermoplastic elastomers in marine environment
Table of contents
1.1Thermoplastic Elastomers ... 18
1.1.1 Structure and morphology ... 18
1.1.2 Mechanical properties ... 22
1.1.3 Strain-induced crystallisation ... 27
1.2 Marine ageing of thermoplastic elastomers ... 31
1.2.1 Water absorption ... 31
1.2.2 Chemical ageing ... 32
1.2.3 Structure-property relationships ... 36
18
This first chapter is dedicated to a bibliographical review of the thermoplastic elastomer (TPEs) behaviour in a marine environment. First, a general presentation of TPEs is made, broadly describing their structural and mechanical properties. Second, different aspects of marine ageing are introduced, such as physical and chemical degradation resulting from air or water exposure. Finally, the strategic approach considered throughout this thesis is presented, with an overview of the different chapters.
1.1 Thermoplastic Elastomers
1.1.1 Structure and morphologyStudied TPEs are segmented block copolymers, made up of alternative soft and hard blocks covalently bonded and forming linear macromolecular chains. Within the service temperature range, soft segments remain amorphous and rubbery, while hard segments are below their glass-transition temperature (Tg). TPEs properties are easily tailored according to the hard/soft
blocks ratio, among other parameters. They present unique properties, particularly filling the gap between conventional thermoplastic polymers and rubbers. For instance, the first polyamide-based TPEs were developed with the purpose to propose soft polyamide grades. There is, in fact, no sharp mechanical properties change between TPEs and the corresponding hard block homopolymer. Elastomeric properties are then obtained with high soft block content. Unlike thermoset elastomers, TPEs are not chemically crosslinked. The inter-chains link takes a physical form for these materials. Hard blocks are actually made up of highly polar groups, such as amide, urethane or ester, which induces H-bond formation or even some crystallinity between hard blocks. Also, soft and hard blocks naturally segregate due to their thermodynamic incompatibility. All these phenomenon lead to the formation of discrete hard phases, where macromolecules interconnect, dispersed in a soft matrix. Thus, these hard
19
domains ensure the function of physical crosslinking in TPEs. In our case, two of the most common TPE families were studied:
- urethane-based copolymer, called thermoplastic polyurethane (TPU); - amide-based copolymer, or poly(ether-block-amide) (PEBA).
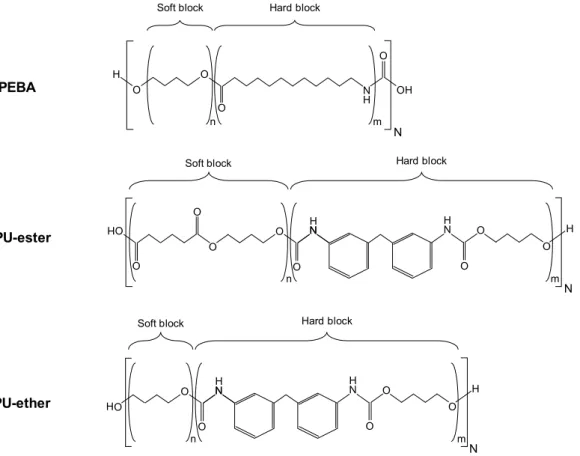
TPUs are made up of three raw components: a diisocyanate, a short-chain diol (also called chain extender) and a long-chain diol. The diisocyanate forms a hard block with the chain extender, while the long-chain-diol is the soft block (Figure 1-1). The reaction of an isocyanate with an alcohol produces a urethane. Aromatic diisocyanate, such as 4,4'-methylene diphenyl diisocyanate (MDI), are broadly used. Common soft blocks are polyester or polyether. One- or two-step polyaddition are used for TPU synthesis [7]. PEBAs are composed of polyether soft blocks and polyamides hard blocks (Figure 1-1). They are synthesized through polycondensation of carboxylic acid-terminated polyamide with alcohol-terminated polyether [8]. The reaction between carboxylic acid and alcohol end functions produces an ester group at each soft block - hard block link. PEBAs with different polyamide (PA6, PA11, PA12) and different polyether (PTMO, PEO) are commercialized.
Figure 1-1 - Schematic representation of TPU and PEBA structures
amide monomer
ester
group polyether
hard block soft block
diisocyanateurethane Chain extender
group
macrodiol
hard block soft block
PEBA TPU
20
TPEs present a multiphase morphology, with a hard phase, a soft phase and an interphase. In TPEs, the elastomeric properties are induced by a high soft block content, resulting in hard micro- or nano-domains dispersed in a soft matrix [8, 9]. Figure 1-2 gives a schematic representation of TPEs morphology. It is reported that this morphology and associated elastomeric properties are obtained for a soft block content above 60 % [10, 11]. Above 85 %, the elastomeric properties are lost, as hard blocks completely dissolve in the matrix and do not form hard phases. Overall, TPEs have a three-dimensional molecular network relatively similar to thermoset elastomers, consisting of long rubbery chains inter-linked with hard domains. From a morphological point of view, the main differences between the two elastomer families are the nature of the crosslinking and the fact that TPEs are multiphasic while thermosets are monophasic.
Figure 1-2 - Schematic representation of a typical TPE morphology.
Several mechanisms govern TPEs phase separation. Insolubility between soft and hard blocks, inherent to their distinct chemical structure, is one of them. This incompatibility drives the soft and hard blocks to segregate into separate phases (Figure 1-3). It is greatly promoted by the presence of highly polar groups in hard blocks, such as amide, urethane, urea or imide. The hard block polarity, combined with the low soft block polarity, induce a high affinity between hard blocks [12, 13]. H-bonding was reported to play a major role in the phase separation process and to significantly contribute to the hard domains cohesion [10, 14–16].
100 nm hard block
soft block hard phase
21
Figure 1-3 – Characteristic block copolymer morphology, depending on the amount of each constituent [17]. Depending on their nature, hard blocks may also crystallise. This crystallinity remains quite low, only reaching a few percent at most. Like the insolubility-driven process, crystallisation also contributes to the phase separation and to the hard phase cohesion. Polyamide-based thermoplastic elastomers (PEBA) are particularly known to crystallise [8]. It has been observed that PA12 crystallites in PEBA present α or γ phase, similarly to the homopolymer, although more poorly organized [18]. For TPUs, aromatic diisocyanate composing hard blocks inhibit crystallisation due to steric hindrance [13], leading to very low crystallinity content. Aliphatic diisocyanate-based TPUs can show significant crystallinity [19, 20], but are not considered in this work. The hard domains cohesion then largely relies on H-bonding between urethane groups. Nonetheless, the phase separation is not perfect in TPEs, as the covalent bond between hard and soft blocks prevent a perfect segregation. The soft matrix then contains a certain amount of hard blocks [9, 21]. It also leads to the formation of an interphase, at hard domains edge [22, 23]. Many parameters can be adjusted to tailor TPEs properties, which makes them a very versatile polymer family. Hard and soft blocks nature obviously plays an important role. For instance, polyester soft blocks lead to lower phase separation than corresponding TPU with polyether [24, 25]. The diisocyanate aromaticity and symmetry also affect properties [26]. Resistance to chemical ageing, critical in the context of durability in marine environment, is also highly dependent on the polymer nature. This point will be addressed in a following section. The hard block/soft block ratio, as well as blocks size are
22
also a major parameter governing TPEs properties. Increasing the hard block content leads to higher H-bonding and crystallinity [27], also inducing higher phase separation. Overall, four parameters influence TPEs structure: block nature, hard/soft blocks ratio, block size and molar mass.
1.1.2 Mechanical properties Uniaxial tension
Uniaxial tensile testing is commonly used as a simple and quick method to measure polymer mechanical properties. In this work, tensile curves will be presented as nominal or engineering stress σn = F / S0 as function of elongation λ = L / L0 (F, S0, L and L0 being the load, the initial
sample section, the sample length and the initial sample length, respectively). The overall TPEs mechanical properties depend greatly on the relative amount of soft and hard phases and on the intrinsic properties of each phase [28]. Hard phase properties, in turn, depends on molecular packing, governed by crystallinity and H-bonding density [26, 29]. Figure 1-4 typically shows the effect of hard block content on the PEBA uniaxial tensile behaviour.
Figure 1-4 – Tensile curves of PEBAs with different PA contents [28].
Starting from lower PA content (P2533 grade) exhibiting typical elastomeric behaviour, it progressively shifts to a PA-like behaviour when increasing the PA content. In particular, a
23
yield appears at high PA content. Globally, increasing TPEs hard block content leads the elastic modulus and the stress at break to increase, while it causes elongation at break to decrease (Figure 1-5) [28, 30, 31]. For a given hard/soft blocks molar ratio, increasing the soft block molecular mass leads to an increase in elongation at break and a decrease in modulus [32]. For TPUs, the chain extender nature is also reported to affect mechanical properties. In particular, chain extender with even numbers of -CH2- groups adopt a fully extended
conformation, so H-bonding and a higher crystallinity order are promoted [32].
Figure 1-5 – Stress at break and elongation at break dependence on hard block content for a polyether-based TPU [31].
TPEs behaviour in cyclic testing exhibit a significant inelasticity (Figure 1-6). The irreversible change in the load-unload cycle are generally concentrated on the first unloading cycle, subsequent cycles being less affected. This behaviour is partly due to the plastic flow of hard phases. The permanent set (or hysteresis) was observed to increase with the hard block content [33] or the capacity for hard block to crystallise [29]. Some studies propose that TPEs discrete hard domains may be regarded as reinforcing fillers, which are known to induce inelasticity in
24
thermoset elastomers, such as the Mullins effect [34]. TPEs inelasticity was also attributed to the strain-induced crystallisation (SIC) of soft segments during stretching.
Figure 1-6 – Cyclic tension curve highlighting TPU inelasticity [25].
If stretched high enough, crystallinity may remain after unloading, promoting the permanent set [28]. This crystallinity induced by SIC should not be confused with the hard phase crystallinity, as it concerns the soft segments. Upon heating (around 40 °C), soft block crystallites are reported to melt, and TPE retrieve its elasticity. This phenomenon will be further addressed in a following section.
Essential work of fracture
The essential work of fracture (EWF) concept is used to characterize mechanical behaviour of highly ductile material, for which commonly used KIC and GIC parameters determined with
linear fracture mechanics are inappropriate. In these materials, the total work of fracture is not a material property, but also depends on sample geometry and defects. The method consists in introducing a known defect in a sample, such as a notch, to measure the material intrinsic toughness properties. The concept was first developed in 1975 by Broberg [35] and applied to metals by Cotterell and Reddel [36]. Since, it has been then successfully applied to ductile
25
polymers such as PE and PP [37]. Several EWF application to TPEs also exist [38, 39]. This concept relies on the distinction of two plastic deformation sub-areas (Figure 1-7):
- a process zone, where the cracking occurs;
- an outer plastic deformation zone, around the process zone.
Figure 1-7 – Schematic representation of DDENT specimen.
The total work of fracture (Wf) can then be separated into two components, corresponding to
each zone respectively (Eq. 1-1). The essential work of fracture (We), corresponding to the
process zone, is related to the energy required to create new surfaces during cracking. The non-essential work of fracture (Wp) is related to plastic deformation in the outer zone, not
directly contributing to cracking.
𝑊 = 𝑊 + 𝑊 Eq. 1-1
Wf is experimentally determined as the area under the load (P)-displacement (U) curve. In our
case, tests were performed on deep double edge notched tensile (DDENT) specimen, as shown in Figure 1-7. Notches are adjusted to obtain the desired ligament length (l). Eq. 1-1 can then be re-written as Eq. 1-2, with we being the specific essential work of fracture, wp the specific
Outer plastic deformation zone Process zone l t L W
26
non-essential work of fracture, l the ligament length, t the sample thickness and β a shape factor related to the outer plastic zone.
𝑊 = 𝑃 𝑑𝑈 = 𝑤 𝑙𝑡 + 𝛽 𝑤 𝑙 𝑡 Eq. 1-2
It is then possible to highlight a linear relationship between the specific total work of fracture (wf), which is Wf divided by the ligament section l × t, and the ligament length (l), according
to Eq. 1-3. Typical curve is shown in Figure 1-8.
𝑤 =𝑊
𝑙𝑡 = 𝑤 + 𝛽𝑤 𝑙 Eq. 1-3
we is then determined by extrapolation of this linear correlation at l = 0. The slope corresponds
to wp. The EWF is theoretically only applicable in a pure plane stress state, leading to a
certain ligament length range of validation.
27
1.1.3 Strain-induced crystallisation
Strain-induced crystallisation (SIC) is a phenomenon occurring in specific polymers, in which amorphous chains tend to crystallise when stretched above a certain level. The SIC is generally considered to greatly impact fracture properties of elastomers [40] and is then worth investigating. Thermoplastic elastomers, similarly to thermoset, undergo this phenomenon. It has been broadly investigated on the widespread natural rubber (NR) [41–45] and also on polychloroprene [46, 47], with in situ X-ray diffraction (XRD) analyses in particular. It was also highlighted in PEBA [33, 48–50] and TPU [51–53].
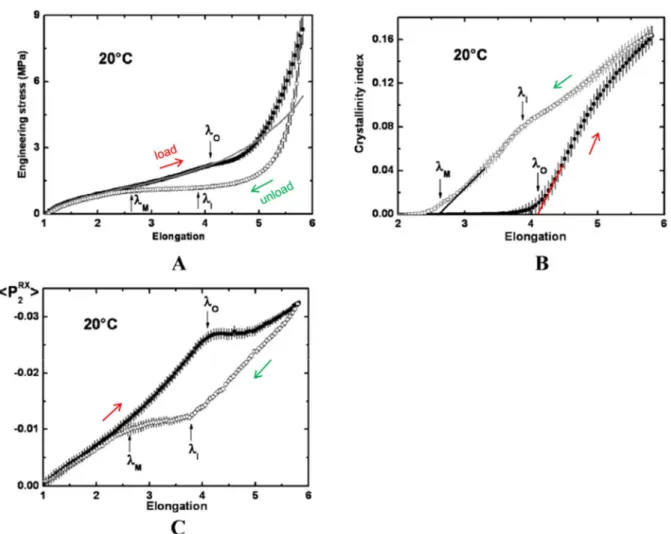
Figure 1-9 - Highlight of the SIC phenomenon with a load-unload cycle on unfilled NR: (A) experimental tensile curve (scatter) and extrapolated curve without SIC (line), (B) crystallinity index and (C) <P2RX> orientation
coefficient of the amorphous phase. λO, λI and λM correspond to specific event in the crystallinity index behaviour.
28
The SIC phenomenon arises from the alignment of the rubbery amorphous chains in the tensile direction. Reaching a certain elongation λcrist, it becomes energetically advantageous for the
chain to crystallise. The global SIC behaviour in NR is illustrated in Figure 1-9. Crystallinity index is integrated from in-situ WAXD analyses performed during the tensile test. <P2RX>
quite intuitively corresponds to an orientation coefficient of the molten phase during stretching, also calculated from WAXD diffractograms [42]. Upon loading, P2 first increases
steadily with elongation, demonstrating the progressive alignment of the initially isotropic amorphous chains in the tensile direction. The corresponding tensile curve exhibits a typical elastomeric response. Around λ = 4 (a value widely reported for various unfilled NR), the crystallisation process starts. The crystallinity index then increases, associated with a steep stress increase, due to the reinforcing effect of the newly formed crystallites. The continuous line on graph (A) represents the tensile curve associated with the amorphous phase solely, and thus highlight the contribution of SIC to the stress. Once the crystallisation process started, it was interestingly observed that no significant further orientation of the chains that remained in a melted state occurred. This is reportedly due to the fact that further increase in the macroscopic elongation systematically leads to crystallisation of some chain segments, leaving the melted phase unaltered. This phenomenon is actually illustrated by a stress softening just above λcrist, when the crystallisation starts but the hardening effect is not yet
significant. Upon unloading, complete melting occurs, and NR samples fully retrieve their initial length.
The strain-induced phenomenon in TPEs presents several significant differences, mostly induced by the presence of hard phases. The multiphase nature of TPEs complicates the investigation of morphological change during stretching. Nevertheless, several studies gave an insight of the phenomenon. TPEs with low hard block content initially present hard phases
29
in lamellar or fibrillar forms, with broad distribution of sizes and aspect ratio, depending on the crystallisation and H-bonding driving phenomenon.
Figure 1-10 - Schematic diagram illustrating morphology change during stretching and corresponding SAXS pattern. A represents the hard segments lamellar structure and B the strain-induced crystallised soft segments, in nanofibrilar form [54].
Though the SIC obviously concerns the soft segments, the hard phase is also reportedly greatly affected by stretching. The morphological change underwent by TPEs when uniaxially stretched is illustrated in Figure 1-10, based on in situ SAXS analyses which provide an interesting outlook of the structure at a wider scale than WAXS. Starting from randomly-oriented hard domains, stretching up to 150 % induces the soft segments to orientate in the tensile direction (not shown on the figure), themselves causing the hard domains to orientate. Lamellas are observed to orientate with a prefered tilt angle with respect to the stretching direction. This tilt is reportedly due to mechanical torque on hard domains generated by
30
covalently bonded soft segments [48, 54]. The SIC starts around 200 % (λ = 3), forming nanofibrils of crystallised soft segments between hard domains. It is accompanied with breakage of the hard domain lamellas by shearing, forming smaller fibrillar hard domains. This hard domain breakdown causes irreversible morphological change, responsible for the permanent set particularly observed when TPEs undergo a load-unload cycle. This lamellas breakdown goes on, along with SIC of soft segments, towards a highly oriented morphology.
31
1.2 Marine ageing of thermoplastic elastomers
The ageing phenomenon of a polymer can be defined as any change in morphology and/or chemical structure, induced by its proper instability, by interaction with its environment, by mechanical stress or a mix of theses causes. The distinction is usually made between physical and chemical ageing. The former mainly relates to molecule spatial arrangement change, while the latter includes change of the chemical structure. We will particularly focus here on reminding the characteristics of water absorption mechanism in polymers, as well as the chemical degradation induced by water and air and its consequence on material properties. 1.2.1 Water absorption
The presence of water in a polymer can have dramatic effects on its properties and thus, is worth investigating. This is particularly crucial for marine applications. The water absorption phenomenon results from two main mechanisms: water molecule vaporization at the sample surface and, then, the molecule diffusion in the polymer. The water diffusion behaviour in polymer is the subject of numerous studies [55–57]. Supposing that the water adsorption is fast enough to be negligible, the Fick law is commonly considered to describe water uptake (Eq. 1-4), with m being the sample mass, x the depth in sample thickness and D the diffusion coefficient.
𝑑𝐶
𝑑𝑡 = 𝐷
𝜕²𝐶
𝜕𝑥² Eq. 1-4
The diffusion takes place until an equilibrium state is reached, associated with a water concentration at saturation Csat. In the seawater case, dissolved substances such as minerals are
insoluble in the polymer, inducing a lower chemical potential compared to deionized water. Particularly, Csat is lower in seawater, and resulting change due to water are then smaller. The
32
For instance, Csat is around 9 % for a PA6, while it is around 1.5 % for a PA12 containing half
the amide content (at 23 °C, 100 % RH). It is usually considered that water only diffuses in the amorphous phase of semi-crystalline polymers, the crystallites being too dense for the water to diffuse into. H-bonding is also reported to obstruct water (or oxygen) diffusion [58, 59]. Nevertheless, water content at saturation increases with the hard block content (Figure 1-11), but does not exceed a few percent [60–63]. TPEs coefficient diffusion D is reported in the 10-11 to 10-10 m2/s range for immersion temperature between 20 and 90 °C
[60, 61, 63], which is 10 to 100 times higher than epoxies [64, 65] and in the same range as thermoset PU [66]. D is dependent on the hard block content, but not on the water activity (Figure 1-11). Csat, as well as D, are temperature-accelerated.
Solubility Diffusion coefficient
Figure 1-11 - Water solubility vs. water activity and diffusion coefficient vs. water content at saturation for a series of PEBAX with various hard block content [63].
1.2.2 Chemical ageing
Chemical ageing relates to irreversible modification of the polymer chemical structure. Water, UV and air exposure are major sources of chemical degradation for polymers and have been extensively studied on conventional thermoplastic polymer and thermoset elastomers. However, environmental effect on TPEs are more seldom. We will here focus on the two main
33
chemical ageing mechanisms induced by water and air exposure: hydrolysis and oxidation. Their consequences on morphological and mechanical properties will also be addressed. The corresponding behaviour of conventional linear polymers, as well as thermoset elastomers, will be considered for comparative purposes.
Hydrolysis
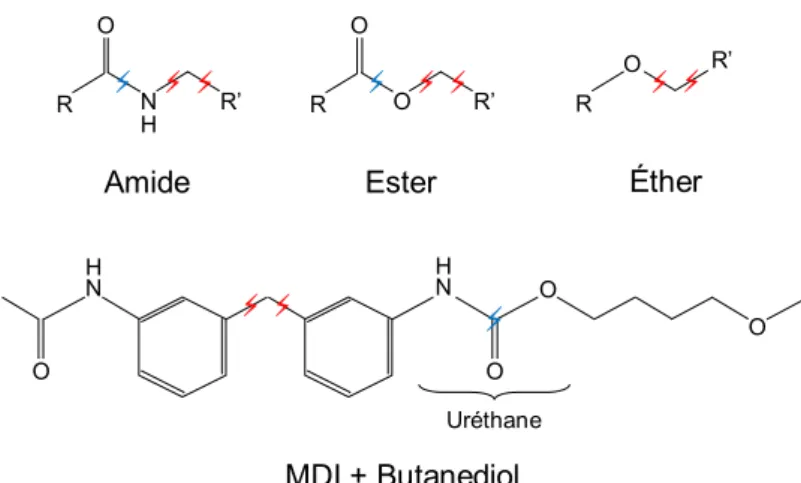
Hydrolysis is the reaction of a water molecule H2O with a chemical group, producing a
scission and two new end-groups, one associating with OH-and the other with H+. Amide,
ester and urethane hydrolysis are summed up inFigure 1-12.
Figure 1-12 – Amide, ester and urethane hydrolysis reactions.
Ether hydrolysis is extremely slow in regard to the others and usually considered negligible. The reverse reaction of hydrolysis is usually considered negligible for ester-based polymers [67], but significant for polyamides [68–70]. The urethane hydrolysis producing a CO2
exhaust, the reverse reaction does not occur. Hydrolysis kinetics depend on the proper sensitivity of the chemical group to hydrolyse, as well as the group environment determining water accessibility. The water solubility into amorphous phase also affects water concentration
34
whereas crystalline phase is considered as impermeable. Amide and ester hydrolysis is also reported to be acid-catalysed [71–74]. As both reactions produce its own catalyser, in the form of carboxylic acid, they are thus auto-catalysed. Several studies have addressed the modelling of polyester [74, 75] or ester-based TPU [60, 76, 77] auto-catalysed hydrolysis, generally considering a pseudo-zero order kinetics.
Anti-hydrolysis agent is commonly used in polymers subjected to auto-catalysis, in order to decrease the degradation rate. This stabilizer reacts with acids, particularly those produced during ester or amide hydrolysis, in order to inhibit the auto-catalysis. Chapman and colleagues compared the hydrolysis kinetics of amide and urethane group included in similar structures [78]. Depending on the structure considered, urethane hydrolysis was reported from 10 to 100 times slower than for amide. Ester hydrolysis is also reported to be one order of magnitude faster than urethane [79]. While there is discussion whether random or end scissions are dominant during polyester hydrolysis, molar mass decrease was attributed to the former [74]. In the literature, the random chain scission scheme is commonly considered for various materials, such as PET, PLA or PA [70, 80, 81].
Oxidation
The complex polymer oxidation process has been vastly addressed in the literature, being one of the main sources of degradation of polymers. This process is self-sustained and auto-accelerated, often leading to a dramatic change of polymers properties. Oxidation is a radical mechanism involving dioxygen, consisting of 3 main steps:
- initiation: non radical entity radical
- propagation: type 1 radical type 2 radical + other products - termination: radical + radical inactive product
35
The detailed mechanisms of oxidation are complex, and still discussed today. Many information can be found in reviews in the literature [82]. In the context of this work, we will more specifically focus on oxidation consequences on the structure and morphology of thermoplastic elastomers. Linear polymers and thermoset elastomers behaviours will be considered for comparison. Oxidative degradation is commonly known to proceed via scission and crosslinking. Polyolefins generally exhibit a predominant scission mechanism [37, 83], [84]. Even though the presence of polar groups in the carbon skeleton may affect the oxidation mechanisms, a major scission process is exhibited by various linear polymers, such as POM [85], PTFE [86] or PA [87, 88]. For polyamide, the main oxidation site is located on α position of the nitrogen, and results in the cleavage of the C-N bond [87–89]. The hydrogen atoms linked to this methylene are the most labile, due to inductive effects of the amide group. The same oxidation site was reported for aliphatic polyurethanes [90]. For polyurethanes composed with aromatic diisocyanate, the central methylene between the rings was identified as the main reaction site [90, 91]. In TPEs, it is usually considered that the degradation is predominant in the soft phase, as H-bonding and crystallinity obstruct the oxygen diffusion into the hard phase [58, 59, 92]. Thermo-oxidation study of PEBA showed that the ether soft block oxidises significantly faster than the hard block, though amide oxidation may be observed in a second stage [93]. The ether group being very sensitive to oxidation, it is generally the major cleavage site in TPEs containing polyether soft blocks [90, 91]. Meanwhile, ester groups are reported significantly more resistant to oxidative ageing than urethane [90]. Oxidation of thermoset elastomers is greatly dependent on the material chemistry and exposure conditions. Predominant crosslinking under oxidative conditions is observed for various rubbers, such as chloroprene rubber [94] or butadiene rubber [95], although competition with scissions is often highlighted. A predominant scission mechanism
36
was observed for gamma-irradiated EPDM, at high irradiation dose [96, 97]. Overall, oxidative and hydrolytic degradation affect polymers and particularly TPEs through scission and crosslinking processes. The respective affected sites are summed up in Figure 1-13 for specific chemical groups.
Figure 1-13 – hydrolysis (blue) and oxidation (red) main sites for specific TPE chemical group. 1.2.3 Structure-property relationships
Polymers properties are determined by their structure at the macromolecular scale. This simple chemistry-based concept implies that macroscopic properties, such as mechanical behaviour, can be deduced from a refined knowledge of a material microstructure. These laws are commonly called structure-property relationships. Identifying structural parameters that govern macroscopic behaviour is then of particular interest. In this context, ageing is an interesting tool, enabling to study a variety of networks produced from a virgin material and from which potential correlation can be highlighted. Moreover, these relationships are required to develop reliable lifetime prediction of polymers based on mechanical behaviour, as it will be developed in this work.
Different approaches are available when considering structure-property relationships, depending on the polymer family. For instance, it is well known that in conventional linear thermoplastic polymers, the chain scission process is responsible for embrittlement,
R O N H R’ Amide N H O O O N H O ⚡ ⚡ ⚡ R O O R’ Ester ⚡ ⚡ ⚡ R O R’ Éther ⚡ ⚡ ⚡ ⚡ ⚡ MDI + Butanediol Uréthane
37
highlighted by a failure property drop when molar mass decreases below a critical value. This critical molar mass M’c was related to molar mass between entanglements Me, as M’c = 4-5
Me (Figure 1-14).
Figure 1-14 – Highlight of a critical molar associated with entanglements in an amorphous thermoplastic polymer.
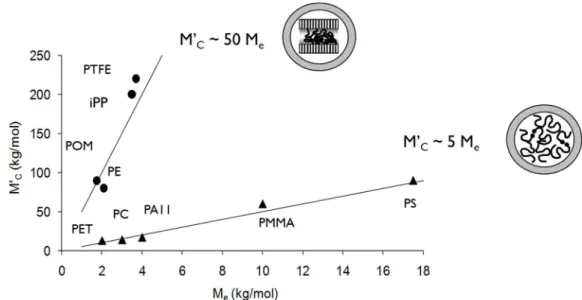
In the case of semi-crystalline polymers, the existence of such critical molar mass is more questionable since the crystalline phase affect the deformation mechanisms associated with the fracture process. However, a similar behaviour was observed [37]. A shared trend linking M’c and Me was highlighted for several semi-crystalline polymers, such as PP, PE, PTFE or
POM, according to M’c = 50 Me (Figure 1-15).
38
These polymers exhibited a chemi-crystallisation process induced by chain scissions. It has been proposed that the physical meaning of this relationship could be related to a critical amorphous layer thickness, or to a critical crystallinity degree, below which cavitation and brittle failure is promoted [98, 99]. It is noteworthy that these observations include chain scissions produced through oxidative and hydrolytic degradation.
The behaviour of elastomers is not clear either. It is commonly considered that elongation at break (b) is related to the crosslinking density ( through a power law, as λb νn. Kuhn first
theorized this approach in 1946 with an exponent n equal to -0.5 [100]. This relationship was verified in some specific cases, such as gamma-irradiated EPDM [97], with an increasing elongation at break induced by a predominant scission process. Natural rubber also seems to exhibit a correlation between λb and ν, though an empirical n closer to -0.75 was reported [44],
[101]. However, EPDM and natural rubber tend to crystallise under strain, so these observations were based on highly crosslinked grades which failure occurred before SIC onset. Indeed, the aforementioned relationship is not consistent with the SIC phenomenon, as it only considers the stretch of amorphous chains. Moreover, this law cannot be applied to describe the embrittlement observed during a chain scission process, since the crosslink density increase caused by scissions would result in a λb increase. Overall, even if influencing
parameters have been globally highlighted, global and relevant structure-property relationships in elastomers have not been completely elucidated yet, and this is even more the case for thermoplastic elastomers.
39
1.3 Strategic approach
Thermoplastic elastomers (TPEs) represent a potential alternative to thermoset elastomers, which use is expected to be restricted due to increasing regulations about chemical risk in industries. This material is already used for many applications and his growth rate is higher than of conventional thermoplastic or thermoset polymers. The global aim of this thesis is to assess the durability of TPEs in marine environment, to determine the capacity of these materials to be used on marine structures for watertightness applications (seal or protection panel). We propose here to investigate the behaviour of polyurethane-based (TPU) and polyamide-based (PEBA) thermoplastic elastomers subjected to accelerated ageing in seawater and air. A versatility of materials and exposure conditions are particularly considered in order to be able to highlight global TPEs features. The microstructural changes induced by the hydrolytic and oxidative degradation processes are characterized, particularly through molar mass measurements giving direct information about the acting chain scission and/or crosslinking mechanisms. Based on these data, a hydrolytic kinetic model is developed, in order to describe and predict the macromolecular structure changes. The auto-catalysis effect, as well as the presence of a hydrolytic stabilizer is particularly included in this model. This matter is addressed in Chapter 3. Along with structural change assessment, the mechanical properties changes are also characterized. Identifying the TPE embrittlement process, in comparison to linear polymers or elastomers, is of particular interest. Relationships between mechanical failure properties and structural parameters are then investigated based on extensive sets of data collected on TPUs and PEBA aged in seawater and air, at several temperatures. The study of the embrittlement process, as well as structure-property relationships, is the subject of Chapter 4. Finally, we focus in Chapter 5 on the strain-induced crystallisation (SIC) phenomenon. The SIC contribution to the mechanical behaviour is
40
investigated. in order to determine if the TPEs embrittlement could be associated with this phenomenon. The effect of ageing on SIC is particularly addressed. Overall, a multi-scale approach, summed up in Figure 1-16, was considered in order to apprehend the environmental degradation behaviour of thermoplastic elastomers. A lifetime prediction method is presented in conclusion, based on data collected throughout this thesis.
Figure 1-16 – Multi-scale approach of the TPEs degradation, with associated mechanisms and corresponding thesis chapters. TPE AGEING MACROMOLECULAR STRUCTURE CHANGE MECHANICAL BEHAVIOUR CHANGE END-OF-LIFE STRAIN-INDUCED CRYSTALLIZATION
PHENOMENON CHANGE
Chap. 5
Effect of ageing on SIC, and its contribution to mechanical behaviour
Chap. 4
Structure – mechanical property relationships
Chap. 3
Hydrolytic kinetic model predicting structural changes
41
Materials and Methods
Table of contents
2.1 Materials ... 42 2.2 Methods ... 44 2.2.1 Injection processing ... 44 2.2.2 Thermal treatment ... 44 2.2.3 Seawater and air ageing ... 44 2.2.4 Water uptake measurements ... 45 2.2.5 Gel Permeation Chromatography (GPC) ... 45 2.2.6 Nuclear Magnetic Resonance (NMR) ... 45 2.2.7 Differential Scanning Calorimetry (DSC) ... 46 2.2.8 Fourier-transform infrared (FTIR) spectroscopy ... 46 2.2.9 X-ray Diffraction (XRD) ... 46 2.2.10 Uniaxiale tensile test ... 47 2.2.11 Cracking testing and Essential work of fracture (EWF) concept ... 48
42
2.1 Materials
Thermoplastic elastomers (TPEs) considered in this work are segmented block copolymers, constituted of hard and soft blocks linked by covalent bonds. Two types of TPEs were particularly studied:
- amide-ether copolymer, named Poly(Ether-Bock-Amide) or PEBA ; - urethane-based copolymer, named Thermoplastic PolyUrethane or TPU.
PEBA and TPU global structures were discussed in section 1.2. One grade of PEBA, commercialized as Pebax®, was purchased at Arkema. The Pebax product range was
historically developed with the purpose to propose “soft” polyamides. The studied grade is identified as Pebax 2533, belonging to the XX33 series. It is constituted of polyamide 12 (PA12) hard blocks and poly(tetramethylene oxide) (PTMO) soft blocks.
Figure 2-1 - TPEs structures. PEBA N H O N H N O O O O O n m N H Soft block Hard block
H TPU-ester TPU-ether N H O N H N O O O O O O OH O n m N H Soft block Hard block
O N H O O n m OH Soft block Hard block
H
O
43
Three TPUs grades, commercialized as Desmopan®, were supplied by Covestro. All of them
are constituted of an association of 4,4'-methylene diphenyl diisocyanate (MDI) and butylene glycol (BDO) as hard block. Two of them, the Desmopan 2586 and 385 grades, are constituted of poly(1,4-butylene adipate) (PBA) as polyester soft block. Grade 385 additionally contains a hydrolytic stabilizer (Stabaxol®) as an additive. The third grade, Desmopan 9370, is
constituted of poly(tetramethylene oxide) (PTMO) as polyether soft block. For clarity purposes, the four TPEs will be thereafter referred as PEBA, TPU-ester, TPU-ester stabilized and TPU-ether. Their structures are illustrated in Figure 2-1, with n and m symbolizing the repetitive unit number of soft hard blocks respectively, and N the polymerization degree. TPEs and several of their properties are listed in Table 2-1. Hard block weight fraction Whard was
determined with 1H-NMR, except for PEBA which value was averaged from literature.
Hardness values come from technical data sheet, density was calculated from weight difference in air and water and number average molar mass Mn was measured with gel
permeation chromatography (GPC).
Grade Commercial reference Hard block Soft block Whard Hardness
(Shore A) Density (g.cm-3) Mn (kg.mol-1) PEBA PEBAX ® 2533 PA12 PTMO 0.24 a 77 1.01 59.0
TPU-ester DESMOPAN2586 ® MDI + BDO PBA 0.36 86 1.19 68.7
TPU-ester Stabilized
DESMOPAN®
385 MDI + BDO PBA 0.36 86 1.19 84.3
TPU-ether DESMOPAN9370 ® MDI + BDO PTMO 0.17 70 1.06 40.9
a: [28, 33, 102]
Table 2-1 – Studied TPEs and their main properties.
44
2.2 Methods
2.2.1 Injection processing
Raw materials were supplied in granular form. Granules were dried at 80 °C for 15 h before processing. Plates were injected on a DK CODIM 175/410 injection moulding machine at PIMM laboratory with the kind help of Paulo Ferreira, according to supplier specifications. 2.5 mm-thick PEBA plates and 1.5 mm-thick TPU plates were obtained.
2.2.2 Thermal treatment
Plates were annealed at 110 °C for 15 h, under vacuum, in order to thermally stabilize their microstructure. Cooling was performed by turning off the oven, temperature slowly decreasing to ambient. DSC analyses confirmed a microstructure stable (no melting) up to 110 °C. 2.2.3 Seawater and air ageing
Samples were immerged in tanks filled with continuously renewed natural seawater (Figure 2-2), at five temperatures: 25, 40, 60, 80 and 90 °C. They were removed from tanks at definite ageing time and carefully wiped with paper towel. In order to avoid any further degradation, samples were fully dried in a desiccator filled with silica gel (i.e. RH equal to 0) at 40 °C for 48 h. Thermal oxidation was performed in Memmert ovens with forced convection at temperatures from 80 to 110 ± 2 °C.
45
2.2.4 Water uptake measurements
Water uptake measurements were performed by periodically weighing on Sartorius LA 310 S (0.1 mg precision). Samples were removed from seawater tanks, carefully wiped with paper towel and quickly weighed. Three samples were tested for each condition. Mass uptake for each sample was calculated according to Eq. 2-1, with m0 the dried mass and m(t) the mass
after immersion time t.
% =𝑚(𝑡) − 𝑚
𝑚 ∗ 100 Eq. 2-1
2.2.5 Gel Permeation Chromatography (GPC)
Two GPC set-ups were used, a different eluent being required for PEBA and TPUs. PEBA analyses were performed by the PeakExpert Company. Analyses were performed at 20 °C using a mixture of hexafluoroisopropanol (HFiP) and 0.1 M potassium trifluoroacetate (KTFAc) as eluent. An apparatus equipped with a pre-column, and two columns packed with 7 μm PFG particles, with 1000 Å and 100 Å pore size respectively. The detection was performed using a Waters 2414 differential refractive index detector. The calibration was performed with poly(methyl methacrylate) samples. For TPUs, analyses were performed at 40 °C using tetrahydrofuran (THF) as eluent on a Malvern Viscotek TDA apparatus equipped with two Malvern T3000 and T6000 columns with a Malvern refractive index detector at an elution rate of 1 mL/min. Polystyrene samples were used for calibration. Number average molar mass Mn and mass average molar mass Mw were calculated as relative values to the
corresponding calibration. Polydispersity was calculated as Ð = Mw / Mn.
2.2.6 Nuclear Magnetic Resonance (NMR)
NMR analyses and data processing were performed with the kind help of Gaëlle Simon and Stéphane Cérantola at the plateforme RMN-RPE from UBO - UFR Sciences & Techniques, at Brest. One- and two-dimensional NMR spectra were recorded at 25 °C on a Bruker Avance
46
III HD500 spectrometer (Bruker, Wissemboug, France) equipped with an inverse 5 mm BBO 1H/BB z-gradient probe head, using standard pulse sequences available in the Bruker software. Chemical shifts are expressed relative to THF (as internal reference) or TSP (as external reference) for TPU and 1,2 butanediol/adipate, respectively.
2.2.7 Differential Scanning Calorimetry (DSC)
DSC analyses were performed on Q200 equipment from TA Instruments. Heating scans were performed from 10 to 230 °C at a rate of 10 °C/min under inert atmosphere (N2). Sample mass
was around 10 mg, weighed precisely. Melting enthalpy ΔHm was integrated from endothermic
peaks.
2.2.8 Fourier-transform infrared (FTIR) spectroscopy
A Perkin Elmer Spectrum 2 Infrared spectrophotometer was used in attenuated total reflectance (ATR) mode to collect the spectrum of bulk samples. Each spectrum resulted from the averaging of 32 scans with a resolution of 4 cm-1.
2.2.9 X-ray Diffraction (XRD) Static XRD analyses
Static WAXS measurements were performed on the high brilliance SWING beamline at the Soleil Synchrotron facility. We gratefully acknowledge the Synchrotron Soleil team, with special thanks to Thomas Bizien. The monochromator was set at 12 KeV. Diffraction patterns were recorded at room temperature, with a CCD detector at 0.5 m from the sample. 1D WAXS curves were obtained by circular averaging of 2D images, using Foxtrot software. 10 images were taken for each sample, from which final 1D curve is averaged. Fityk software was used for diffractogramme deconvolution. Crystalline diffraction peaks and amorphous scattering peaks were modelled with pseudo-Voigt functions, with a shape coefficient arbitrarily fixed at 0.8 and 0.2 respectively.
47
In situ XRD during tensile testing
In-situ XRD analyses of stretching elastomers were performed at Laboratoire de Physique des Solides (Université Paris-Sud – CNRS). In this laboratory, Pierre-Antoine Albouy and his colleagues developed an apparatus able to perform, at laboratory scale, tests that are usually carried out at Synchrotron facilities. A symmetric tensile device is used to stretch the sample. The machine is mounted on a rotating anode X-ray generator (focus size: 0.2 × 0.2 mm2; 40
kV, 40 mA) equipped with a copper anode whose Kα radiation (wavelength 0.1542 nm) is
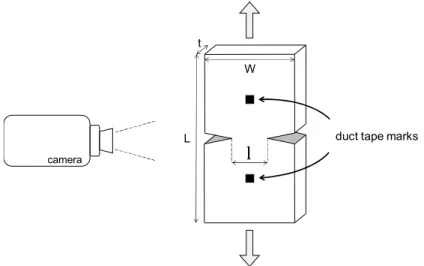
selected by a doubly curved graphite monochromator. The sample is located at the focalization point close to the collimator exit which ensures maximum diffracted intensity. Diffraction patterns are recorded with an indirect illumination CCD camera. A beam-stop is fixed close to the camera and contains a photo-diode that delivers a photocurrent proportional to the X-ray intensity transmitted through the sample. The exposure time was set at 10 s. An optical camera is used to measure the local extension, based on the relative displacements of two duct tape marks placed on the gauge length of the specimen. ISO 37:2005 Type 2 dogbone tensile sample were tested, at 10 mm/min, 20 °C.
2.2.10 Uniaxial tensile test
Uniaxial tensile tests were performed on a 10 kN Instron machine in a room regulated at 21 ± 1 °C and 50 % relative humidity, at a rate of 50 mm/min. A 500 N cell was used to measure load. ISO 37:2005 Type 3 dogbone tensile sample were used (Figure 2-3-a), with duct tape marks placed at gauge length ends. Strain was measured with an optical extensometer. Snapshot of sample deformation were taken with a camera at one image per second. A software developed at IFREMER was then used to track the relative displacement of the two duct tape marks to calculate elongation.
48
Figure 2-3 - (left) tensile test sample with duct tape marks and (right) tensile test set-up with the camera. 2.2.11 Cracking testing and Essential work of fracture (EWF) concept
The same tensile machine as for classic uniaxial tensile test was used. EWF tests were performed on deep double edge notched tensile specimen (DDENT) (Figure 2-4). Samples were manually notched with a cutter to obtain the desired ligament length l. l was then accurately measured with an optical microscope. Elongation and displacement were measured with an optical extensometer.
Figure 2-4 - schematic representation of an EWF test on a DDENT specimen. l
t
L
W
duct tape marks camera
49
Modelling of the hydrolytic degradation of TPEs
Table of contents
3.1 Water absorption ... 50 3.1.1 Initial water uptake properties ... 50 3.1.2 Effect of ageing on water content ... 52 3.2 Identification of hydrolytic degradation mechanisms ... 53 3.2.1 Chemical structure change ... 53 3.2.2 Macromolecular structure change ... 54 3.3 Modelling ... 57 3.3.1 Model development ... 57 3.3.2 Initial conditions ... 60 3.3.3 Kinetic parameters determination ... 60 3.3.4 Temperature dependence ... 62 3.3.5 Scissions prediction ... 63
50
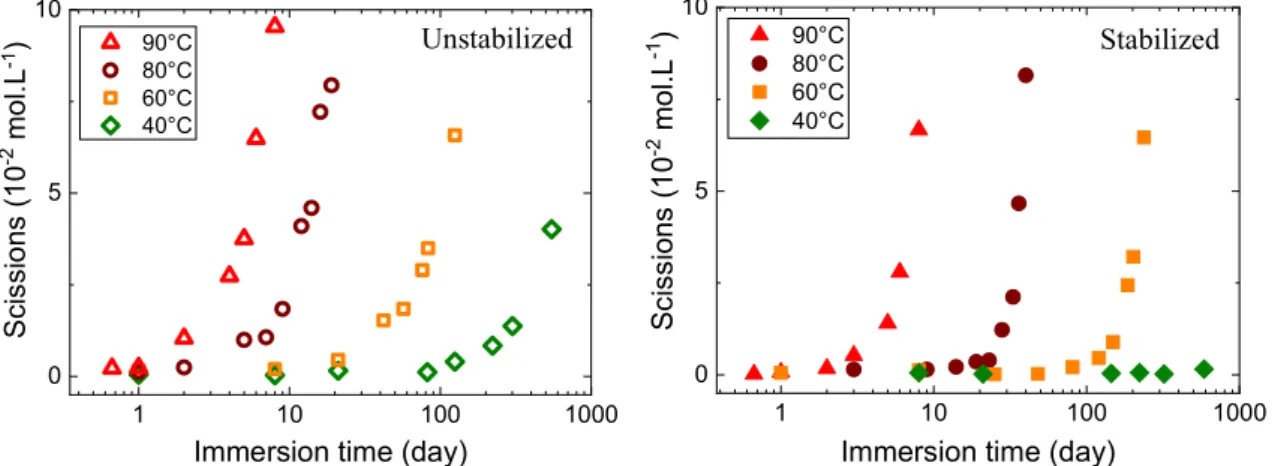
In this chapter we propose to assess the behaviour of TPU-ester in seawater. This material is known to be significantly more sensitive to hydrolytic ageing than oxidative ageing. In order to assess the durability of this material in marine environment, it is then crucial to characterize its hydrolytic degradation. We consider here to investigate the degradation with chain scissions measurements, a parameter equivalent to molar mass which greatly influence the mechanical behaviour of linear polymer as reported in Chapter 1. Unstabilized and stabilized TPU-ester were immersed in seawater at several temperatures between 25 and 90 °C. The degradation mechanisms were identified, as well as the kinetics. Based on these results, we propose here to develop a model able to predict the hydrolytic degradation of TPU-ester.
3.1 Water absorption
3.1.1 Initial water uptake properties
Water absorption properties were assessed on 50 mm × 50 mm × 1.5 mm samples at different temperatures from 25 to 90 °C, for unstabilized and stabilized TPUs. Mass uptake by water sorption was followed until saturation was reached. Figure 3-1 shows the mass uptake for both TPUs. Water uptake can be described with a Fickian law for unstabilized and stabilized TPUs, represented in dashed lines.
Figure 3-1 - Mass uptake in immersion at different temperatures, for unstabilized and stabilized TPUs. 3.105 s1/2.m-1 corresponds to approximately 2 days. The 1D Fickian law is plotted in dashed lines.
0 1 2 3 0 1 2 Time1/2/Thickness (105 s1/2.m-1) M as s up ta ke ( % ) 90°C 80°C 60°C 40°C 25°C 0 1 2 3 0 1 2 Time1/2/Thickness (105 s1/2.m-1) M as s u pt a ke ( % ) 90°C 80°C 60°C 40°C 25°C Unstabilized Stabilized
51
Considering a 1D Fickian model, diffusion coefficient D was determined according to Eq. 3-1 with D the water diffusion coefficient, C the water concentration, t t time and x the depth in the sample thickness.
𝑑𝐶
𝑑𝑡 = 𝐷
𝑑²𝐶
𝑑𝑥² Eq. 3-1
Water concentration [W] (mol.L-1) was calculated from mass uptake at saturation (% m sat.),
water molar mass (18 g.mol-1) and TPU density (1.19 g/cm3). Temperature dependence of D
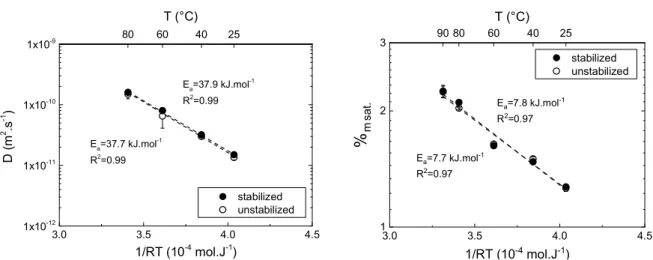
and %m sat. are plotted on Figure 3-2, in Arrhenian type diagrams.
Figure 3-2 – diffusion coefficient D and mass uptake at saturation %m sat. at different temperatures, for stabilized
and unstabilized TPUs.
D at 90 °C was not considered, the diffusion phenomenon being too fast at this temperature to be assessed using our method. D of TPU is 10 to 100 times higher than for epoxies [64, 65] and in the same range as thermoset PU [66]. D and S values are in accordance with literature values on similar material [60, 61]. The temperature dependence of %m sat. and D seems to
obey the Arrhenius law for the temperature range considered here.
Stab. TPU Unstab. TPU
D 37.7 37.9
%m sat. 7.8 7.7
Table 3-1 - Activation Energy Ea (kJ.mol-1) of diffusion coefficient D and mass uptake at saturation %m sat.
3.0 3.5 4.0 4.5 1x10-12 1x10-11 1x10⁻¹⁰ 1x10⁻⁹ D ( m 2 .s -1 ) 1/RT (10-4 mol.J-1) stabilized unstabilized 80 60 T (°C) 40 25 Ea=37.9 kJ.mol-1 R2=0.99 Ea=37.7 kJ.mol-1 R2=0.99 3.0 3.5 4.0 4.5 1 2 3 %m sa t. 1/RT (10-4 mol.J-1) stabilized unstabilized 90 80 60 T (°C) 40 25 Ea=7.8 kJ.mol-1 R2=0.97 Ea=7.7 kJ.mol-1 R2=0.97
52
Activation energies, determined as the slope of the best linear fit, are gathered in Table 3-1. Activation energies for D and S are similar to values found in the literature [60, 61]. Stabilization seems to have no effect on D, S or activation energies.
3.1.2 Effect of ageing on water content
Chemical ageing induced by hydrolysis can change water solubility in the polymers, as degradation products can have a different hydrophilicity from initial chemical groups [80]. It is thus of interest to follow water content change during ageing. Samples were immersed in water at 80 °C for a definite period to cause ageing, then dried, and finally re-immersed in water at 25 °C to assess water concentration at saturation and thus solubility.
Figure 3-3 - Mass uptake at saturation (%m sat.) and corresponding water concentration [W] as function of
immersion time (unstabilized TPU, saturated at 25 °C after ageing at 80 °C followed by drying).
During immersion at 25 °C, ageing is considered very slow, thus water saturation (24 hours) is reached without any chain scission. The effect of ageing on water content, expressed as mass uptake (%m sat.) or concentration ([W]) at saturation, is presented in Figure 3-3, for
unstabilized TPU. Water content increases with immersion time. This result will be further discussed later. 0 5 10 15 1.0 1.5 2.0 2.5 %m s a t.
Immersion time (day)
0.8 1.2 1.6 [ W ] ( m o l.L -1 )
53
3.2 Identification of hydrolytic degradation mechanisms
3.2.1 Chemical structure changeChemical structure change in ageing TPU was investigated with 1H-NMR. Figure 3-4 presents
spectra of unstabilized TPU in its initial state and after ageing in water at 80 °C for 19 days. Signals have been normalized with the area of peaks located at 7.05 and 7.35 ppm (not shown), associated to protons 2 and 3, respectively. These peaks were attributed to phenyl groups, which are considered unchanged through ageing.
Figure 3-4 - 1H-NMR spectra of unstabilized TPU, solubilised in THF, in its initial state and after aging in water
at 80 °C for 19 days. Peaks are attributed to corresponding protons with letters for adipate soft block, and numbers for urethane hard block. Peaks identified with an x result from solvent response. Arrows indicate peaks change during ageing.
Peaks at 1.60, 1.66, 2.28 and 4.05 ppm (associated to protons d, b, c and a respectively) are attributed to the adipate (soft block). The area of these peaks decreases through ageing, which supports an ester hydrolysis hypothesis. The hard block’s urethane group, associated to proton 1 with a peak at 8.70 (not shown), is not affected by ageing over the time range considered. This was expected, as the urethane group is reported to hydrolyse by an order of magnitude slower than ester group [78, 79, 103]. It was thus concluded that only adipate blocks are
![Figure 1-5 – Stress at break and elongation at break dependence on hard block content for a polyether-based TPU [31]](https://thumb-eu.123doks.com/thumbv2/123doknet/2893547.73985/24.892.261.636.426.764/figure-stress-break-elongation-break-dependence-content-polyether.webp)