Publisher’s version / Version de l'éditeur:
Journal of Glaciology, 28, 98, pp. 29-34, 1982
READ THESE TERMS AND CONDITIONS CAREFULLY BEFORE USING THIS WEBSITE. https://nrc-publications.canada.ca/eng/copyright
Vous avez des questions? Nous pouvons vous aider. Pour communiquer directement avec un auteur, consultez la
première page de la revue dans laquelle son article a été publié afin de trouver ses coordonnées. Si vous n’arrivez pas à les repérer, communiquez avec nous à PublicationsArchive-ArchivesPublications@nrc-cnrc.gc.ca.
Questions? Contact the NRC Publications Archive team at
PublicationsArchive-ArchivesPublications@nrc-cnrc.gc.ca. If you wish to email the authors directly, please see the first page of the publication for their contact information.
NRC Publications Archive
Archives des publications du CNRC
This publication could be one of several versions: author’s original, accepted manuscript or the publisher’s version. / La version de cette publication peut être l’une des suivantes : la version prépublication de l’auteur, la version acceptée du manuscrit ou la version de l’éditeur.
Access and use of this website and the material on it are subject to the Terms and Conditions set forth at
Estimate of glacier ablation under a debris layer from surface
temperature and meteorological variables
Nakawo, M.; Young, G. J.
https://publications-cnrc.canada.ca/fra/droits
L’accès à ce site Web et l’utilisation de son contenu sont assujettis aux conditions présentées dans le site LISEZ CES CONDITIONS ATTENTIVEMENT AVANT D’UTILISER CE SITE WEB.
NRC Publications Record / Notice d'Archives des publications de CNRC:
https://nrc-publications.canada.ca/eng/view/object/?id=5c91867f-297d-42d1-aa9a-a6e65903c71a https://publications-cnrc.canada.ca/fra/voir/objet/?id=5c91867f-297d-42d1-aa9a-a6e65903c71a- Ser TH1
N21d
I+
National Research Conseilnational
-1-a
*
r
e
c
~
~
~
no.
1036
c. 2ESTIMATE OF GLACIER ABLATION UNDER A DEBRIS LAYER FROM SURFACE TEMPERATURE AND
IGTEOROLOGICAL VARIABLES by M. Nakawo and G. J. Young
Reprinted from Journal of Glaciology Vol, 28, No. 98, 1982 p. 29
-
34DBR Paper No. 1036
Division of Building Research
This publication is being distributed by the Division of Building Research of the National Reaearch Council of Canada. I t should not be reproduced in whole ox in p a r t without permieaion d the original publieher. The M - vision would be glad to be of a s s i r t a n c e in obtaining much permission.
Publications of the Divieion may be obtained by mail- ing the appropriate remittance (a Bank, Ekpresa, or P o s t Office Money Order, o r a cheque, made payable to the Receiver General of Canada, c r e d i t NRC) to the National Reeearch Council of Canada, Ottawa. KIA OR6.
Stamps a r e not acceptable.
A l i s t of a l l publications of the Divieion is available and may be obtained f r o m the Publications Seation, Division of Building Reaearch, National Research Council of Canada, Ottawa. KIA OR6.
Journal of Glaciology, Vol. 28, No. 98, 1982
E S T I M A T E O F G L A C I E R A B L A T I O N U N D E R
A D E B R I S L A Y E R F R O M S U R F A C E T E M P E R A T U R E A N D M E T E O R O L O G I C A L V A R I A B L E S
By M. NAKAWO*
(Geotechnical Section, Division of Building Research, National Research Council of Canada, Ottawa, Ontario K I A 0R6, Canada)
and G. J. YOUNG
(Snow and Ice Division, National Hydrology Research Institute, Inland Waters Directorate, Environment Canada, Ottawa, Ontario K 1A 0E7, Canada)
ABSTRACT. A simple model suggests that the ablation under a debris layer could be estimated from meteorological variables if the surface temperature data of the layer are available. This method was tested by analyzing the data obtained from experiments with artificial debris layers. Fairly good agreement was obtained between the estimated and the experimental data.
Rfisu~fi. Evaluation de l'ablation d'un glacier sous une couche detritique a partir de la temperature de surface et de variables metborologiques. I1 est possible, grlce a un modele simple, d'evaluer I'ablation d'un glacier sous une couche de roches detritiques en fonction de variables metborologiques si I'on posskde des donnees sur la temperature de surface de la couche detritique. Ce modtle a etk verifie lors de l'analyse des donnees provenant d'essais effectues au moyen de couches detritiques artificielles. Les donnees experimentales sont venues corroborer les donnees obtenues a I'aide des modeles theoriques.
ZUSAMMENFASSUNG. Abschatzung der Eisablation unter einer Schuttschicht rnit Hilfe der Ober-achentemperatur und von meteorologischen Daten. Aus einem einfachen Modell geht hervor, dass die
Ablation unter einer Schuttschicht aus meteorologischen Daten abgeschatzt werden kann, wenn die OberflLhentemperatur der Schicht bekannt ist. Diese Methode wurde mit Hilfe von Daten erprobt, die aus Versuchen mit kiinstlichen Schuttschichten hervorgingen. Zwischen den abgeschatzten und den experimentell gewonnenen Werten ergab sich eine recht gute Ubereinstimmung.
In order to evaluate glacier ablation under a debris layer, Nakawo and Young (1981) proposed a simple model which was successfully employed in analyzing experimental data. With this model, ablation under a debris layer can be estimated from meteorological variables when the thermal resistance of the layer is known. Since it is difficult to determine directly the thermal resistance of a layer of unknown material in the field, it was suggested that the surface temperature of the debris layer may be used for estimating the thermal resistance and consequently the ablation under the layer.
This paper presents the results of testing the validity of the proposed method by comparing estimated data with field measurements. The symbols used are defined in Table I.
MODEL
The energy-balance equation at a debris surface, in which all the terms are taken to be positive downward, is given by
where
* Present address: Department of Applied Physics, Faculty of Engineering, Hokkaido University, Sapporo, Japan
060.
J O U R N A L O F G L A C I O L O G Y
H=Pua(Ta - Ts),
Assuming a steady temperature profile in the debris layer (i.e. a linear profile for a uniform layer), then
since the temperature at the ice-debris interface is 0°C and T, is in degrees Celsius. Neglecting the variation of the stored heat in the layer, and assuming no conduction of heat into the ice beneath, then
When condensation takes place, it is assumed that e, is equal to the saturation vapour pressure, which is a function of Ts. As long as the debris surface is wet, this assumption is also made for periods when evaporation occurs. For a dry surface, on the other hand, e, is assumed to be equal to e,.
By combining Equations (1) through (6) and eliminating T, (and es with the above assumptions), one can estimate r for a given R when F (or G and A if a is known), u,, T,, p, and e, are provided. This was demonstrated by Nakawo and Young (1981). In most cases in the field, however, the value of R is unknown.
When T, is given instead, F, H, and E can be estimated (Equations (2) through (4)), allowing R to be determined by combining Equations (1) and (5). Once R is determined, r can be estimated for other periods using the procedure mentioned above. This is the method to be tested.
EXPERIMENTAL DATA
Experiments were carried out at Peyto Glacier (lat. 5 1' 41' N., long. 116' 33' W.) in the Rocky Mountains, Alberta, Canada from 20 to 22 August 1979. Meteorological variables
atmospheric radiation flux, W m
conduction heat flux through debris layer, W m-*
specific heat capacity of air a5 constant pressure, 1.0 J g
-'
deg-'
evaporation heat flux, W m-mean vapour pressure at a height of 1.5 m, mbar vapour pressure at debris surface, mbar radiation heat flux, W m Z global radiation flux, W IJ-'
sensible heat flux, W m - layer thickness, m
thermal conductivity of debris layer, W m-I deg-'
latent heat of evaporation, 2 494 J R - ' laient heal of Fus~on. 334 J g -
'
atmospheric pressure, rn bar ahlalion rate, m s - 'thermal resistance of debris layer, hlK,, m Z deg W -
'
mean air temperature at a height of 1.5 m, "C surface temperature of debris layer, O C mean wind speed at a height of 1.5 m, m s -'
surface albedocoefficient of heat transfer, 4.89 J m-' deg-' (Naruse and others, 1970) density of glacier ice, 0.9 Mg m-3
G L A C I E R A B L A T I O N U N D E R A D E B R I S L A Y E R 3 1 during the measurement period are summarized in Table 11. The data were collected using the procedures reported by Nakawo and Young (1981).
The ablation rate under debris layers was observed at six plots prepared artificially with debris materials collected from the supraglacial debris of the glacier. Each plot was 0.3 m square with a layer thickness h given in Table 111. The ablation at the plots during a given period was
I
determined by measuring the increase in the relative distance between the debris surface and a
I
taut string installed over the plots. The results are also compiled in Table 111.Surface temperature was measured by a thermistor inserted within a few millimetres of the surface of the debris. This measurement was made only twice in the daytime, but this is considered to be satisfactory for a test of the method as the weather was very stable during the experiments (e.g. atmospheric pressure was almost constant at 803.1 f 1 mbar). The observed values for T, of the measurements are shown in Table IV.
I
I . TEST RESULTS AND DISCUSSION
I
The albedo of the layers was not determined. The debris material had a relatively dark colour and its albedo, when dry, was considered to be about 0.1 to 0.2 (Penndorf, 1956; Geiger, 1961).1
For a wet surface, the albedo decreases by about 20% (Geiger, 1961), but it was still considered 1 to be in the range of 0.1 to 0.2.By substituting the values of T, (Table 111) and meteorological variables (Table IV) into Equations (2) through (5), and combining with Equation (I), R was estimated for each plot. The estimated values are shown in Table 111. Uncertainty in R was caused both by the uncertainty in the albedo and by the difference in the two estimates for 21 and 22 August. It should be noted that E in Equations (1) and (4) was assumed to be zero in the calculation for plot F because its surface was dry. Thermal conductivity K , estimated from these R values was in the range 1.4 to 2.6 W m-' deg-' m (Table 111) which are comparable with the values obtained for various soils (e.g. Kersten, 1949; Penner and others, 1975; Jumikis, 1977).
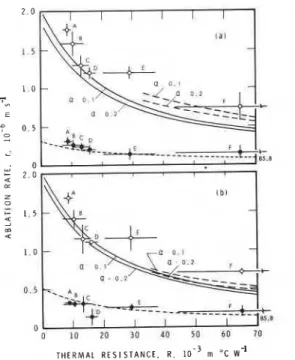
The ablation rate was calculated using the data on meteorological variables given in Table 11, and assuming a = 0.1 and a = 0.2. The results are plotted against R in Figure 1 (a) for the first two periods and (b) for the latter two periods. The solid and dashed lines are for wet and dry surfaces respectively in the daytime. The short dashed lines correspond to the estimates for night-time. The observed ablation rates in Table 111 are also plotted in Figure 1 using the R values given in Table 111.
The agreement between calculation and observation is fairly good, although there are some discrepancies. It is considered that the disagreement could be attributed to uncertainty in the estimates of R because there were few measurements of
T,,
and there was the uncertainty as to'
whether the temperature was in a steady state at the time of the observations. The errors involved in the measurement of T, could also cause an error in the determination of R,
/
% TABLE 11. METEOROLOGICAL VARIABLES DURING THE EXPERIMENTAL PERIOD
P mbar mbar e. 20-21 August (night) 803.1 -0.91 10.17 (4-5) 0.0 (252.7) 2 1 Aueust (dav) 803.1 5.35 8.17 4-5 525.3 252.7 2 1-22 ~ u g u s t &ht) 803.1 -0.26 10.56 (4-5) 0.0 (284.1) 22 August (day) 803.1 5.97 10.17 4-5 340.2 315.4
* A was calculated by an equation proposed by Kondo (1967): A =
u(T,
+
273 K ) ~ ( 1 -(0.49-0.066 m b a ~ - ' / ~ e : / ~ ) ~ ~ } , where C , is given by cloud type, cloud amount, and mean vapour pressure. Numerical values in parentheses were assumed for the periods of night: for 21-22 (night), an average of 21 (day) and 22 (day); for 20-21 (night), the same value as 21 (day), since no data are available for 20 (day) either.TABLE 111: PHYSICAL CONDITIONS, ABLATION RATE, SURFACE TEMPERATURE, THERMAL RESISTANCE, AND THERMAL
CONDUCTIVITY AT EACH PLOT
PIor h, loc3 m Surface condition 20-21 August measured ((ni.eht) {calculated measured calculated (a=0.1) 1 12.40 local time
Ts, "C (21 August) 15.50 local time
(22 +gust) R , lo-' m2 deg
y-
K,,w
m-' deg- A 12.2 f 2.0 wet 0.3 1 f 0.04 0.21 1.77 f 0.08 1.44 0.32 f 0.02 0.36 1.69 f 0.07 1.44 4.2 4.4 8.9 f 1.1 1.4 f 0.3 B 22.2 f 3.9 wet 0.26 f 0.06 0.20 1.59 f 0.16 1.36 0.3 1 f 0.04 0.35 1.42 f 0.1 1 1.36 5.2 4.1 10.5 f 3.7 2.1 f 0 . 8 C 24.4 f 2.2 wet 0.24 f 0.04 0.18 1.30f0.13 1.25 0.3 1 f 0.10 0.32 1.16 f 0.19 1.24 5.6 5.4 13.3 f 2.8 1.8 f 0.4 D 41.6 + 6.0 wet 0.20 f 0.05 0.17 1.20 0.07 1.15 0 . 1 4 ~ 0 . 1 1 0.30 1.12 f 0.01 1.14 5.9 6.4 15.9 f 1.9 2.6 f 0.5 E 40.4 f 3.1 wet 0.14 f 0.07 0.13 1.20 f 0.08 0.84 0.26 f 0.03 0.22 1.16f0.16 0.83 8.0 7.9 29.0 f 8.4 1.4 f 0.4G L A C I E R A B L A T I O N U N D E R A D E B R I S LAYER 3 3
TABLE IV. VALUES FOR THE METEOROLOGICAL VARIABLES WHEN THE SURFACE TEMPERATURE WAS MEASURED
P Ta ea U . G A*
mbar "C mbar m s - ' W m - 2
w
m - 212.1&13.10 local time (21 August) 803.1 6.16 8.06 4-5 567.0 252.7 15.2&16.20 local time (22 August) 803.1 11.83 8.94 4-5 441.0 315.4
*
A was assumed to be the mean value for the daytime, as its variation is small within a day.particularly when R is large. For plots E and F, for example, a 0.5 deg difference in T, would result in 10 x lop3 and 5 x deg W-' difference respectively in the value of R when the modified T, is applied through Equations (1) to (5).
Another source of disagreement between the calculated and the observed data is the uncertainty in the value of
p.
The value of 4.89 J rnp3 deg-' is an average compiled by Naruse I and others (1970) from the data for ,8 obtained at various surfaces of glaciers, snow fields, and artificial basins. The original data forP
scattered in a range of f 1.16 J m-3 deg-' around the mean value. Owing to the presence of the experimental plots, the surface roughness of these plots on Peyto Glacier was greater than that of a natural glacier surface. This would result in a larger4 value of ,8 than for a natural surface. The value of
P
at the plot could therefore have been largerthan 4.89 J rnp3 deg-'. Using a larger value of
p
would result in a larger ablation rate for a givenR ;
if R is large, however, an increase in the value of ,L? has little effect. The value of ,8 is also dependent on wind stratification. Log-linear profiles of wind speed and temperature were found applicable at the glacier (Derikx, [19751; Munro and Davies, 1977, 1978). In the present experiments advection could have played an important role in heat exchange at the surfaces of the plots, since the area of the plots was small. However, the determination of the value of taking the advection term into consideration is a very complex problem.-
Fig. I. Ablation rate versus thermal resistance during 20-21 August (a) and 21-22 August (b). Solid and open circles are observed data during nighttime and daytime respectively. Short dashed lines show the estimation from meteorological variables for night-time. Solid and dashed lines represent the calculation for wet and dry surface respectively during daytime.
3 4 J O U R N A L O F ' G L A C I O L O G Y
Nonetheless, the general agreement between the calculated and observed values suggests that glacier ablation under a debris layer can be predicted from meteorological and surface temperature measurements. To obtain a good prediction, it is recommended, as pointed out by Kraus ([19751), that special attention be paid to surface roughness which is sometimes very large at stagnant areas near termini of glaciers (see e.g. Iwata and others, 1980). A continuous record of surface temperature as well as observations on temperature profile in the debris layer would also improve the prediction.
ACKNOWLEDGEMENTS
The authors would like to thank N. Maeno and H. Narita of the Institute of Low Temperature Science, Hokkaido University, for their assistance in the field, and L. W. Gold of the Division of Building Research, National Research Council of Canada, for encouraging them
j
to write this paper.MS. received 19 December 1980 and in revised form 5 May 1981
R E F E R E N C E S
Derikx, A. L. [ 1975.1 The heat balance and associated runoff from an experimental site on a glacier tongue. I Union Geodksique et Geophysique Internationale. Association Internationale des Sciences Hydrologiques. Commission des Neiges el Glaces.] Symposium. Neiges et glaces. Actes du colloque de Moscow, aoiit 1971, p. 59-69.
(IAHS-AISH Publication No. 104.)
Geiger, R. 1961. Das Klima der bodennahen Luftschicht. Vierte AuJage. Braunschweig, Friedrich Vieweg und Sohn. [English translation: The climate near the ground. Translated by Scripta Technics, Inc. Cambridge, Mass., Harvard University Press, 1965.1
Iwata, S., and others. 1980. Surface morphology in the ablation area of the Khumbu Glacier, lbyl S. Iwata, 0. Watanabe, and H. Fushimi. Seppyo, Vol. 41, Special Issue, p. 9-17.
Jumikis, A. R. 1977. Thermalgeotechnics. New Brunswick, N.J., Rutgers University Press.
Kersten, M. S. 1949. Thermal properties of soils. Bulletin of the University of Minnesota Engineering Experiment
Station, No. 28.
Kondo, J. 1967. Analysis of solar radiation and downward long-wave radiation data in Japan. Scientific Report of
Tohoku University, Ser. 5, Vol. 18, No. 3, p. 91-124.
Kraus, H. [1975.1 An energy balance model for ablation in mountainous areas. [Union Geodisique el Geophysique
Internationale. Association Internationale des Sciences Hydrologiques. Commission de Neiges el Glaces.] Symposium. Neiges et glaces. Actes du colloque de Moscow, aoiit 1971, p. 74-82. (IAHS-AISH Publication No.
104.)
Munro, D. S., and Davies, J. A. 1977. An experimental study of the glacier boundary layer over melting ice. Journal
of Glaciology, Vol. 18, No. 80, p. 425-36.
Munro, D. S., and Davies, J. A. 1978. On fitting the log-linear model to wind speed and temperature profiles over a melting glacier. Boundaty-Layer Mefmrologj~, Vol. 15. No. 4, p. 423-37.
Nakawo, M., and Young, 6. J . 1981. Field experiments to determine the effect of a debris layer on ablation of glacier ice. A~rnals of Glaciology, Vol. 2. p. 85-9 1.
Naruse, R.. and ofhers. 1970. Kion-ytsetsu no yapai kenkyu [Field studies on snow melt due to sensible heat
t r a d e r from lhe atmosphere]. [By] R. Namse, H. Oura, [and] K. Kojima. Teion-kagaku: Low Temperalure Science, Ser.A. [No.] 28, p. 191-202.
Penndorf. R. 1956. Luminous reflectance (visual albedo) of natural objects. Bulletin of the American Meteorological
Sociefv, Vol. 37, No. 4, p. 1 4 2 4 4 .
Penner. E.. and others. 1975. Thermal conductivitv laboratorv studies of some Mackenzie Hiahwav soils. bv E. ~ e n n e r , G. H. Johnston, and L. E. Goodrich. ~ a i a d i a n ~eoiechnical ~ournal, Vol. 12, No. 3,