HAL Id: hal-00301194
https://hal.archives-ouvertes.fr/hal-00301194
Submitted on 13 Apr 2005HAL is a multi-disciplinary open access
archive for the deposit and dissemination of sci-entific research documents, whether they are pub-lished or not. The documents may come from teaching and research institutions in France or abroad, or from public or private research centers.
L’archive ouverte pluridisciplinaire HAL, est destinée au dépôt et à la diffusion de documents scientifiques de niveau recherche, publiés ou non, émanant des établissements d’enseignement et de recherche français ou étrangers, des laboratoires publics ou privés.
Validation of ENVISAT/SCIAMACHY columnar
methane by solar FTIR spectrometry at the
Ground-Truthing Station Zugspitze
R. Sussmann, W. Stremme, M. Buchwitz, R. de Beek
To cite this version:
R. Sussmann, W. Stremme, M. Buchwitz, R. de Beek. Validation of ENVISAT/SCIAMACHY colum-nar methane by solar FTIR spectrometry at the Ground-Truthing Station Zugspitze. Atmospheric Chemistry and Physics Discussions, European Geosciences Union, 2005, 5 (2), pp.2269-2295. �hal-00301194�
ACPD
5, 2269–2295, 2005 Validation of SCIAMACHY columnar methane by Zugspitze FTIR R. Sussmann et al. Title Page Abstract Introduction Conclusions References Tables Figures J I J I Back CloseFull Screen / Esc
Print Version Interactive Discussion
EGU Atmos. Chem. Phys. Discuss., 5, 2269–2295, 2005
www.atmos-chem-phys.org/acpd/5/2269/ SRef-ID: 1680-7375/acpd/2005-5-2269 European Geosciences Union
Atmospheric Chemistry and Physics Discussions
Validation of ENVISAT/SCIAMACHY
columnar methane by solar FTIR
spectrometry at the Ground-Truthing
Station Zugspitze
R. Sussmann1, W. Stremme1, M. Buchwitz2, and R. de Beek2
1
IMK-IFU, Forschungszentrum Karlsruhe, Garmisch-Partenkirchen, Germany
2
Institute of Environmental Physics (iup), University of Bremen FB1, Bremen, Germany Received: 27 January 2005 – Accepted: 23 March 2005 – Published: 13 April 2005 Correspondence to: R. Sussmann ([email protected])
ACPD
5, 2269–2295, 2005 Validation of SCIAMACHY columnar methane by Zugspitze FTIR R. Sussmann et al. Title Page Abstract Introduction Conclusions References Tables Figures J I J I Back CloseFull Screen / Esc
Print Version Interactive Discussion
Abstract
Methane total-vertical column retrievals from ground-based solar FTIR measure-ments at the Permanent Ground-Truthing Station Zugspitze (47.42◦N, 10.98◦E, 2964 m a.s.l.), Germany are used to validate column averaged methane retrieved from ENVISAT/SCIAMACHY spectra by WFM-DOAS (WFMD) version 0.4 and 0.41 for 153
5
days in 2003. Smoothing errors are estimated to be below 0.10% for FTIR and 0.14% for SCIAMACHY-WFMD retrievals and can be neglected for the assessment of ob-served bias and day-to-day-scatter. In order to minimize the altitude-difference effect, dry-air column averaged mixing ratios (XCH4) have been utilized. From the FTIR-time series of XCH4an atmospheric day-to-day variability of 1% was found, and a sinusoidal
10
annual cycle with a ≈1.6% amplitude. To obtain the WFMD bias, a polynomial fitted to the FTIR series was used as a reference. The result is WFMD v0.4/FTIR=1.008±0.019 and WFMD v0.41/FTIR=1.058±0.008. WFMD v0.41 was significantly improved by a time-dependent bias correction. It can still not capture the natural day-to-day variabil-ity, i.e., the standard deviation calculated from the daily-mean values is 2.4% using
15
averages within a 2000-km radius, and 2.7% for a 1000-km radius. These numbers are dominated by a residual time-dependent bias in the order of 3%/month. The latter can be reduced, e.g., from 2.4% to 1.6% as shown by an empirical time-dependent bias correction. Standard deviations of the daily means, calculated from the individual measurements of each day, are excluding time-dependent biases, thus showing the
20
potential precision of WFMD daily means, i.e., 0.3% for a 2000-km selection radius, and 0.6% for a 1000-km selection radius. Therefore, the natural variability could be captured under the prerequisite of further advanced time-dependent bias corrections, or the use of other channels, where the icing issue is less prominent.
ACPD
5, 2269–2295, 2005 Validation of SCIAMACHY columnar methane by Zugspitze FTIR R. Sussmann et al. Title Page Abstract Introduction Conclusions References Tables Figures J I J I Back CloseFull Screen / Esc
Print Version Interactive Discussion
EGU
1. Introduction
The atmospheric trace species methane (CH4) contributes by 15% to the anthro-pogenic greenhouse forcing, and has recently been included into the list of the so called “Kyoto gases”. It has thus become mandatory to better understand and monitor its spatiotemporal distribution on a global and centennial scale. In particular, the
loca-5
tions and strengths of the CH4sources are not sufficiently quantified yet (IPCC, 2001). An obstacle for the quantification of surface sources is that measurements of small variations on top of a large background of this well-mixed gas are required. Therefore, measurements with both high precision and global coverage are needed.
High-precision measurements of in-situ mixing ratios are realized by
surface-10
sampling sites of the GAW (Global Atmosphere Watch) and NOAA/CMDL (National Oceanic and Atmospheric Administration Climate Monitoring and Diagnostics Labo-ratory) networks. By the inverse modeling of these in-situ measurements the global atmospheric CH4cycle has been characterized and the average uncertainties of CH4 source magnitudes could be reduced by more than one third (Hein et al., 1997).
15
Ground-based solar FTIR (Fourier Transform Infrared) spectrometry sites operated within the NDSC (Network for the Detection of Stratospheric Change) are yielding verti-cal total columns of CH4. The Zugspitze FTIR is a so called Primary-Status instrument within the NDSC, which certifies both operationality and data quality on a highest level. These ground-based total-column measurements are crucial for the validation of the
20
upcoming satellite missions dedicated to the measurement of greenhouse gases, and are likely to become important constraints on the geographic and temporal distribution of CH4sources and sinks in the future.
Satellite-borne remote sounders are also providing total columns and have the po-tential to add the required information on the global distribution of CH4 to the highly
25
precise ground-based networks, but strongly rely upon careful ground-truthing. The first global maps of CH4 columns have been retrieved from IMG/ADEOS thermal in-frared (TIR) nadir spectra (Kobayashi et al., 1999). The results show qualitatively the
ACPD
5, 2269–2295, 2005 Validation of SCIAMACHY columnar methane by Zugspitze FTIR R. Sussmann et al. Title Page Abstract Introduction Conclusions References Tables Figures J I J I Back CloseFull Screen / Esc
Print Version Interactive Discussion
expected variability, for example the North-South hemispheric gradient (Clerbaux et al., 2003). The CH4amounts retrieved from TIR nadir observations are relatively insensi-tive to changes within the lower troposphere, however.
Meanwhile, another satellite instrument has achieved the potential to retrieve global information on CH4, i.e., the Scanning Imaging Absorption Spectrometer for
Atmo-5
spheric CHartographY (SCIAMACHY), which is a UV/visible/near-infrared spectrome-ter onboard ENVISAT launched in 2002 (Bovensmann et al., 1999). Due to the near-infrared (NIR) spectral domain the SCIAMACHY nadir measurements of CH4are highly sensitive to concentration changes at all altitude levels, including the boundary layer (see Sect. 3).
10
In this paper we focus on the validation of the SCIAMACHY scientific total-column product retrieved at the University of Bremen by the Weighting Function Modified DOAS (WFMD) algorithm (Buchwitz and Burrows, 2004; Buchwitz et al., 2005a, b), which uti-lizes an iterative spectral fitting by scaling of an US-standard a priori profile. CH4 has been retrieved from the 2265–2280 nm spectral region. Simultaneously, oxygen
15
(O2) columns have been retrieved from the oxygen A band (around 760 nm). This en-ables the dry-air column averaged mixing ratio, denoted as XCH4, to be determined: XCH4:=CH4-column/O2-column×0.2095, where 0.2095 is the O2mixing ratio of dry air. This normalization is a means of significantly improving the attainable measurement precision, because many systematic errors are common to the CH4 and O2
spectro-20
metric retrievals, respectively, and thus cancel out (e.g., errors in pressure or zenith angle are propagating in a similar way to the retrieved columns of CH4 and O2). Our validation study refers to version 0.4 of the WFMD product 2003 data set, that has been released via the internet on 6 September 2004, including all consolidated SCIA-MACHY level-1B products available for 2003, i.e., 153 days from the time period
Jan-25
uary 2003–October 2003. Additionally, we validate the version 0.41 XCH4data update, released on 30 September 2004, which includes an a-posteriori time-dependent bias correction, based on a channel-8 throughput analysis. Our study is the first validation of this (WFMD version 0.41) promising attempt to compensate for the time-dependent
ACPD
5, 2269–2295, 2005 Validation of SCIAMACHY columnar methane by Zugspitze FTIR R. Sussmann et al. Title Page Abstract Introduction Conclusions References Tables Figures J I J I Back CloseFull Screen / Esc
Print Version Interactive Discussion
EGU slit function changes due to the SCIAMACHY-channel 8 ice-build up. (XCH4 version
0.41 also utilizes a normalization by CO2 rather than O2, which has the advantage of being retrieved in a spectral domain that is spectrally more closely neighbored to the target species). The SCIAMACHY CH4scientific product plays a key role for the users community, since there has been no operational product for CH4released by ESA yet.
5
An initial comparison of WFMD CH4 retrievals to global models showed that the measured column amounts agree with the model columns within a few percent. For individual measurements the standard deviations of the difference with respect to the models were found to be in the range of 100–200 ppbv (5–10%) for XCH4(Buchwitz et al., 2005a). Early characterization studies of SCIAMACHY scientific products have also
10
been presented at the Second Workshop on the Atmospheric Chemistry Validation of ENVISAT (ESA, 2004).
In this paper we want to promote the validation and maturation of SCIAMACHY XCH4 by comparing the WFMD v.04 and v0.41 retrievals to the ground-based correlative solar FTIR data of the clean air site Zugspitze. The goal of this paper is i) to thereby assess
15
the overall bias of WFMD v0.4 and 0.41, ii) characterize the time-dependent bias (ice issue) in detail, in particular the intended effect from the version 0.4 to 0.41 update, and ii) to address the question, to which degree the precision of the WFMD retrievals allows to reflect the true atmospheric variability of CH4in a realistic manner – both for the version 0.41 at hand, and under the assumption that the problem of time-dependent
20
bias could be further reduced in future WFMD-data updates.
2. The correlative ground-data set from Zugspitze solar FTIR
Validation is performed using the ground-based data that are being recorded by the NDSC-Primary Status solar FTIR instrument at the Zugspitze (47.42◦N, 10.98◦E, 2964 m a.s.l.) continuously. The Zugspitze-FTIR instrument and retrieval-set up has
25
been described in detail elsewhere (Sussmann et al., 1997; Sussmann, 1999). Briefly, a high-resolution Bruker IFS 120 HR Fourier Transform Spectrometer is operated with
ACPD
5, 2269–2295, 2005 Validation of SCIAMACHY columnar methane by Zugspitze FTIR R. Sussmann et al. Title Page Abstract Introduction Conclusions References Tables Figures J I J I Back CloseFull Screen / Esc
Print Version Interactive Discussion
an actively controlled solar tracker, and liquid-nitrogen cooled MCT (HgCdTe) and InSb detectors.
The Zugspitze CH4 total columns are retrieved by using non-linear least squares spectral fitting software (SFIT) initially developed at NASA Langley Research Center (Rinsland et al., 1984). For the CH4total-column retrievals we applied a strong
smooth-5
ness constraint based upon a VMR a priori profile obtained from balloon-borne FTIR measurements (provided by G.C. Toon, JPL/NASA). We have chosen this conserva-tive approach for the validation purpose of this paper, i.e., we are not performing a full profile retrieval (e.g., via optimal estimation). This is because there are still unresolved spectroscopic problems for CH4, like line mixing, that can propagate into erroneous
10
profiles retrievals via the forward model, leading to subsequent errors in the retrieved columns. This effect is minimized by applying a strong smoothness constraint to the retrievals. The HITRAN-2000 molecular line parameters compilation was used (Roth-mann et al., 2003), and daily p-T-profiles from the Munich radio sonde station (located 80 km to the north of the Zugspitze) have been utilized.
15
For the CH4 column retrievals two different spectral domains from routine-measurement operations were utilized, i.e., a MCT-detector domain micro-window at 1201.80–1202.65 cm−1, (859 spectra recorded on 133 measurement days in 2003; each spectrum resulted from integrating 8 interferometric scans with a 250-cm optical path difference within 20 min) and an InSb-detector domain micro-window at 2835.55–
20
2835.85 cm−1 (781 spectra recorded on 133 measurement days in 2003; each spec-trum resulted from 5 scans with a maximum optical path difference of 175 cm integrated within 10 min). I.e., on average 6.5 MCT-spectra and 5.8 InSb spectra were recorded per day, yielding 6.5+5.8=12.3 retrieved columns per day. The accuracies and preci-sions for CH4vertical-column retrievals from single ground-based FTIR measurements
25
are well characterized and understood and have been estimated from sensitivity stud-ies to be below 6.5% and 2.5%, respectively, see, e.g., Zander et al. (1989). The actual numbers depend somewhat on changing geophysical parameters like the actual solar zenith angle. Daily mean columns were calculated using the arithmetic mean of the
in-ACPD
5, 2269–2295, 2005 Validation of SCIAMACHY columnar methane by Zugspitze FTIR R. Sussmann et al. Title Page Abstract Introduction Conclusions References Tables Figures J I J I Back CloseFull Screen / Esc
Print Version Interactive Discussion
EGU dividual columns. From the above error numbers the precision of a daily-mean column
from our FTIR retrievals is estimated to be below 2.5%/sqrt(12.3)=0.7%. We will show in Sect. 4.2.1 below, that we find an even smaller number of 0.4% for the precision of a daily mean XCH4columns derived directly from our real FTIR measurements.
We calculated Zugspitze XCH4, i.e., air-column averaged mixing ratios for the
val-5
idation purpose of this paper by dividing the FTIR CH4 columns by the air columns calculated from the daily radio soundings. Note that alternatively, other authors have used for the ground-based retrievals a normalization to O2columns measured by FTIR at the same time (Washenfelder et al., 2003), i.e., an analogous approach as described for the satellite retrievals above. On the one side this helps to significantly improve the
10
precision. On the other hand, this increases the uncertainties in the absolute XCH4 values due to additional errors from the O2spectroscopic parameters propagating into the result.
3. Validation approach
First we focus on investigating the bias of absolute XCH4 values. The retrieval of
15
WFMD version 0.4 XCH4 includes an empirical column scaling factor, i.e., an O2 col-umn scaling factor or 0.85 (no scaling factor for CH4), which will be validated. Version 0.41 XCH4 data include a time-dependent bias correction in order to account for the icing issue of SCIAMACHY channel 8, and a normalization to CO2instead of O2, which both will be validated.
20
Subsequently, validation focus will be put in our study on precision and dynamic response of the SCIAMACHY retrievals. I.e., we will investigate, whether the atmo-spheric day-to-day variabilities above the Zugspitze, which are dominated by dynam-ically induced tropopause movements, can be retrieved from the SCIAMACHY data. Furthermore, we find from the Zugspitze FTIR measurements, that the amplitude of
25
the sinusoidal XCH4 annual cycle (dominated by the tropopause annual cycle) is only slightly larger than the standard deviation of the day-to-day scatter (see Sect. 4).
There-ACPD
5, 2269–2295, 2005 Validation of SCIAMACHY columnar methane by Zugspitze FTIR R. Sussmann et al. Title Page Abstract Introduction Conclusions References Tables Figures J I J I Back CloseFull Screen / Esc
Print Version Interactive Discussion
fore, it is challenging to investigate the potential of the SCIAMACHY retrievals to reflect the dynamic response to this weak annual cycle in spite of limited precision and time dependent biases due to the detector-icing issue.
Our approach to this is as follows. Individual WFMD retrievals in the near-infrared spectral domain are showing a significant scatter. The reasons are discussed in detail
5
by Buchwitz and Burrows (2004) and Buchwitz et al. (2005a). Therefore, our validation approach is investigating to what extent the quality of SCIAMACHY data allows to ap-proach the true variability of CH4columns as a function of the amount of the averaging of individual measurements performed in time and space. For this purpose, we are using daily-mean pixel averages within a stepwise increased selection radius around
10
the Zugspitze ground site. The goal is to thereby stepwise reduce the scatter of the daily means by statistically averaging over increasing ensembles of pixels.
One might argue that also source and sink regions may be more and more included into the ensemble while increasing the selection radius, and this could potentially be compensating the statistical effect of reducing the scatter of the daily means. However,
15
this effect is obviously weaker than the reduction of scatter by the statistical effect of increasing the averaging ensemble, as our test of the statistical parameters in Sect. 4 (Table 1) below is proving.
Another issue of the validation approach is how to reduce the impact of varying ground altitudes of the different satellite pixels that are averaged on one hand, and
20
the (higher) altitude of the Zugspitze mountain site on the other hand. We solve this problem by focusing our validation study on XCH4 data, i.e., the column averaged mixing ratios. This quantity does not depend on the average pixel ground-level altitude, assuming a constant mixing ratio with altitude. This approximation does not introduce significant additional errors, as measured CH4 profiles are typically showing nearly
25
constant volume mixing ratios as a function of altitude up to the tropopause. Deviations from this behavior are in the few per cent range, with a tendency to approach perfectly constant mixing rations as a function of altitude after averaging of only a few profiles.
ACPD
5, 2269–2295, 2005 Validation of SCIAMACHY columnar methane by Zugspitze FTIR R. Sussmann et al. Title Page Abstract Introduction Conclusions References Tables Figures J I J I Back CloseFull Screen / Esc
Print Version Interactive Discussion
EGU low-altitude ground site, located in the boundary layer, is to be preferred for satellite
validation of tropospheric species like CH4. On the one hand, as discussed above, for a high-altitude site the altitude difference relative to the satellite-pixel ground altitude has to be properly considered, which may introduce errors on the per-cent level. On the other hand, a high-altitude site like the Zugspitze located above the boundary layer
5
has the advantage to be representative for a much wider horizontal area, and that is exactly what the satellite data are - we will show below that not only the pixel size of the satellite data (60×30 km footprint), but even larger horizontal averages, e.g., selection radii in the order of 1000 km, have to be considered for the validation purposes.
Finally, an important issue in intercomparing two different remote-sounding systems
10
(satellite versus ground) is to properly take their altitude-dependent sensitivities, i.e., their averaging kernels (Rodgers, 1990) into account. In case of strongly differing ker-nels, neglecting the effect of different smoothing errors can result in intercomparison errors in the order of the natural variability of the trace-gas columns (Rodgers and Connor, 2003). However, in our case we encounter the nearly ideal situation, that
15
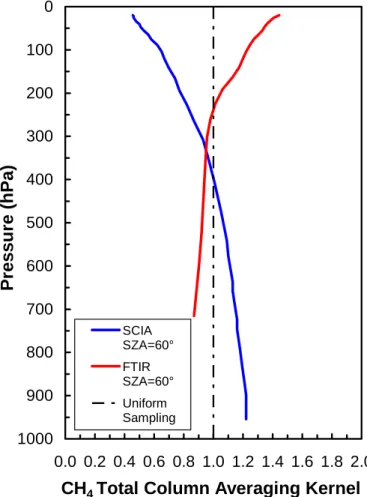
the ground-based (FTIR) and satellite (SCIAMACHY) instruments are both sampling the CH4 columns with nearly the same total-column averaging kernels as shown in Fig. 1, i.e., both being close to the ideal uniform sampling. The FTIR kernel shown is a weighted mean of the two (slightly differing) FTIR kernels we obtain from utiliz-ing the two different spectral micro-windows from alternating MCT and InSb
measure-20
ments as described in Sect. 2. This mean was weighted by the number ratio of all spectra of the two different spectral domains used in our study (i.e., 859/781, see Sect. 2). The resulting effective FTIR kernel shows only minor differences relative to the SCIAMACHY-WFMD kernel, e.g., at the 700 hPa level, there is a slight under-estimation of the natural variability of ≈13% by FTIR, and a slight overunder-estimation of
25
≈14% by SCIAMACHY (Fig. 1). In the stratosphere the situation is reversed, with the underestimations/overestimations increasing with altitude. However, due to the de-creasing air-number density the latter does not quantitatively impact the total columns retrieved. To prove this quantitatively, we calculated the smoothing errors sqrt[(aF T IR–
ACPD
5, 2269–2295, 2005 Validation of SCIAMACHY columnar methane by Zugspitze FTIR R. Sussmann et al. Title Page Abstract Introduction Conclusions References Tables Figures J I J I Back CloseFull Screen / Esc
Print Version Interactive Discussion
ai d eal)T Sa (aF T IR–ai d eal)] for the total columns using the kernels (vectors aF T IR and
aW F MD) shown in Fig. 1, and the total-column kernel ai d ealof an ideal remote-sounding system with aTi d eal=(111...1). For Sawe adapted a best-estimate variance-covariance matrix of the atmospheric CH4 variabilities. The relative vertical change of the diago-nal elements (variances) were adopted from results of the Karlsruhe Simulation Model
5
of the Middle Atmosphere (KASIMA). The absolute values of the variances were then scaled in order to reflect the total-column day-to-day variability found by our FTIR mea-surements (this procedure will be detailed with numbers in Sect. 4 below). For the o ff-diagonals (covariances) a Gaussian-shaped inter-layer correlation with length of 2.5 km was used. Thereby we end up with smoothing errors of 0.10% for FTIR and 0.14% for
10
SCIAMACHY WFMD, respectively. These errors are small relative to the bias found between FTIR and SCIMACHY WFMD, and relative to the differences in day-to-day scatter encountered for FTIR and WFMD, respectively during our intercomparisons of Sect. 4. For consistency reasons, we briefly state that we do not distinguish between smoothing errors of CH4 columns and XCH4, respectively, i.e., we are neglecting the
15
smoothing error contribution from the CO2retrieval (being part of the WFMD XCH4 re-trieval) throughout this paper. This simplification is valid because the natural variability of column averaged CO2is known to be significantly (≈ factor 4) smaller than for CH4 (Buchwitz et al., 2005a). All in all, our validation results are not impacted significantly by smoothing errors. In Sects. 4.1.2 and 4.2.2 we will add absolute numbers as to this
20
(small) smoothing-error effect on the bias and relative day-to-day scatter we obtained during our intercomparison study.
It is noteworthy, that the SCIAMACHY retrievals (and also the ground-based mea-surements) are perfectly sensitive down to the lower troposphere. This is indicated by the kernels in Fig. 1 showing numbers significantly above zero. This is due to the
25
near-infrared spectral domain utilized for the SCIAMACHY retrievals, and is advanta-geous over thermal-IR satellite retrievals which are showing a reduced sensitivity in the boundary layer.
ACPD
5, 2269–2295, 2005 Validation of SCIAMACHY columnar methane by Zugspitze FTIR R. Sussmann et al. Title Page Abstract Introduction Conclusions References Tables Figures J I J I Back CloseFull Screen / Esc
Print Version Interactive Discussion
EGU
4. Validation results
4.1. Overall bias
4.1.1. Correlative study FTIR versus WFMD: bias
Figure 2a shows all SCIAMACHY WFMD XCH4data currently available (i.e., versions 0.4 and 0.41). Each SCIAMACHY data point is the average of all pixels from one
5
day within a 2000-km radius around the Zugspitze. Cloud flagged pixels have been removed, and we restricted the WFMD data to a maximum threshold of 10% in the individual retrieval errors reported. Additionally, a flag for erroneous retrievals had been added with the version 0.41 release, and, subsequently, we excluded all error-flagged data for both versions (i.e., 0.4 and 0.41) for this study. Zugspitze FTIR daily-mean
10
XCH4 data are shown in the same plot. A 3rd order polynomial fit to the FTIR data nicely shows the XCH4annual cycle with a ≈1.6% amplitude.
In order to obtain the bias of the SCIAMACHY WFMD data relative to the FTIR data we normalized the SCIAMACHY data by the 3rd order polynomial fit to the FTIR data. The result is shown in Fig. 2b. Note, that we do not investigate pairwise
“co-15
incidences”, as performed in many validation studies. Rather, we herewith propose the approach of fitting a polynomial to the reference series (FTIR) that is subsequently used as a reference. This approach allows to compare time series even in case of alternating time-gaps, which would not allow for the use of “coincidences”. This is par-tially the case for our time series of SCIAMACHY (measurement gaps due to
decon-20
tamination phases) and FTIR (measurement gaps due to the clear-sky requirement). From Fig. 2b we retrieve an overall XCH4bias for WFMD v0.4/FTIR=1.008±0.019 and WFMD v0.41/FTIR=1.058±0.008. The statistical errors of the biases given are 3× standard deviation/sqrt(n), where n=126 is the number of the WFMD data points.
ACPD
5, 2269–2295, 2005 Validation of SCIAMACHY columnar methane by Zugspitze FTIR R. Sussmann et al. Title Page Abstract Introduction Conclusions References Tables Figures J I J I Back CloseFull Screen / Esc
Print Version Interactive Discussion
4.1.2. Estimate of intercomparison error: impact on bias
We briefly want to estimate, whether the bias of 5.8% found for WFMD v0.41 can be partially affected by the slightly differing averaging kernels, and the different a priori profiles used for FTIR and WFMD, respectively. Therefore, we calculated the term aTF T IR(xaF T IR–xaW F MD)/total column=0.74% and the analogous term, i.e.,
5
aTW F MD(xaW F MD–xaF T IR)/total column=0.93%, where a are the total-column averag-ing kernel vectors and xaare the vectors of the a priori profiles. The numbers obtained indicate that the effect from slightly differing a priori profiles and averaging kernels is only a minor contribution to the observed bias of WFMD v0.41.
4.2. Time-dependent bias, precision, and variability
10
4.2.1. Precision and variability of the FTIR column data set
Figure 3 shows the FTIR data set (together with WFMD v0.4, WFMD v0.41), but now plotted as anomaly, i.e., the daily mean data are normalized with respect to their overall average. First, is obvious that the FTIR data are monitoring a sinusoidal annual cycle with a ≈1.6% amplitude. The dominant cause for this is the corresponding annual
15
cycle of the tropopause altitude. Second, it is obvious that the FTIR daily-mean data are showing some scatter of ≈1% around this sinusoidal cycle. We will show below that this variability is not caused by limited precision of the FTIR measurements but is dominated by the true atmospheric day-to-day variability caused by the dynamic effect of planetary-wave activity.
20
In the following we want to investigate statistical parameters describing the scatter of the FTIR data in detail. Table 1 gives in the first 3 columns the statistical numbers describing the “individual” (FTIR) measurements within one measurement day. On av-erage over the ensemble of i=133 FTIR measurement days, 12.3 FTIR column mea-surements have been performed per day. As a measure for the precision of individual
25
ACPD
5, 2269–2295, 2005 Validation of SCIAMACHY columnar methane by Zugspitze FTIR R. Sussmann et al. Title Page Abstract Introduction Conclusions References Tables Figures J I J I Back CloseFull Screen / Esc
Print Version Interactive Discussion
EGU measurements of each day is given in Table 1, i.e., AVi(σi)=1.3% for FTIR.
Further-more, as a measure for the statistical error for one FTIR daily-mean value, the overall average for the daily “standard deviations of the mean value”, i.e., AVi(σi/sqrt(ni)) cal-culated from the individual measurements is given in Table 1. AVi(σi/sqrt(ni)) equals 0.4% for FTIR.
5
Now we discuss the standard deviations calculated from the FTIR “daily-mean” data. Of course, prior to this calculation from the daily means, the FTIR time series has to be normalized with respect to its obvious annual cycle. See, e.g., Fig. 4 for the result of this normalization. Table 1 shows in column 4 that the resulting standard deviation for FTIR is 1%.
10
Finally, we want to discuss the obvious discrepancy between the standard deviations we calculated from the daily mean data (1% for FTIR, see Table 1), and the average statistical error of the daily means calculated from the individual measurements, which is AVi(σi/sqrt(ni))=0.4% for FTIR. Clearly the numbers indicate, that the standard de-viation of 1% obtained from the FTIR daily means is dominated by true atmospheric
15
day-to-day-variability due to tropopause movements, and not by the statistical error (due to limited single-measurement precision) which is only AVi(σi/sqrt(ni))=0.4%. 4.3. Estimate of intercomparison error: impact on variability
Here we like to address the question, to which degree possible differences in the day-to-day variability observed by the FTIR and WFMD, respectively might be attributed to
20
smoothing errors. In the following we present a simple but quantitative estimate for FTIR and WFMD retrievals.
We write the variance of daily-mean total columns colF T IR observed by FTIR as σ2(colF T IR)=aTF T IR SaaF T IR + σ2(εF T IR), where vector aF T IR is the total-column averaging kernel, and Sa is the a priori variance-covariance matrix described in
25
Sect. 3 above. The term aTF T IR Sa aF T IR describes the variance due to the true variability of the atmosphere, smoothed by the measurement. By the second term
ACPD
5, 2269–2295, 2005 Validation of SCIAMACHY columnar methane by Zugspitze FTIR R. Sussmann et al. Title Page Abstract Introduction Conclusions References Tables Figures J I J I Back CloseFull Screen / Esc
Print Version Interactive Discussion
σ2(εF T IR), we denote all further contributions which do not originate from the true variability of the atmosphere, i.e., contributions due to any kind of random-type measurement errors. Using σ(colF T IR)=1% from Table 1, and using for the er-ror term σ(εF T IR)=AVi(σi/sqrt(ni))=0.4% (see Table 1), we find that it should hold sqrt(aTF T IRSaaF T IR)/total column=0.92%. We now use aF T IR of Fig. 1 and scaleSa to
5
fulfil this relation. (See Sect. 3 for the adopted principle shape ofSa.) Using the result-ing best-estimateSa we calculate for WFMD analogously sqrt(aTW F MDSaaW F MD)/total column=0.93%. For an ideal observing system with aTi d eal=(111. . . 1) we would obtain sqrt(aTi d ealSa ai d eal)/total column=0.94%. These numbers tell us that FTIR is under-estimating the true variability by a factor of 0.92/0.94=0.98 and WFMD by a factor of
10
0.93/0.94=0.99 due to the smoothing effect. These underestimations are both similar to each other, and small in absolute terms. This means that possible differences in the day-to-day variability observed by the FTIR and WFMD, respectively (as discussed in the next Section) do not contain significant contributions from smoothing errors.
4.3.1. Correlative study FTIR versus WFMD: Time-dependent bias, precision, and
15
variability
Figure 2b shows that the time-dependent bias correction introduced with version 0.41 for XCH4 WFMD, in order to account for the icing issue, did result in a significant re-duction in the time dependence of the bias relative to version 0.4. This holds for both the time dependencies on the monthly scale, i.e., in between the various
decontami-20
nation phases (marked by red vertical lines in Fig. 2b), as well as for the overall time dependence of the bias on the annual scale, as indicated by the linear fits in Fig. 2b.
Figure 3 again shows the three data sets (FTIR, WFMD v0.4, WFMD v0.41) but now plotted as anomalies, i.e., each data set is normalized with respect to its overall av-erage. This shows even more obvious than Fig. 2a, that the changes associated with
25
the version 0.41 update succeeded in significantly reducing the time-dependent bias compared to version 0.4. However, Fig. 3 also shows, that there is still a residual time
ACPD
5, 2269–2295, 2005 Validation of SCIAMACHY columnar methane by Zugspitze FTIR R. Sussmann et al. Title Page Abstract Introduction Conclusions References Tables Figures J I J I Back CloseFull Screen / Esc
Print Version Interactive Discussion
EGU dependence also in the version 0.41 data, which is clearly related to the
decontamina-tion cycles.
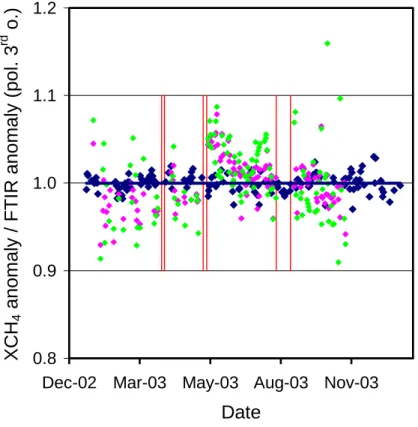
Figure 4 shows the WFMD v0.41 daily data both averaged for a selection radius of 1000 km around Zugspitze, as well as for a 2000-km radius. Note, that in Fig. 4 all three data sets have additionally been normalized to the annual cycle, i.e., the 3rd
5
order polynomial fit to the FTIR data shown in Fig. 3. Figure 4 shows that the scatter of the daily WFMD data clearly exceeds the scatter of the FTIR daily means. It can also be seen that the WFMD data for a 1000-km selection radius are showing a higher scatter compared to the WFMD data for a 2000-km selection radius, as expected.
The question arises whether the scatter of the WFMD data in Fig. 4 is limited by
10
systematic issues like a residual time-dependent bias due to the icing issue, or by the limited precision of the individual column retrievals, i.e., the limited signal-to-noise ratio of the SCIAMACHY spectra. This is further investigated in Fig. 5a. We restrict here to SCIAMACHY data out of one uninterrupted measurement period between two decontamination phases, i.e., the period 25 May–12 August 2003. We haven chosen
15
this time period, because here a systematic time dependence of WFMD-selection-radius-2000-km data can be most clearly identified, see Fig. 5a. Figure 5a shows a polynomial (2nd order) fit to this time dependence of the WFMD-selection-radius-2000-km data, which reflects a residual time-dependent bias of ≈3%/month. In Fig. 5b the WFMD data (both for 1000-km and 2000-km selection radii) are empirically normalized
20
to this time dependence.
Having eliminated all residual systematic time dependence on an empirical best-effort basis (Fig. 5b), the next step is to investigate the statistical parameters describ-ing the scatter of the WFMD version 0.41 data in comparison to the scatter of FTIR data in full detail. First, Table 1 gives the statistical numbers describing the
“individ-25
ual” measurements for FTIR and WFMD v0.41. While the number of days for which FTIR data exist (133) is comparable to the number of data for which WFMD data exist, Table 1 shows that average AVi(ni) of the number ni of daily measurements are quite different, i.e., 12.3 FTIR measurements per day on average versus 249 and 85
indi-ACPD
5, 2269–2295, 2005 Validation of SCIAMACHY columnar methane by Zugspitze FTIR R. Sussmann et al. Title Page Abstract Introduction Conclusions References Tables Figures J I J I Back CloseFull Screen / Esc
Print Version Interactive Discussion
vidual WFMD measurements per day for a 2000-km and a 1000-km selection radius, respectively. As a measure for the precision of the individual measurements AVi(σi), i.e., the overall average of the standard deviations of the individual measurements of each day is given in Table 1. The precisions are quite different, i.e., AVi(σi)=1.3% for FTIR, and a factor of 4 lower precisions are encountered for WFMD, i.e., AVi(σi) equals
5
5.2% and 5.4% for calculation of AVi(σi) from the 2000-km and 1000-km selection en-sembles, respectively. Note, that the WFMD single-measurement standard deviations are nearly identical (5.2 versus 5.4%), i.e., nearly independent on the size of the se-lected ensemble (1000-km versus 2000-km selection radius), as expected for an ideal random ensemble. Furthermore, as a measure for the statistical error for one daily
10
mean value, the overall average for the daily “standard deviations of the mean value”, i.e., AVi(σi/sqrt(ni)) calculated from the individual measurements is given in Table 1. AVi(σi/sqrt(ni)) equals 0.4% for FTIR, and for WFMD 0.6% and 0.3% for the 1000-km and the 2000-km selection radii, respectively. Note again, that this factor-of-two reduc-tion of AVi(σi/sqrt(ni)) on doubling the selection radius nicely reflects what we would
15
expect for an ideal statistical ensemble. This confirms our assumption of Sect. 3, that the possible effect that also source and sink regions may be more and more included into the ensemble while increasing the selection radius might potentially compensate for the intended reduction of the standard deviation of the daily mean value (by in-creasing the selection radius), is quantitatively negligible. All in all we have found with
20
a selection radius somewhere between 1000–2000 km the threshold, where the statis-tical errors of WFMD-daily-mean data become comparable to the ones of the FTIR, i.e. in the order of 0.5%. Note, that we had obtained a related result validating the species CO in our recent work (Sussmann and Buchwitz, 2005b).
Now we discuss the standard deviations calculated from the daily mean data. Table 1
25
shows in column 5 and 6 the results with and without our empirical correction for a residual systematic time dependence (see Figs. 5a and b). As an important result, it can be seen from Table 1, that in fact the scatter of the WFMD-selection-radius-2000-km-data had been limited by a residual systematic time dependence. This results from
ACPD
5, 2269–2295, 2005 Validation of SCIAMACHY columnar methane by Zugspitze FTIR R. Sussmann et al. Title Page Abstract Introduction Conclusions References Tables Figures J I J I Back CloseFull Screen / Esc
Print Version Interactive Discussion
EGU the finding that the standard deviation of daily means could be reduced from 2.4% to
1.6% by our simple and merely illustrative empirical time-dependent bias correction of Fig. 5b.
Finally, we want to discuss the obvious discrepancy between the standard devia-tions we calculated from the daily-mean data (1% for FTIR and 1.6% for
2000-km-5
WFMD after correcting for annual cycle and time-dependent bias, see Table 1), and the average statistical errors of the daily means calculated from the individual measure-ments, which is AVi(σi/sqrt(ni))=0.4% for FTIR, and AVi(σi/sqrt(ni))=0.3% for 2000-kmWFMD, and AVi(σi/sqrt(ni))=0.6% for 1000-kmWFMD, see Table 1. Interpretation is easy for FTIR, where no time-dependent drift is expected. Here clearly the
num-10
bers indicate that the standard deviation of 1% obtained from the FTIR daily means is dominated by true atmospheric day-to-day-variability due to tropopause movements, and not by the statistical error (due to limited single-measurement precision) which is only AVi(σi/sqrt(ni))=0.4%. Interpretation for the satellite data is not so straight for-ward. Here, we have to stress that the statistical error for a daily mean value, i.e.,
15
AVi(σi/sqrt(ni)) is calculated from the individual measurement data obtained during the individual measurement days, i.e., it can in principle not describe time-dependent drifts on the weekly or monthly scale. Therefore the conclusion from our statistical numbers given above can only be, that WFMD data have the potential – as to their pre-cision – to retrieve natural variabilities down to the 0.3% level for a 2000 km-selection
20
radius and down to the 0.6% level for a 1000-km selection radius “if” all systematic type time-dependent drifts would/could be eliminated.
5. Conclusions
Solar FTIR measurements at the Permanent Ground-Truthing Station Zugspitze (47.42◦N, 10.98◦E, 2964 m a.s.l.), Germany were used to validate the
EN-25
VISAT/SCIAMACHY Scientific Data Product for XCH4 retrieved at the University of Bremen, i.e., the near infrared WFM-DOAS version 0.4 and 0.41 products.
ACPD
5, 2269–2295, 2005 Validation of SCIAMACHY columnar methane by Zugspitze FTIR R. Sussmann et al. Title Page Abstract Introduction Conclusions References Tables Figures J I J I Back CloseFull Screen / Esc
Print Version Interactive Discussion
The averaging kernels of the ground-based FTIR technique turned out to be simi-lar shaped as the SCIAMACHY WFMD kernels, which both maintain a nearly uniform sampling down to the lower troposphere. Therefore, both a direct comparison of ab-solute column levels (bias) and the intercomparison of the day-to day-scatter is possi-ble without introducing significant intercomparison errors from smoothing errors, which
5
have been estimated to be below 0.10% for FTIR and 0.14% for SCIAMACHY WFMD retrievals, respectively.
In order to account for the altitude difference between the ground altitudes of the satellite pixels and the Zugspitze, XCH4columns have been used for both the satellite and ground-based data sets for the intercomparison. This approach eliminates the
10
effect of the altitude difference for the case of a constant volume mixing ratio throughout the altitude range to be accounted for. This assumption should hold for the case of the lower tropospheric CH4profile within the per cent level.
Analysing the 2003-time series of the Zugspitze FTIR, we characterized the natural variability of XCH4. It displays a 1% day-to-day variability and a sinusoidal annual cycle
15
with a ≈1.6% amplitude which is both dominated by related tropopause movements. In order to obtain the bias of the SCIAMACHY WFMD data relative to the FTIR data we used a new approach, i.e., we did not investigate pairwise “coincidences” (satellite versus ground), which are limited in number in case of data series with time-gaps (e.g., decontamination phases, clear sky restrictions). Therefore, we fitted a
20
polynomial to the reference series (FTIR) that is subsequently used as a reference. We obtained an overall XCH4 bias for WFMD v0.4/FTIR=1.008±0.019 and WFMD v0.41/FTIR=1.058±0.008.
Finally, we investigated whether WFMD is capable of reflecting the natural atmo-spheric variability of XCH4 as characterized by FTIR. WFMD version 0.41 shows up
25
with a break through in data quality relative to version 0.4 due to an a-posteriori time-dependent bias correction, that is based on a channel-8 throughput analysis. However, version 0.41 is still not yet able to capture the natural day-to-day variability on the 1% level because the standard deviation calculated from the daily-mean values is 2.4%
ACPD
5, 2269–2295, 2005 Validation of SCIAMACHY columnar methane by Zugspitze FTIR R. Sussmann et al. Title Page Abstract Introduction Conclusions References Tables Figures J I J I Back CloseFull Screen / Esc
Print Version Interactive Discussion
EGU using averages within a 2000-km radius, and 2.7% for a 1000-km radius. We have
shown by a merely illustrative (additional) empirical time-dependent bias correction, that it is not the precision of the daily means, but the residual time-dependent bias of WFMD v0.41 (≈3%/month) what currently limits data quality – and that this can still be improved (e.g., from 2.4% to 1.6% by our illustrative empirical time-dependent bias
5
correction). From analysis of the statistics of the individual measurements, we have shown that WFMD data have the potential – as to their pure precision, i.e., neglect-ing any time-dependent biases – to retrieve natural variabilities down to the 0.3% level for averaging data within a 2000-km selection radius and down to the 0.6% level for a 1000-km selection radius “if” all systematic type time-dependent drifts would/could
10
be eliminated. This means that the XCH4 atmospheric day-to-day variability and the annual cycle can be captured under the prerequisite of further successful advanced time-dependent bias corrections, or possibly the use of other channels, where the icing issue might be less prominent.
Acknowledgements. The authors like to thank A. Rockmann (IMK-IFU) for maintaining the
15
Zugspitze FTIR measurements. Funding by BMBF/DLR as part of the German SCIAMACHY validation program (GCVOS) via contract DLR 50 EE 0007 and by the EC within the project UFTIR (contract EVK2-CT-2002-00159) is gratefully acknowledged. This work is contributes to the ESA-ENVISAT-Validation-Project TASTE and is part of the EC-Network of Excellence ACCENT-TROPOSAT-2.
20
References
Bovensmann, H., Burrows, J. P., Buchwitz, M., Frerick, J., No ¨el, S., Rozanov, V. V., Chance, K. V., and Goede, A.: SCIAMACHY – Mission Objectives and Measurement Modes, J. Atmos. Sci., 56, 127–150, 1999.
Buchwitz, M. and Burrows, J. P.: Retrieval of CH4, CO, and CO2 total column amounts from
25
SCIAMACHY near-infrared nadir spectra: Retrieval algorithm and first results, in Proc. SPIE 5235, Remote Sensing of Clouds and the Atmosphere VIII, edited by: Sch ¨afer, K. P., Com-eron, A., Carleer, M. R., and Picard, R. H., 375–388, 2004.
ACPD
5, 2269–2295, 2005 Validation of SCIAMACHY columnar methane by Zugspitze FTIR R. Sussmann et al. Title Page Abstract Introduction Conclusions References Tables Figures J I J I Back CloseFull Screen / Esc
Print Version Interactive Discussion
Buchwitz, M., de Beek, R., Burrows, J. P., Bovensmann, H., Warneke, T., Notholt, J., Meirink, J. F., Goede, A. P. H., Bergamaschi, P., K ¨orner, S., Heimann, M., Muller, J.-F., and Schulz, A.: Atmospheric methane and carbon dioxide from SCIAMACHY satellite data: initial compari-son with chemistry and transport models, Atmos. Chem. Phys., 5, 941–962, 2005a,
SRef-ID: 1680-7324/acp/2005-5-941.
5
Buchwitz, M., de Beek, R., No ¨el, S., Burrows, J. P., Bovensmann, H., Bremer, H., Bergamaschi, P., K ¨orner, S., and Heimann, M.: Carbon monoxide, methane and carbon dioxide columns retrieved from SCIAMACHY by WFM-DOAS: Year 2003 initial data set, Atmos. Chem. Phys. Discuss., 5, 1943–1971, 2005b,
SRef-ID: 1680-7375/acpd/2005-5-1943.
10
Clerbaux, C., Hadji-Lazaro, J., Turquety, S., Megie, G., and Coheur, P.-F.: Trace gas measure-ments from infrared satellite for chemistry and climate applications, Atmos. Chem. Phys., 3, 1495–1508, 2003,
SRef-ID: 1680-7324/acp/2003-3-1495.
ESA: Proceedings of the Second Workshop on the Atmospheric Chemistry Validation of
EN-15
VISAT (ACVE-2), 3–7 May 2004, ESA-ESRIN, Frascati, Italy, SP-562, ISBN 92-9092-873-5, ESA Publications Division, ESTEC, The Netherlands, 2004.
IPCC, IPCC Third Assessment: Climate Change 2001, The Scientific Basis, Intergovernmental Panel of Climate Change, 2001 (http://www.ipcc.ch/).
Kobayashi, H., Shimota, A., Kondo, K., Okumura, E., Kameda, Y., Shimoda, H., and Ogawa,
20
T.: Development and evaluation of the Interferometric Monitor for Greenhouse Gases: a high throughput Fourier transform infrared radiometer for nadir Earth observations, Appl. Opt., 38, 6801–6807, 1999.
Rinsland, C. P., Boughner, R. E., Larsen, J. C., Stokes, G. M., and Brault, J. W.: Diurnal variations of atmospheric nitric oxide: ground-based infrared spectroscopic measurements
25
and their interpretation with time dependent photochemical model calculations, J. Geophys. Res., 89, 9613–9622, 1984.
Rodgers, C. and Connor, B. J.: Intercomparison of remote sounding instruments, J. Geophys. Res., 108, doi:10.1029/2002JD002299, 2003.
Rothmann, L. S., Barbe, A., Benner, D. C., Brown, L. R., Camy-Peyret, C., Carleer, M. R.,
30
Chance, K., Clerbaux, C., Dana, V., Devi, V. M., Fayt, A., Flaud, J. M., Gamache, R. R., Goldman, A., Jacquemart, D., Jucks, K. W., Lafferty, W. J., Mandin, J. Y., Massie, S. T., Nemtchinov, V., Newnham, D. A., Perrin, A., Rinsland, C. P., Schroeder, J., Smith, K. M.,
ACPD
5, 2269–2295, 2005 Validation of SCIAMACHY columnar methane by Zugspitze FTIR R. Sussmann et al. Title Page Abstract Introduction Conclusions References Tables Figures J I J I Back CloseFull Screen / Esc
Print Version Interactive Discussion
EGU
Smith, M. A. H., Tang, K., Toth, R. A., Vander Auwera, J., Varanasi, P., and Yoshino, K.: The HITRAN molecular spectroscopic database: edition of 2000 including updates through 2001, J. Quant. Spectrosc. Radiat. Transfer, 82, 5–44, 2003.
Sussmann, R. and Sch ¨afer, K.: Infrared spectroscopy of tropospheric trace gases: combined analysis of horizontal and vertical column abundances, Appl. Opt., 36, 735–741, 1997.
5
Sussmann, R.: Ground-based Fourier transform spectrometry at the NDSC site Zugspitze: Geophysical products for satellite validation, in: Proceedings of the European Symposium on Atmospheric Measurements from Space, ESTEC, Noordwijk, The Netherlands, 18–22 Jan 1999, WPP-161, Vol. 2, 661–664, 1999.
Sussmann, R. and Buchwitz, M.: Validation of ENVISAT/SCIAMACHY columnar CO by FTIR
10
profile retrievals at the Ground-Truthing Station Zugspitze, Atmos. Chem. Phys. Discuss., 5, 1–16, 2005,
SRef-ID: 1680-7375/acpd/2005-5-1.
Washenfelder, R. A., Wennberg, P. O., and Toon, G. C.: Tropospheric methane retrieved from ground-based near-IR solar absorption spectra, Geophys. Res. Lett., 30(23), 2226,
15
doi:10.1029/2003GL017969, 2003.
Zander, R., Demoulin, Ph., Ehhalt, D. H., and Schmidt, U.: Secular Increase of the Vertical Column Abundance of Methane Derived from IR Solar Spectra Recorded at the Jungfraujoch Station, J. Geophys. Res., 94, 11 029–11 039, 1989.
ACPD
5, 2269–2295, 2005 Validation of SCIAMACHY columnar methane by Zugspitze FTIR R. Sussmann et al. Title Page Abstract Introduction Conclusions References Tables Figures J I J I Back CloseFull Screen / Esc
Print Version Interactive Discussion
Table 1. Statistics of XCH4 data scatter for FTIR and WFMD v0.41 measurements and time
periods as indicated in Fig. 5. The index for the number of measurement days is i . First column: AVi(ni), i.e., average of the numbers ni of individual measurements during each measurement
day. Second column: AVi(σi), i.e., average of the “single-value standard deviations”
calcu-lated from the individual measurements for the different days. 3rd column: AVi(σi/sqrt(ni)), i.e.,
average of the “standard deviations of the daily mean values” calculated from the individual measurements for the different days. 4th column: Standard deviations of daily means calcu-lated from the daily-means data sets as shown in Fig. 5a, i.e., normalized to the annual cycle (polynomial fit to FTIR). 5th column: Standard deviations of daily means calculated from the daily-means data sets as shown in Fig. 5b, i.e., after applying an empirical time-dependent bias-correction (polynomial fit to WFMD v0.41). SCIAMACHY data were taken within a 2000-km pixel-selection radius around the Zugspitze for each day (“SCIA 2000”), and a 1000-2000-km selection radius (“SCIA 1000”), respectively.
AVi(ni) AVi(σi) AVi(σi/sqrt(ni)) σ of daily means σ of daily means incl. corrected for empirical time-dependent ann. cycle (Fig. 5a) bias correction (Fig. 5b)
Zugspitze FTIR 12.3 1.3% 0.4% 1.0% –
SCIA 2000 249 5.2% 0.3% 2.4% 1.6%
ACPD
5, 2269–2295, 2005 Validation of SCIAMACHY columnar methane by Zugspitze FTIR R. Sussmann et al. Title Page Abstract Introduction Conclusions References Tables Figures J I J I Back CloseFull Screen / Esc
Print Version Interactive Discussion EGU 0 100 200 300 400 500 600 700 800 900 1000 0.0 0.2 0.4 0.6 0.8 1.0 1.2 1.4 1.6 1.8 2.0
CH4 Total Column Averaging Kernel
Pr essu re (h Pa) SCIA SZA=60° FTIR SZA=60° Uniform Sampling
Fig. 1. Total-column averaging kernels for Zugspitze FTIR (red line) and SCIAMACHY-WFMD
ACPD
5, 2269–2295, 2005 Validation of SCIAMACHY columnar methane by Zugspitze FTIR R. Sussmann et al. Title Page Abstract Introduction Conclusions References Tables Figures J I J I Back CloseFull Screen / Esc
Print Version Interactive Discussion 1400 1500 1600 1700 1800 1900 2000
Dec-02 Mar-03 May-03 Aug-03 Nov-03
Date XCH 4 ( ppbv) (a) 0.8 0.9 1.0 1.1 1.2 1.3
Dec-02 Mar-03 May-03 Aug-03 Nov-03
Date XCH 4 S C IA / X C H4 FTI R ( pol. 3 rd o. ) (b)
Fig. 2. (a) XCH4 daily-mean values plotted for FTIR (dark blue, incl. 3rd order polynomial fit)
and averages of all SCIAMACHY WFMD data for a 2000-km selection radius around Zugspitze for each day; v0.4 (azur) and v0.41 (pink). (b) SCIAMACHY XCH4 data (azur: v0.4, pink: v0.41) divided by the 3rd order polynomial fitted to the FTIR data taken from (a). SCIAMACHY decontamination phases are indicated by red vertical lines.
ACPD
5, 2269–2295, 2005 Validation of SCIAMACHY columnar methane by Zugspitze FTIR R. Sussmann et al. Title Page Abstract Introduction Conclusions References Tables Figures J I J I Back CloseFull Screen / Esc
Print Version Interactive Discussion EGU 0.8 0.9 1.0 1.1 1.2
Dec-02 Mar-03 May-03 Aug-03 Nov-03
Date
XCH
4anom
a
ly
Fig. 3. Dark blue points: Anomaly of Zugspitze FTIR XCH4 daily means. Dark blue line: 3rd
order polynomial fit to FTIR data. Azur points: Anomaly of SCIAMACHY WFMD v0.4 XCH4; average of all data within a 2000-km radius around Zugspitze for each day. Pink points: Same as azur points but for SCIAMACHY WFMD v0.41. SCIAMACHY decontamination phases are indicated by red vertical lines.
ACPD
5, 2269–2295, 2005 Validation of SCIAMACHY columnar methane by Zugspitze FTIR R. Sussmann et al. Title Page Abstract Introduction Conclusions References Tables Figures J I J I Back CloseFull Screen / Esc
Print Version Interactive Discussion 0.8 0.9 1.0 1.1 1.2
Dec-02 Mar-03 May-03 Aug-03 Nov-03
Date
XCH
4anom
aly /
FTI
R anomaly (
pol.
3
rdo.)
Fig. 4. Dark blue points: Zugspitze FTIR XCH4anomaly daily means normalized to the annual
cycle (i.e., the 3rd order polynomial of Fig. 3). Pink points: SCIAMACHY WFMD v0.41 XCH4 anomaly; average of all pixels within a 2000-km radius around Zugspitze for each day normal-ized to the annual cycle (i.e., the 3rd order polynomial of Fig. 3). Green points: Same as pink points but for a 1000-km selection radius around Zugspitze. SCIAMACHY decontamination phases are indicated by red vertical lines.
ACPD
5, 2269–2295, 2005 Validation of SCIAMACHY columnar methane by Zugspitze FTIR R. Sussmann et al. Title Page Abstract Introduction Conclusions References Tables Figures J I J I Back CloseFull Screen / Esc
Print Version Interactive Discussion EGU 0.90 0.92 0.94 0.96 0.98 1.00 1.02 1.04 1.06 1.08 1.10
Dec-02 Mar-03 May-03 Aug-03 Nov-03
Date XCH 4 anomaly / FTIR anomaly (pol. 3 rd o. ) (a) 0.90 0.92 0.94 0.96 0.98 1.00 1.02 1.04 1.06 1.08 1.10
Dec-02 Mar-03 May-03 Aug-03 Nov-03
Date XCH 4 anomaly / FTIR anomaly (pol. 3 rd o. ) (b) Fig. 5. (a) Same as Fig. 4 but SCIAMACHY data restricted to 25 May–12 August 2003 and
a polynomial fit performed to the SCIAMACHY data with selection radius 2000 km. (b) Same
as (a) but data normalized to the polynomial of (a). SCIAMACHY decontamination phases are indicated by red vertical lines.