HAL Id: hal-00303236
https://hal.archives-ouvertes.fr/hal-00303236
Submitted on 8 Jan 2008HAL is a multi-disciplinary open access
archive for the deposit and dissemination of sci-entific research documents, whether they are pub-lished or not. The documents may come from teaching and research institutions in France or abroad, or from public or private research centers.
L’archive ouverte pluridisciplinaire HAL, est destinée au dépôt et à la diffusion de documents scientifiques de niveau recherche, publiés ou non, émanant des établissements d’enseignement et de recherche français ou étrangers, des laboratoires publics ou privés.
Hourly resolved cloud modification factors in the
ultraviolet
H. Staiger, P. N. den Outer, A. F. Bais, U. Feister, B. Johnsen, L. Vuilleumier
To cite this version:
H. Staiger, P. N. den Outer, A. F. Bais, U. Feister, B. Johnsen, et al.. Hourly resolved cloud modifica-tion factors in the ultraviolet. Atmospheric Chemistry and Physics Discussions, European Geosciences Union, 2008, 8 (1), pp.181-214. �hal-00303236�
ACPD
8, 181–214, 2008 Hourly resolved cloud modification factors in the UV H. Staiger et al. Title Page Abstract Introduction Conclusions References Tables Figures ◭ ◮ ◭ ◮ Back CloseFull Screen / Esc
Printer-friendly Version Interactive Discussion
EGU Atmos. Chem. Phys. Discuss., 8, 181–214, 2008
www.atmos-chem-phys-discuss.net/8/181/2008/ © Author(s) 2008. This work is licensed
under a Creative Commons License.
Atmospheric Chemistry and Physics Discussions
Hourly resolved cloud modification
factors in the ultraviolet
H. Staiger1, P. N. den Outer2, A. F. Bais3, U. Feister4, B. Johnsen5, and
L. Vuilleumier6
1
German Meteorological Service, Freiburg, Germany (emeritus)
2
National Institute for Public Health and the Environment, Bilthoven, Netherlands
3
Aristotle University, Thessaloniki, Greece
4
German Meteorological Service, Lindenberg, Germany
5
Norwegian Radiation Protection Authority, Oesteraas, Norway
6
Federal Office of Meteorology and Climatology MeteoSwiss, Payerne, Switzerland Received: 4 December 2007 – Accepted: 4 December 2007 – Published: 8 January 2008 Correspondence to: H. Staiger ([email protected])
ACPD
8, 181–214, 2008 Hourly resolved cloud modification factors in the UV H. Staiger et al. Title Page Abstract Introduction Conclusions References Tables Figures ◭ ◮ ◭ ◮ Back CloseFull Screen / Esc
Printer-friendly Version Interactive Discussion
EGU
Abstract
Cloud impacts on the transfer of Ultraviolet (UV) radiation through the atmosphere can be assessed using a cloud modification factor (CMF). The total global solar irradiation has proven to be a solid basis to derive CMF’s for the UV radiation (UV CMF). Total global irradiance is frequently measured and forecasted by numerical weather
predic-5
tion systems. Its advantage compared to for instance cloud cover is that measured solar global irradiance contains already the effect of multiple reflection between cloud layers, reflection between the sides of the clouds, as well as the distinct difference whether the solar disc is obscured by clouds or not. In the UV range clouds decrease the irradiance to a lesser extent than in the visible and infrared spectral range; Rayleigh
10
scattering in the atmosphere yields a larger fraction of scatter radiation compared to that of light and infrared, hence, obscuring the solar disc will not totally block out the ir-radiation. Thus the relationship between CMF’s for solar radiation and for UV-radiation is not straight forwards, but will depend on e.g. the solar zenith angle (SZA) and wave-length band or action spectrum in the UV considered. Den Outer et al. (2005) provide
15
a UV CMF algorithm on a daily base accounting for these influences. It requires as input a daily CMF in total global radiation (SOL CMF) and the SZA at noon. The calcu-lation of SOL-CMF uses the clear sky algorithm of the European Solar Radiation Atlas to account for varying turbidity impacts. The algorithm’s capability to derive hourly UV CMF’s based on the SZA at the corresponding hour and its worldwide applicability
20
is validated using hourly resolved observational data retrieved from the databases of the COST-Action 726 on “Long term changes and climatology of UV radiation over Eu-rope” and the USDA UV-B Monitoring and Research Program. The model performance for hourly resolution is shown to be comparable in absolute and relative deviations from a measured mean smoothed dependent on SZA with the well performing daily models
25
ACPD
8, 181–214, 2008 Hourly resolved cloud modification factors in the UV H. Staiger et al. Title Page Abstract Introduction Conclusions References Tables Figures ◭ ◮ ◭ ◮ Back CloseFull Screen / Esc
Printer-friendly Version Interactive Discussion
EGU
1 Introduction
Clouds may have a dramatic effect on the ultraviolet radiation (UV) reaching the earth surface ranging from almost complete extinction under heavy thunderstorms to en-hancements of a factor of two or more. Compared to the other UV irradiation deter-mining factors, like total ozone column (TOC), aerosols and ground albedo, the cloud
5
effects are not as well modelled from first principals. This can be attributed to the given intrinsic difficulties in determining cloud characteristics (Calbo et al., 2005). UV, short-and long-wave radiation are affected by cloud cover, as well as cloud-type determined by cloud-top height, water content, and cloud droplet size distribution (Kuchinke and Nunez, 1999; Chen et al., 2000; Josefsson and Landelius, 2000; Cede et al., 2004),
10
whereas cloud-type variations can be as important as cloud cover in the actual radia-tion field.
Spinhirne and Green (1978) prove by radiative transfer theory that the relative in-fluence of cloud layers on UV and total global radiation is dependent primarily on the interaction of the cloud layer with the surrounding atmosphere and the underlying
sur-15
face, and that in general, increasing cloud thickness decreases UV transmission to a lesser degree than transmission in the visible spectral range, whereas variations in cloud height and surface albedo result in only small changes of the relative flux trans-mission. Furthermore, the ratio of total transmission of UV and global solar radiation through a cloud layer depends on the solar zenith angle (SZA). A wavelength
depen-20
dence of the cloud effects in the UV region has been shown by measurements (Seck-meyer et al., 1996) and has been physically interpreted by radiative transfer modelling (Kylling et al., 1997). Cloud induced scattering coupled with molecular or particulate absorption can result in a pronounced wavelength dependence of cloud attenuation (Mayer et al., 1998). Erlick et al. (1998) have examined the competing influences of
25
clouds and aerosols. When clouds are superimposed on an aerosol profile than the wavelength dependence is dominated by the effect of the cloud droplets if the optical depth of the aerosols is less than that of the cloud.
ACPD
8, 181–214, 2008 Hourly resolved cloud modification factors in the UV H. Staiger et al. Title Page Abstract Introduction Conclusions References Tables Figures ◭ ◮ ◭ ◮ Back CloseFull Screen / Esc
Printer-friendly Version Interactive Discussion
EGU Cloud effects on the transfer of radiation can be assessed using the cloud
modifica-tion factor (CMF), generally defined as the ratio between the irradiance in the cloudy sky and the irradiance for the same atmosphere but for cloud-free conditions. The first is either measured or modelled, while the latter is always modelled. Usually, a CMF in one wavelength regime that is easily measured or modelled is translated to a CMF in
5
the other wavelength regime of interest. A CMF includes effects as multiple reflection between cloud layers, and/ or reflection between the sides of the clouds in case of a partly clouded sky, as well as the distinct difference whether the solar disc is obscured by clouds or not. Hence, CMF is not a pure measure of cloud transmittance. Den Outer et al. (2005) have investigated the effects of clouds on UV and total global radiation in
10
the Netherlands based on measured daily erythemally effective UV doses and daily sums of total global irradiance. They developed an algorithm relating the daily CMF in the UV to that in the visible using the SZA at local noon to tune this relationship. Additionally, it was shown that this relationship also depends on the wavelength ranges considered in the UV. This algorithm is conform to the theoretical requirements and is
15
shown to be a generic approach.
Total global irradiance is frequently measured and it is forecasted in numerical weather prediction. Information on cloud optical parameters as liquid water content or droplet size distribution is not required which are less frequent available or as the droplet size distribution must be set in most cases from climatologies.
20
Applications require more often a higher temporal resolution than one day. This study validates the applicability of the algorithm of den Outer et al. (2005) on an hourly base using observational data of four European, and of two sites representing subtropical to tropical conditions and the southern hemisphere.
2 Observational data
25
The database of COST-Action 726 on “Long term changes and climatology of UV ra-diation over Europe” (www.cost726.org) provides measured hourly erythemally (CIE)
ACPD
8, 181–214, 2008 Hourly resolved cloud modification factors in the UV H. Staiger et al. Title Page Abstract Introduction Conclusions References Tables Figures ◭ ◮ ◭ ◮ Back CloseFull Screen / Esc
Printer-friendly Version Interactive Discussion
EGU effective UV at 4 European sites between 60 and 40◦N, allowing comparison with
mod-elled UV, and further ancillary data providing input for modelling. From the database of the USDA UV-B Monitoring and Research Program, Natural Resource Ecology Labora-tory, Colorado State University, Fort Collins, Co. 80523 (uvb.nrel.colostate.edu/UVB/), are downloaded measured erythemal UV and total global radiation for Everglades,
5
Florida/ USA, representing subtropical to tropical conditions, and Lauder, NZL, repre-senting pristine mid latitude conditions of the Southern Hemisphere.
2.1 Bergen, Norway
For the site Bergen, Norway, 60.38◦N, 5.33◦E, 45 m a.s.l. available data is erythemally effective UV measured by a multiband filter radiometer, model GUV, serial number
10
9270 from Biospherical Instruments Inc. The measurements are operated by the Nor-wegian Radiation Protection Authority (NRPA). Hourly erythemal UV is available for March 1999 to December 2002. The instrument is part of the Norwegian national UV-monitoring network (Johnsen et al., 2002). The radiometer has five detector channels in the UV with a spectral bandwidth of about 10 nm. A linear combination of the output
15
from the detector channels forms the basis for deriving CIE-effective UV doses. The absolute calibration is traceable to the Nordic Ozone Group international intercom-parison of global sky instruments in Tyl ¨osand, Sweden, 2000 (Paulsson and Wester, 2006). The instrument is calibrated once a year against a travelling standard GUV. The calibrations are maintained by NRPA.
20
As ancillary input for modelling are used hourly sums of total global radiation, and snow depth daily recorded at 06:00 UTC. The latter enables to calculate the effect of snow cover on the regional UV surface albedo, that otherwise is assumed to be 3%. TOC is interpolated from TOMS Version 8, level 3, ozone (http://toms.gsfc.nasa.gov/ ozone/ozone.html).
ACPD
8, 181–214, 2008 Hourly resolved cloud modification factors in the UV H. Staiger et al. Title Page Abstract Introduction Conclusions References Tables Figures ◭ ◮ ◭ ◮ Back CloseFull Screen / Esc
Printer-friendly Version Interactive Discussion
EGU 2.2 Potsdam, Germany
The site Potsdam, Germany, is located at 52.36◦N, 13.08◦E, 107 m a.s.l. The measure-ments are operated by the German Meteorological Service (DWD), Richard-Aßman-Observatory Lindenberg. Provided erythemally weighted UV for 2002 is measured by a Bentham DM150 double monochromator that became operational in the year 2000.
5
The instrument measures UV spectra in the range from 290 to 450 nm at time steps of 6 min. Calibration is based on standard lamps of the FEL1000W type, calibrated by the Physikalisch-Technische Bundesanstalt (PTB) in Germany. Erythemal UV radiation according to the CIE 1987 action spectrum was derived from the spectral scans by tak-ing account of the undersampltak-ing stepwidth of 5 nm in the UV-A region as compared
10
to steps of 0.5 nm in the UV-B, and summed to hourly doses referring to true solar time (TST) such that the hourly totals coincide with the sampling time of total global irradiance.
Hourly sums of total global radiation recorded in TST hours, daily averages of TOC based on Dobson and Brewer measurements, and daily observations of total snow
15
depth taken at 06:00 UTC were used as ancillary input data. Snow depth is applied to calculate the effect of snow cover on regional UV surface albedo that in the case of snow free conditions is assumed to be 3%. Additionally, hourly synoptic observations of cloud cover and type are available in three ceilings according to WMO code FM12. 2.3 Davos, Switzerland
20
The site Davos, Switzerland, is located at 46.78◦N, 9.68◦E, 1590 m a.s.l. UV erythe-mally weighted broadband irradiance has been measured continuously at the World Radiation Center (PMOD/WRC) at Davos since the end of 1995, using SolarLight 501A (SL501A) broadband UV radiometers. In addition to external ventilation and heating to keep the domes free of dew, snow and ice, the temperature of the SL501A
instru-25
ment body is stabilized to 25◦C. Measurements are performed automatically every 2 s, and 2 min averages are recorded. The SL501A have been calibrated annually by
ACPD
8, 181–214, 2008 Hourly resolved cloud modification factors in the UV H. Staiger et al. Title Page Abstract Introduction Conclusions References Tables Figures ◭ ◮ ◭ ◮ Back CloseFull Screen / Esc
Printer-friendly Version Interactive Discussion
EGU comparison with a Swiss reference SL501 at the WRC. The accuracy of the Swiss
reference is verified regularly at international intercomparisons. It initially took part in the WMO/STUK intercomparison in Helsinki, Finland, 1995. It was also compared to spectroradiometers at Garmisch-Partenkirchen, Germany, 1997, and participated in the 713 intercomparison at Thessaloniki, Greece, 1999, as well as the
COST-5
726 intercomparison at Davos in 2006. The absolute accuracy can be estimated to be within ±10%. Measured erythemal UV is available for years 1999 and 2002 in the COST 726 database.
The ancillary data used as modelling input are TOC measured at the nearby site Arosa, hourly sums of total global irradiation measured at Davos, and snow depth
10
recorded once a day at Davos itself and at the high altitude site Weissfluhjoch, 2540 m a.s.l., in the vicinity of Davos (horizontal distance less than 4 km). We verified that the increase in regional albedo due to snow at the site and/or at the surrounding mountains is better represented by the snow depths at Weissfluhjoch compared to a weighted average calculated from the provided snow depths of Davos and of
Weiss-15
fluhjoch.
For reasons given by Lindfors and Vuilleumier (2005), the single scattering albedo derived by the Global Aerosol Data Set, GADS (Koepke et al., 1997), appears too low for an inner alpine valley site clearly contrasted to the lowlands covered by the 5◦×5◦ spatially resolved GADS. Thus, for modelling the required single scattering albedo is
20
set to 0.9653 for summer and winter according to the aerosol type “continental clear (cc)”.
2.4 Thessaloniki, Greece
The site in Thessaloniki, Greece, is located at 40.63◦N, 22.96◦E, 60 m a.s.l. The mea-surements are operated by the Aristotle University Thessaloniki (AUTH). The
erythe-25
mally effective UV was produced by an erythemal detector of type YES UVB-1, which is operational since 1991. Although spectral UV measurements are available at the same location from two Brewer spectroradiometers, the erythemal detector has better
ACPD
8, 181–214, 2008 Hourly resolved cloud modification factors in the UV H. Staiger et al. Title Page Abstract Introduction Conclusions References Tables Figures ◭ ◮ ◭ ◮ Back CloseFull Screen / Esc
Printer-friendly Version Interactive Discussion
EGU temporal resolution (every 1 min) which allows more accurate calculation of hourly and
daily integrals. The detector is regularly calibrated against the two Brewer spectrora-diometers, and hence its stability in time is sufficiently controlled to within about ±7% (Bais et al., 2001; Garane et al., 2006). Measured erythemal UV is available for years 1999 and 2002.
5
The daily averaged total ozone column measured by the Brewer spectrophotome-ters, and hourly sums of solar global irradiation were supplied as ancillary input data. Snow covered terrain is very rare at Thessaloniki, thus the regional UV surface albedo is assumed to be 3%. The COST-726 modelling exercise (Koepke et al., 2006) has revealed that the single scattering albedo retrieved from GADS is too high for this site,
10
decisively influenced by urban aerosols. Thus the single scattering albedo is fixed to 0.83 based on Bais et al. (2005).
2.5 Everglades, Florida/USA
The site Everglades (Homestead), Florida/USA, is located at 25.38◦N, 80.68◦W, 0 m a.s.l. The measurements are operated by the Beard Research Center at
Ever-15
glades National Park in the frame of the USDA UV-B Monitoring network. Erythemally effective UV is measured by a YES UVB-1 Pyranometer. The network documents the stability of its broadband instruments through annual calibrations and annual re-characterisations of each instrument’s spectral response. Initial instrument character-isations were first established by submitting each of the network’s initial broadband
20
meters to the National Institute of Standards and Technology (NIST) for an evaluation of their cosine and spectral response.
A Yankee Environmental Systems seven channel Multi-Filter Rotating Shadow-Band Radiometer (MFRSR) is the base for measurements in the visible spectral range. Its seventh channel is an unfiltered broadband silicon diode detector providing total global
25
irradiation.
UV and visible measurements are made sequentially at each wavelength every 15 s and integrated into 3-min averages by an on-board computer. An hourly sum is
accu-ACPD
8, 181–214, 2008 Hourly resolved cloud modification factors in the UV H. Staiger et al. Title Page Abstract Introduction Conclusions References Tables Figures ◭ ◮ ◭ ◮ Back CloseFull Screen / Esc
Printer-friendly Version Interactive Discussion
EGU mulated from the 3 min means ±30 min around clock time UTC h. TOC is interpolated
from TOMS Version 8, level 3, ozone. The UV surface albedo is represented by the FMI MTW climatology (Tanskanen, 2004). Measured data for 2005 are retrieved from the database.
2.6 Lauder, New Zealand
5
The site Lauder (Alexandra), New Zealand, is located at 45.03◦S, 169.68◦E, 370 m a.s.l. and is in the used measurements of the UV and visible spectral range a site of the USDA UV-B Monitoring network. It is operated by the National Institute of Water and Atmospheric Research (NIWA). The NIWA’s atmospheric research site at Lauder is the charter southern hemisphere mid latitude site for the International
Net-10
work for the Detection of Stratospheric Change (NDSC) and is therefore a critical field calibration centre. For equipment and data processing see Sect. 2.5. Measured data for October 2004 to September 2005 are retrieved from the database.
TOC is interpolated from TOMS Version 8, level 3, ozone. Snow cover is commonly not expected at Lauder, thus, the FMI MTW UV surface albedo climatology (Tanskanen,
15
2004) is assumed to represent the conditions.
3 Modelling hourly erythemally effective UV
Modelling of hourly erythemally effective UV is based on DWD’s method for UV Index forecasting (Staiger and Koepke, 2005). It uses lookup tables to calculate a so-called large-scale UV Index, LS UVI, depending on SZA, TOC, the month of the year, and
20
10 zonal climatic belts between South and North Pole, cli belt. It is valid for mean sea level, clear sky, a UV surface albedo of 3%, the aerosol type “continental average” with an aerosol optical depth, AOD, at 550 nm of 0.20, and a single scattering albedo, SSA, at 300 nm of 0.9127. The dependencies on months and climatic belts account for sea-sonal and regional profiles of ozone, temperature, and pressure. This assures that the
ACPD
8, 181–214, 2008 Hourly resolved cloud modification factors in the UV H. Staiger et al. Title Page Abstract Introduction Conclusions References Tables Figures ◭ ◮ ◭ ◮ Back CloseFull Screen / Esc
Printer-friendly Version Interactive Discussion
EGU remainder deviations versus actual height profiles show an impact of less than 3% on
clear sky irradiances (Schwander et al., 1997; Reuder and Schwander, 1999). The UV Index, UVI, for current atmospheric conditions and the site altitude is calculated ad-justing LS UVI by factors accounting for AOD and SSA, F aod ssa, the altitude effect, F ae, the UV surface albedo, F alb, and for cloud modification, UV CMF:
5
UVI (d , t) = LS UVI (SZA(d , t), TOC(d , t), month, cli belt) ×F aod ssa (AOD(d , t), SSA(d , t), SZA(d , t)) ×F ae (ALT, AOD(d , t), SSA(d , t), SZA(d , t))
×F alb (ALB(d , t), ALT, AOD(d , t), SSA(d , t), SZA(d , t)) ×UV CMF (SOL CMF(d , t), SZA(d , t))
(1)
ALT indicates the altitude a.s.l., ALB the UV surface albedo, SOL CMF the cloud mod-ification factor in total global irradiance, d the date, and t the time of day. The lookup tables and the factors are calculated applying STAR (Ruggaber et al., 1994) in its neural network version (Schwander et al., 2001). STAR is a one dimensional multi-scattering
10
model allowing a detailed description of the atmospheric parameters and has been tested with good results (Koepke et al., 1998). Measurements are likely to underesti-mate the actual irradiance at high SZA. Models as STAR that apply pseudo-spherical geometry have been shown to produce higher irradiation for high SZA in particular in the UV-B compared to measurements (van Weele et al., 2000). In the COST-726
com-15
parison of modelled daily erythemal UV doses the effect could be seen in the relative differences (Koepke et al., 2006) especially for Bergen with a maximum noon SZA of 83◦. The logarithm of this relative effect ∆ps= (spherical–measured)/ measured can be fitted by ln(∆ps)=1.8912−47.9389 · µ+z153.5597 · µ 2 z−225.1133 · µ 3 z+114.3450 · µ 4 z (2) 20
where µz= cos(SZA). Equation (2) is used as an empirical adjustment of the modelled
doses to reduce the differences to measurements at high SZA.
The albedo of the soil is low in UV compared to that in the visible spectral range. An essential exception is snow that increases albedo also dramatically in the UV. Thus
ACPD
8, 181–214, 2008 Hourly resolved cloud modification factors in the UV H. Staiger et al. Title Page Abstract Introduction Conclusions References Tables Figures ◭ ◮ ◭ ◮ Back CloseFull Screen / Esc
Printer-friendly Version Interactive Discussion
EGU F alb is calculated based on the algorithm of Schwander et al. (1999) depending on
snow depth and snow age. Snow age is derived from variations in snow depth within the last 6 d.
AOD and SSA are not available from measurements. Hence, modelling applies sea-sonal and regional varying climatologies (Staiger and Koepke, 2005). AOD is taken
5
from a March 2000 to February 2005 climatology of MODIS monthly aerosol opti-cal depth at 550 nm (http://modis-atmos.gsfc.nasa.gov/MOD08 M3/). SSA applies the semi-annual values of GADS (Koepke et al., 1997) for a relative humidity of 70%. GADS has a spatial resolution of 5◦. Section 2 denotes the exceptions concerning Davos and Thessaloniki. Modelling is performed for the centre of the sampling hour of
10
observational data.
3.1 UV cloud modification factor
Den Outer et al. (2005) have constructed an algorithm to derive daily erythemally ef-fective UV CMF from the ratio of daily sums of measured to predicted clear sky total global irradiation, SOL CMF. The algorithm is based on spectral measurements of
ery-15
themally effective daily UV doses and daily sums of total global irradiation at Bilthoven, Netherlands, for the year 2001. Several improvements have been made (Bordewijk et al., 1995; den Outer et al., 2000 and 2005) eventually leading to a parameterisation given by:
UV CMF (SZA, SOL CMF) =1 − (1+p(SZA) · SOL CMF) −0.27
1− (1+p(SZA))−0.27 (3)
20
The parameter p controls the curvature of UV CMF compared to SOL CMF. It depends exclusively on the daily minimum (noon) SZA. Days sharing the same minimum SZA but at different locations still have the same normalised distribution of SZA in the daily course, hence, the parameterisation is a generic approach. It is constructed such that SOL CMF=1 implies UV cloudy=UV clear sky, and also allows for measured total
ACPD
8, 181–214, 2008 Hourly resolved cloud modification factors in the UV H. Staiger et al. Title Page Abstract Introduction Conclusions References Tables Figures ◭ ◮ ◭ ◮ Back CloseFull Screen / Esc
Printer-friendly Version Interactive Discussion
EGU global radiation even exceeding predicted clear sky. The SZA dependency of p is
orig-inally given for 6 bins. Now we have fitted these p values by a second order polynomial enabling to apply the algorithm in a continuous form, and to extrapolate to SZA’s less than the annual minimum at Bilthoven (28.67◦):
p(SZA)=7.02199−12.73738 · cos(SZA)+5.72619 · cos(SZA)2 (4)
5
A daily UV dose is largely controlled by the hours close to local noon. Hence, it is con-sidered possible to apply Eq. (3) in calculation of hourly UV CMF’s too, i.e. replacing the daily minimum SZA by that of the corresponding hour. This assumption is validated in this paper, and is intended to be a candidate to replace the current empiric cloud modification factors in DWD’s UV Index forecasting. Because the original daily
algo-10
rithm has to account for the whole day, including large SZA’s, it can be anticipated that an hourly application should result in slightly too high UV CMF’s for small SOL CMF’s. 3.2 Predicted total global radiation clear sky
The calculation of a SOL CMF requires a predicted total global irradiance clear sky valid for the same effective atmospheric conditions as measured total global
radia-15
tion but without clouds. Den Outer et al. (2000) give an algorithm that is based on data series taken at Bilthoven (Netherlands), Garmisch-Partenkirchen (Germany), and Thessaloniki (Greece). The given algorithm depends solely on the SZA. In modelling, sun-earth distance oscillations should be taken into account. Due to the exclusive de-pendency on SZA the algorithm can be regarded to include a mean annual course of
20
turbidity for Europe. When applied to high altitude sites a correction should be made, which is approximately 5% of the correction of UV-irradiance. A more physical ap-proach would be to replace this algorithm with the one used by the European Solar Radiation Atlas, ESRA (Greif and Scharmer, 2000), as given by Rigollier et al. (2000). This algorithm requires a Linke turbidity factor as input that is retrieved from the monthly
25
climatology of world wide Linke turbidity information (Remund et al., 2003). A linear in-terpolation dependent on the distance of a day to the middle of the months is performed
ACPD
8, 181–214, 2008 Hourly resolved cloud modification factors in the UV H. Staiger et al. Title Page Abstract Introduction Conclusions References Tables Figures ◭ ◮ ◭ ◮ Back CloseFull Screen / Esc
Printer-friendly Version Interactive Discussion
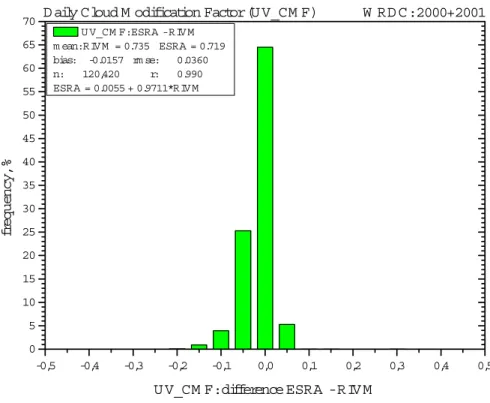
EGU applying the turbidity climatology. The frequency distribution of differences in UV CMF
resulting from the both clear sky algorithms applying Eq. (3) is shown by Fig. 1. It is based on measured daily sums of total global radiation of 183 sites over Europe in 2000 and 2001 provided by the WMO World Radiation Data Centre, St. Petersburg, Russia, in the framework of COST-726. The differences can be summarised to be
al-5
most unbiased (−0.016) and to show only low scattering (root mean square error of 0.036) compared to the total standard deviation in UV CMF’s (±0.23). The distribution is slightly left skewed due to the influence of high mountain sites (9 with altitudes above 1500 m, thereof 3 above 3000 m) and in lower parts due to Scandinavian sites showing turbidity less than the European average. This study is based on the version using the
10
ESRA algorithm to predict total global radiation clear sky.
4 Results and discussion
4.1 Clear sky modelling
The influence of using hourly UV CMF on modelling results can be separated by check-ing first the quality of clear sky modellcheck-ing. This is performed accumulatcheck-ing the hourly
15
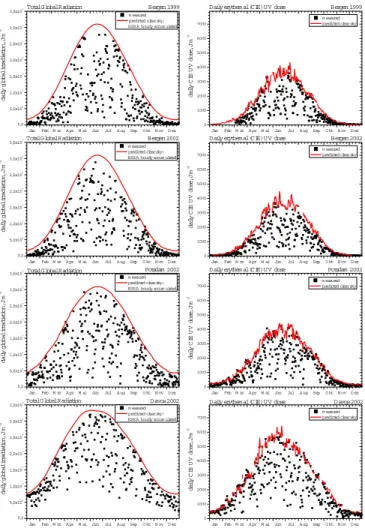
measured all sky and the modelled clear sky values to a daily dose and plot them in the yearly course, Fig. 2a and b. The clear sky sums should then be a close enve-lope of the highest measured daily sums. Clear sky daily total global irradiance shows a smooth annual course that is unchanged from year to year whereas clear sky daily erythemal UV doses reveal a stronger scattering in the annual course due to day to day
20
variations in TOC and its distinct differences from year to year, e.g. in Bergen, Fig. 2a. At Bergen the clear sky total global radiation envelops closely the highest measured daily sums with the exception of the winter months. Surrounding mountains restrict the horizon by up to 10◦at the site, especially in the east. Regarding maximum noon SZA’s greater than 80◦ this can significantly influence the daily sum and is not accounted for
25
ACPD
8, 181–214, 2008 Hourly resolved cloud modification factors in the UV H. Staiger et al. Title Page Abstract Introduction Conclusions References Tables Figures ◭ ◮ ◭ ◮ Back CloseFull Screen / Esc
Printer-friendly Version Interactive Discussion
EGU the plot. The horizon limitation will affect UV CMF via SOL CMF and thus will appear
in all sky modelling.
At Potsdam modelled clear sky total global radiation and daily UV doses are a close envelope to highest measured sums.
Only Davos 2002 is shown as Davos does not reveal general differences between
5
both years. The modelled clear sky sums can be regarded as close to the highest mea-sured. In the UV, there is a noticeable number of days with slightly higher measured than modelled clear sky UV doses especially in spring. These are affected by snow cover in the mountains influencing the regional albedo and not fully captured by the model. In December and January, the shading effect of surrounding mountains may be
10
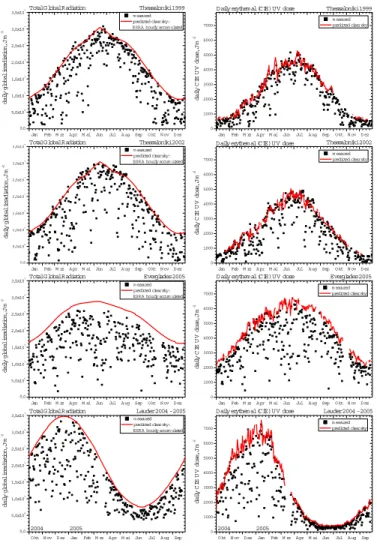
derived from modelled clear sky and highest measured sums of total global radiation. For Thessaloniki the monthly mean values of the Linke turbidity factor are much higher in May and July (∼6.0) compared to 4.5 in June and August. These increases in conjunction with the summer solstice and the applied linear interpolation are the reason for the disturbed annual course of the modelled clear sky daily total global radiation,
15
Fig. 2b. Consequently, for some days in the warm period, the measured total global radiation in Thessaloniki is slightly higher compared to modelled clear sky daily sums. The effect is minor in 1999 compared to that in 2002 (period May to August). In the UV, these effects are present too, but less pronounced. Moreover, the number of days with low measured daily sums is greater in summer 2002. This leads to the conclusion, that
20
the summer 2002 has been more frequently affected by advection of less turbid air. Considering the Everglades, the modelled daily sums of total global radiation overes-timates the highest measured sums somewhat especially in summer, Fig. 2b, although the applied monthly averages of the Linke turbidity factors are the highest within the sites. A reason could be an underestimation of water vapour over the wetlands having
25
water temperatures higher than the nearby ocean. By contrast, the modelled UV doses clear sky represent well the highest measured doses.
Modelled clear sky conditions at Lauder represent a close envelope to highest mea-sured daily sums with a tendency of slightly overestimated sums of total global radiation
ACPD
8, 181–214, 2008 Hourly resolved cloud modification factors in the UV H. Staiger et al. Title Page Abstract Introduction Conclusions References Tables Figures ◭ ◮ ◭ ◮ Back CloseFull Screen / Esc
Printer-friendly Version Interactive Discussion
EGU in southern winter.
4.2 All sky modelling
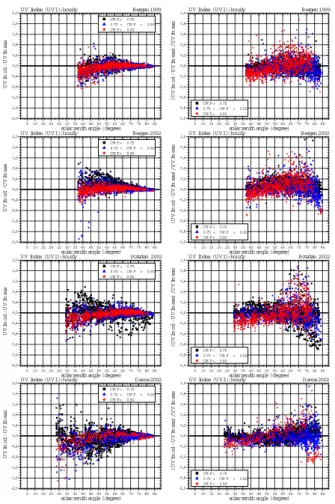
Figure 3 shows scatter plots of modelled versus measured hourly UV Index for the sites. A regression analysis has been performed for three bins of UV CMF’s. The black symbols and regression lines represents low attenuation of radiation by clouds,
5
CMF≥0.75, blue medium, 0.75>CMF≥0.50, and red strong attenuation, CMF<0.50. Scattering increases only slightly with increasing UVI. The maximum UVI at a site is highest for less clouded conditions and increases for decreasing latitude. However, it is comparable for Everglades and Lauder due to lowest sun – earth distance in southern summer, and for Davos and Thessaloniki due to the difference in altitude. The less
10
clouded conditions are represented by a regression slope close to the ideal value one. The exceptions are Everglades by reason of overestimated clear sky total global radia-tion and Bergen 2002 because of TOMS degradaradia-tion, showing a −2% to −4% error in latitudes higher than 50◦and a bit larger in the northern than the southern hemisphere. Unexpectedly, the regression slopes for higher clouded conditions are less than that
15
of only slightly clouded conditions. The exceptions are Lauder showing the anticipated slight increase in modelled UVI with decreasing UV CMF, and Thessaloniki 1999 with almost unchanged gradients and in contrast to 2002 having more frequent advection of less turbid air. This enables to conclude: Modelling applies an AOD climatology that is derived from measurements representing clear sky conditions. Clear skies are
20
more often found under high pressure systems with stable boundary layer and thus relative high aerosol load that is in Europe more frequently associated with absorbing aerosol types. Under stronger clouded situations and precipitation aerosol extinction by absorption is obviously reduced, however, modelling has not yet accounted for these effects. Hence, UV is underestimated for medium to low UV CMF in Europe. In the
25
clean air of Lauder almost no aerosol extinction by absorption can be expected and the higher modelled UVI for medium and low UV-CMF’s represents the effect applying Eq. (3) in an hourly resolution.
ACPD
8, 181–214, 2008 Hourly resolved cloud modification factors in the UV H. Staiger et al. Title Page Abstract Introduction Conclusions References Tables Figures ◭ ◮ ◭ ◮ Back CloseFull Screen / Esc
Printer-friendly Version Interactive Discussion
EGU The comparison of modelled and measured UVI for differing UV CMF at Lauder is
used to estimate the error applying Eq. (3) originally developed for daily doses in an hourly resolution. The analysis is restricted to the summer season, Oct 2004 to March 2005, to avoid influences of the potentially slightly overestimated total global radiation clear sky in winter months. Eq. (3) is developed based on measured daily sums at
5
Bilthoven. Thus, analysis is performed for SZA less than 75◦ representing the yearly maximum noon SZA at Bilthoven. With the exception of the clear sky bin, bins of UV CMF are selected to be represented by roughly comparable numbers of cases. For the resulting 5 bins the ratio of the regression slopes to that of the clear sky bin has been calculated and fitted:
10
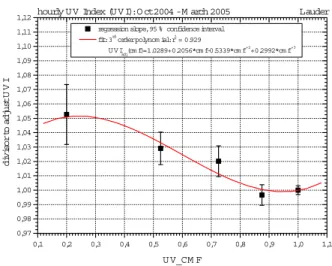
UVIadj(CMF)=1.0289+0.2056 · CMF−0.5339 · CMF 2
+0.2992 · CMF3 (5)
CMF=UV CMF. A modelled hourly UV Index applying the original daily algorithm can be up to 5% too high under strong radiation attenuation by clouds, Fig. 4, and can be adjusted for SZA<75◦ using Eq. (5) as divisor. Figure 4 shows that the fitted curve is within the 95% confidence interval of the 5 bins. Nevertheless the relative wide
confi-15
dence intervals lead to the conclusion, that the function can be only a rough estimate of the effective conditions.
4.3 Model performance
Clear sky modelling has proven to be of good quality. Thus, the main uncertainties in modelling will depend on cloud effects. Tables 1 and 2 summarises the comparison of
20
modelled and measured UVI for the individual sites and years. The root mean square error, RMSE, is 0.27 UV Index in total or 12.1% related to the mean of measurements. The bias, see column “absolute differences” of Table 2, is −0.04 UV Index or −1.7%. Bergen 2002 shows a positive bias due to TOC from degrading TOMS, Everglades a negative due to overestimated total global radiation clear sky. The relative RMSE
25
increases with latitude due to lower absolute values and to an increased likelihood for clouded conditions. The bias of Bergen 2002 and that of the Everglades contribute to
ACPD
8, 181–214, 2008 Hourly resolved cloud modification factors in the UV H. Staiger et al. Title Page Abstract Introduction Conclusions References Tables Figures ◭ ◮ ◭ ◮ Back CloseFull Screen / Esc
Printer-friendly Version Interactive Discussion
EGU the relative higher RMSE of the sites. The modelling of daily doses for the European
sites (Koepke et al., 2006) has resulted in a mean bias of +1.1% and a RMSE of 9.8% of the 7 best performing models. The slightly higher RMSE of UVI compared to that of the daily doses can be attributed to the higher temporal resolution. For Potsdam 2002 empiric hourly UV CMF’s (Staiger et al., 1998) has additionally been calculated based
5
on synoptic cloud observations. The resulting UVI has a bias of −0.02 UV Index and a RMSE of 31.8%, whereas the RMSE applying Eq. (3) for modelling is reduced to 13.5% for Potsdam. Using total global irradiation as an input parameter in determining UV CMF’s has the decisive advantages to take into account the effects whether the solar disc is obscured by clouds or not, and to include direct information on cloud
10
optical depth.
4.3.1 Comparison dependent on solar zenith angle
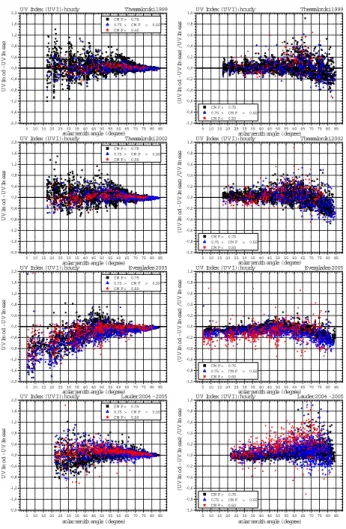
Figures 5a and b give the absolute differences (modelled minus measured) in UVI, and the relative related to measured UVI as a function of SZA for measured and modelled clear sky UVI≥0.10, and Table 2 the summarising statistics. The absolute differences
15
are of relevance in consideration of the essential UV effects. The relative differences consider percentage deviations and thus provide further insight into model quality for low absolute values. Again the symbols and their colours distinguish between low (black), medium (blue), and strong (red) radiation attenuation by clouds.
The scattering in the absolute differences increases with decreasing SZA, i.e.
in-20
creasing absolute UVI. The relative differences reveal a more or less constant scatter-ing for SZA less than about 60◦. For higher SZA scattering increases with increasing SZA which may be in parts due to the decreasing absolute values they are related to. The scattering in the relative differences is highest for the sites more frequently influ-enced by changes in cloudiness: Bergen, Potsdam, and Lauder. For Bergen 1999 the
25
scattering is somewhat reduced due to lacking measured UV for January and Febru-ary, i.e. low absolute UVI. The too high predicted total global radiation clear sky for Everglades particularly in summer is depicted by Fig. 5b in underestimated UVI in
ab-ACPD
8, 181–214, 2008 Hourly resolved cloud modification factors in the UV H. Staiger et al. Title Page Abstract Introduction Conclusions References Tables Figures ◭ ◮ ◭ ◮ Back CloseFull Screen / Esc
Printer-friendly Version Interactive Discussion
EGU solute and relative differences and by the summarising statistics, Table 2. For stronger
radiation attenuation by clouds UVI’s for low SZA are slightly underestimated for the European sites applying aerosol properties in modelling unchanged versus clear sky. 4.3.2 Taylor diagram
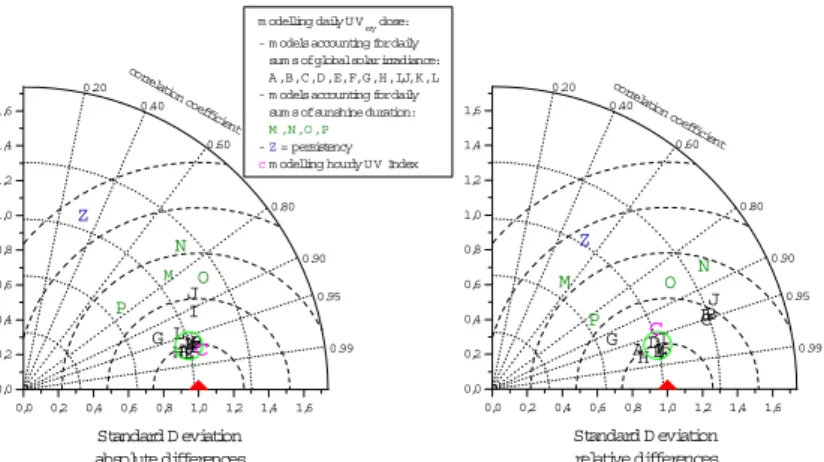
The modelling performance applying hourly resolved UV CMF based on Eq. (3) can
5
be checked versus the results of the COST-726 model intercomparison for daily ery-themally effective UV doses (Koepke et al., 2006). This has been done in terms of model to measurement correlation together with standard deviation of measured and modelled data and displayed in polar coordinates, as it has been proposed by Taylor (2001). The diagram has been developed to visualise the patterns of various
simula-10
tions of measured data in one diagram. The radial distance is given by the standard deviation normalised to the measured standard deviation, the angular position by the arccosine of the correlation coefficient, r. Thus, the position of the measured data is given by r=1 and the standard deviation 1, red triangles in Fig. 6. The individual simu-lation can be evaluated relative to the measurements by the pattern RMSE difference.
15
It is given by the vector from the point of the measurements to that representing the result of one model. The pattern RMSE difference approaches zero as two patterns becomes more alike. There is a strong dependency of modelled and measured UVI on SZA as it is for daily doses in the annual course that thus would yield a high correlation coefficient. To better distinguish between the performances of the different models,
20
the SZA dependence is removed using a smoothed SZA dependent average of the measurements. First the smoothed average is subtracted from the measured and the modelled UVI, resulting in two sets of deviations from the smoothed average, one for the observed and the other for the modelled UVI. The correlation for the Taylor diagram is computed between the two sets of UVI deviations. This procedure was repeated
25
for both absolute and relative differences to the smoothed average, but applied only to data where the measured UVI and the smoothed average were greater than 0.10. The smoothed average is calculated by sorting the measured UVI’s dependent on SZA
ACPD
8, 181–214, 2008 Hourly resolved cloud modification factors in the UV H. Staiger et al. Title Page Abstract Introduction Conclusions References Tables Figures ◭ ◮ ◭ ◮ Back CloseFull Screen / Esc
Printer-friendly Version Interactive Discussion
EGU for each site and year and using locally weighted regression scatter plot smoothing
(LOWESS) comprising a window of the next 12% of the data in SZA. The results for the hourly resolved UVI applying Eq. (3) are displayed in Fig. 6 (magenta coloured “C”) versus the COST-726 performance analysis for daily UV doses of 16 models. The absolute differences are within the group of the best performing daily models based
5
on daily sums of measured total global irradiation. The relative differences are very close to them. The results of the relative differences are somewhat sensible on the selected minimum for smoothed averages allowed in comparison. If it would approach zero than in general the relative difference would approach infinity which would improve the correlation coefficient.
10
5 Conclusions
Equation (3) has been shown to be applicable in a temporal resolution of one hour. It is a generic approach, i.e. it can be used world wide, presumed it applies an appropriate algorithm to predict clear sky total global irradiances accounting for long-term condi-tions of turbidity and its seasonal variacondi-tions at a location. Concerning RMSE and bias
15
the hourly application is comparable to that of daily resolution for which the algorithm originally has been developed. Applying the algorithm in hourly resolved UV CMF’s can strongly reduce RMSE compared to schemes based on cloud cover or sunshine dura-tion, because the SOL CMF includes information on cloud optical depth and whether the solar disc is obscured by clouds.
20
Current UVI forecasts of DWD apply 6 bins of empirical UV-CMF dependent on fore-casted cloudiness in layers low, middle, high. Numerical weather prediction (NWP) comprises physical parameterisation to calculate surface total global radiation. These parameterisations account for optical properties of forecasted cloudiness in all model layers. Applying NWP surface total global radiation in UVI forecasting via Eq. (3)
25
takes advantage of the higher vertical resolution and the computed radiation trans-fer in the visible spectral range and thus reduces computational cost by not
repeat-ACPD
8, 181–214, 2008 Hourly resolved cloud modification factors in the UV H. Staiger et al. Title Page Abstract Introduction Conclusions References Tables Figures ◭ ◮ ◭ ◮ Back CloseFull Screen / Esc
Printer-friendly Version Interactive Discussion
EGU ing these highly resolving calculations in the UV. Furthermore, it let benefit
automati-cally from each improvement in parameterisation of radiation transfer and in forecast-ing of cloudiness, e.g. by introduction of SZA dependent overlappforecast-ing of cloud lay-ers (Tompkins and Di Guiseppe, 2007), or the treatment of ice cloud optical prop-erties in DWD’s NWP operational radiation scheme (Ritter and Geleyn, 1992; Doms
5
and Sch ¨attler, 2003). In the future, daily assimilated and forecasted aerosol amount will be available for several aerosol types, e.g. as result of the EU funded GEMS project (http://www.ecmwf.int/research/EU projects/GEMS/index.jsp), and will enable to replace climatologies derived from clear sky conditions.
COST-726 is directed toward UV reconstruction. On a European scale it can neither
10
rely on measured daily values of turbidity nor on long term trends in aerosol proper-ties. However, available measured daily sums of total global irradiance will include deviations from climatological values in the calculated UV CMF. The relation between UV CMF and SOL CMF is functional but not linear. Thus modelling of clear sky total global irradiation and clear sky UV should rely on comparable assumptions of mean
15
turbidity and its seasonal variations to keep the increments due to aerosols as low as possible.
Acknowledgements. The study has been performed in the framework of the COST-Action 726 on “Long term changes and climatology of UV radiation over Europe”. The measurements of Everglades, Florida/ USA, and Lauder, New Zealand, have been accessed via the database
20
of the USDA UVB Monitoring and Research Program, Natural Resource Ecology Laboratory, Colorado State University, Fort Collins, Co. 80523. Via COST-726 the WMO World Radiation Data Centre, St. Petersburg, Russia, has made available daily sums of total global irradiation for Europe. The NASA Goddard Space Flight Center is thanked allowing public access to earth probe TOMS/V8, level 3 data of total column ozone.
25
References
Bais, A., Topaloglou, C., Kazadtzis, S., Blumthaler, M., Schreder, J., Schmalwieser, A., Hen-riques, D., and Janouch, M.: Report of the LAP/COST/WMO intercomparison of erythemal
ACPD
8, 181–214, 2008 Hourly resolved cloud modification factors in the UV H. Staiger et al. Title Page Abstract Introduction Conclusions References Tables Figures ◭ ◮ ◭ ◮ Back CloseFull Screen / Esc
Printer-friendly Version Interactive Discussion
EGU
radiometers, World Meteorological Organization (WMO), 54 pp., Geneva, 2001.
Bais, A. F., Kazantzidis, A., Kazadzis, S., Balis, D. S, Zerefos, C. S., and Meleti, C.: Deriving an effective aerosol single scattering albedo from spectral surface UV irradiance measurements, Atmos. Environ., 39, 1093–1102, 2005.
Bordewijk, J. A., Slaper, H., Reinen, H. A. J. M., and Schlamann, E.: Total solar radiation and
5
the influence of clouds and aerosols on the biologically effective UV, Geophys. Res. Lett., 22, 2151–2154, 1995.
Calbo, J., Pages, D., and Gonzales, J.-A.: Empirical studies of cloud effects on UV radiation: A review, Review of Geophysics, 43, 1–28, RG2002, doi:10.1029/2004RG000155, 2005. Cede, A., Luccini, E., Nunez, L., Piacentini, R. D., Blumthaler, M., and Herman, J. R.:
TOMS-10
derived erythemal irradiance versus measurements at the stations of the Argentine UV Mon-itoring Network, J. Geophys. Res., 109, 1–11, D08109, doi:10.1029/2004JD004519, 2004. Chen, T., Rossow, W. B., and Zhang, Y.: Radiative Efects of Cloud-Type Variations, J. Climate,
13, 264–286, 2000.
Den Outer, P. N., Slaper, H., Matthijsen, J., Reinen, H. A. J. M., and Tax, R.: Variability
15
of Ground-Level Ultraviolet: Model and Measurement, Radiat. Prot. Dosim., 91, 105–110, 2000.
Den Outer, P. N., Slaper, H., and Tax, R. B.: UV radiation in the Netherlands. Assessing long-term variability and trends in relation to ozone and clouds, J. Geophys. Res., 110, 1–11, D02203, doi:10.1029/2004JD004824, 2005.
20
Doms, G. and Sch ¨attler, U.: LM–Documentation 2nd version, Part II: Physical Parameterization,
1–133, available athttp://cosmo-model.cscs.ch/public/documentation.htm, 2003.
Erlick, C., Frederick, J. E., Saxena, V. K., and Wenny, B. N.: Atmospheric transmission in the ultraviolet and visible: Aerosols in cloudy atmospheres, J. Geophys. Res., 103, 31 541– 31 556, 1998.
25
Garane, K., Bais, A. F., Kazadzis, S., Kazantzidis, A., and Meleti, C.: Monitoring of UV spectral irradiance at Thessaloniki (1990–2005): Data re-evaluation and quality control, Ann. Geo-phys., 24(12), 3215–3228, 2006.
Greif, J., and Scharmer, K. (ed.): The European Solar Radiation Atlas, Vol. 2: Database,
Mod-els and Exploitation Software, ´Ecole des Mines de Paris, 1–296, France, 2000.
30
Johnsen, B., Mikkelborg, O., Hannevik, M., Nilsen, L. T., Saxebol, G., and Blaasaas, K. G.: The Norwegian UV Monitoring Network. Period 1995/96 to 2001, Norwegian Radiation Protection Authority, Straalevern Rapport 2002, 4, 1–41, 2002.
ACPD
8, 181–214, 2008 Hourly resolved cloud modification factors in the UV H. Staiger et al. Title Page Abstract Introduction Conclusions References Tables Figures ◭ ◮ ◭ ◮ Back CloseFull Screen / Esc
Printer-friendly Version Interactive Discussion
EGU
Joseffson, W. and Landelius, T.: Effect of clouds on UV irradiance: As estimated from cloud amount, cloud type, precipitation, global radiation and sunshine duration, J. Geophys. Res., 105, 4927–4935, 2000.
Koepke, P., Hess, M., Schult, I., and Shettle, E. P.: Global Aerosol Data Set, Max-Planck-Institut f ¨ur Meteorologie, Report No. 243, 1–44, 1997.
5
Koepke, P., Bais, A., Balis, D.; Buchwitz, M., De Backer, H., De Cabo, X., Eckert, P., Eriksen, P., Gillotay, D., Heikkil ¨a, A., Koskela, T., Lapeta, B., Litynska, Z., Lorente, J., Mayer, B., Renaud, A., Ruggaber, A., Schauberger, G., Seckmeyer, G., Seifert, P., Schmalwieser, A., Schwander, H., Vanicek, K., and Weber, M.: Comparison of Models Used for UV Index Calculations, Photochem. Photobiol., 67, 657–662, 1998.
10
Koepke, P., De Backer, H., Bais, A., Curylo, A., Eerme, K., Feister, U., Johnsen, B., Junk, J., Kazantzidis, A., Krzyscin, J., Lindfors, A., Olseth, J. A., den Outer, P., Pribullova, A., Schmalwieser, A. W., Slaper, H., Staiger, H., Verdebout, J., Vuilleumier, L., and Weihs, P.: Modelling solar UV radiation in the past: Comparison of algorithms and input data, P. SOC. PHOTO-OPT. INST. Remote Sensing of Clouds and the Atmosphere XI, 11–14 Sep 2006,
15
Stockholm, Sweden, SPIE 6362, 636215, 1–11, 2006.
Kuchinke, C. and Nunez, M.: Cloud Transmission Estimates of UV-B Erythemal Irradiance, Theor. Appl. Climatol., 63, 149–161, 1999.
Kylling, A., Albold, A., and Seckmeyer, G.: Transmittance of a cloud is wavelength-dependent in the UV-range: Phsysical interpretation, Geophys. Res. Lett., 24, 397–400, 1997.
20
Lindfors, A. and Vuilleumier, J.: Erythemal UV at Davos (Switzerland), 1926–2003, estimated using total ozone, sunshine duration, and snow depth, J. Geophys. Res., 110, 1–15, D02104, doi:10.1029/2004JD005231, 2005.
Mayer, B., Kylling, A., Madronich, S., and Seckmeyer, G.: Enhanced absorption of UV radiation due to multiple scattering in clouds: Experimental evidence and theoretical explanation, J.
25
Geophys. Res., 103, 31 241–31 254, 1998.
Paulsson, L. E. and Wester, U.: The Nordic intercomparison of ultraviolet and total ozone radiometers at Tyl ¨osand, Sweden, in 2000, Swedish Radiation Protection Authority, SSI Re-ports, 2006.
Remund, J., Wald, L., Lefevre, M., and Ranchin, T.: Worldwide Linke Turbidity Information.
30
Proceedings of ISES Solar World Congress, 16–19 June 2003, G ¨oteborg, Sweden, CD-Rom published by the International Solar Energy Society, 2003.
Geo-ACPD
8, 181–214, 2008 Hourly resolved cloud modification factors in the UV H. Staiger et al. Title Page Abstract Introduction Conclusions References Tables Figures ◭ ◮ ◭ ◮ Back CloseFull Screen / Esc
Printer-friendly Version Interactive Discussion
EGU
phys. Res., 104, 4065–4077, 1999.
Rigollier, C., Bauer, O., and Wald, L.: On the Clear Sky Model of the ESRA – European Solar Radiation Atlas – With Respect to the HELIOSAT Method, Sol. Energy, 68, 33–48, 2000. Ritter, B. and Geleyn, J. F.: A comprehensive radiation scheme for numerical weather prediction
models with potential applications in climate simulations, Mon. Weather Rev., 120, 303–325,
5
1992.
Ruggaber, A., Dlugi, R., and Nakajima, T.: Modelling radiation quantities and photolysis fre-quencies in the troposphere, J. Atmos. Chem., 18, 171–210, 1994.
Schwander, H., Koepke, P., and Ruggaber, A.: Uncertainties in modeled UV irradiances due to limited accuracy and availability of input data, J. Geophys. Res., 102, 9419–9429, 1997.
10
Schwander, H., Mayer, B., Ruggaber, A., Albold, A., Seckmeyer, G., and Koepke, P.: Method to determine snow albedo values in the ultraviolet for radiative transfer modelling, Appl. Optics, 38, 3869–3875, 1999.
Schwander, H., Kaifel, A., Ruggaber, A., and Koepke, P.: Spectral radiative transfer modeling with minimized computation time by use of neural-network technique, Appl. Optics, 40, 331–
15
335, 2001.
Seckmeyer, G., Erb, R., and Albold A.: Transmittance of a cloud is wavelength-dependent in the UV-range, Geophys. Res. Lett., 23, 2753–2755, 1996.
Spinhirne, J. D. and Green, A. E. S.: Calculation of the relative influence of cloud layers on received ultraviolet and integrated solar radiation, Atmos. Environ., 12, 2449–2454, 1978.
20
Staiger, H., Vogel, G., Schubert, U., Kirchner, R., Lux, G., and Jendritzky, G.: UV Index Cal-culation by the Deutscher Wetterdienst and Dissemination of UV Index Products, in WMO: Report on the WMO-WHO Meeting of Experts on Standardization of UV Indices and their Dissemination to the Public, WMO/TD-No. 921: 89–92, 1998.
Staiger, H. and Koepke, P.: UV Index forecasting on a global scale, Meteorol. Z., 14, 259–270,
25
2005.
Tanskanen, A.: Lambertian Surface Albedo Climatology at 360 nm from TOMS Data Using Moving Time-Window Technique, in: Proceedings Quadrennial Ozone Symposium, Kos, Greece, 1–8 June 2004, 1159–1160, 2004.
Taylor, K. E.: Summarizing multiple aspects of model performance in a single diagram, J.
30
Geophys. Res., 106, 7183–7192, 2001.
Tompkins, A. M. and Di Giuseppe, F.: Generalizing Cloud Overlap Treatment to Include Solar Zenith Angle Effects on Cloud Geometry, J. Atmos. Sci., 64, 2116–2125, 2007.
ACPD
8, 181–214, 2008 Hourly resolved cloud modification factors in the UV H. Staiger et al. Title Page Abstract Introduction Conclusions References Tables Figures ◭ ◮ ◭ ◮ Back CloseFull Screen / Esc
Printer-friendly Version Interactive Discussion
EGU
van Weele, M., Martin, T. J., Blumthaler, M., Brogniez, C., Den Outer, P. N., Engelsen, O., Lenoble, J., Mayer, B., Pfister, G., Ruggaber, A., Walravens, B., Weihs, P., Gardiner, B. G., Gillotay, D., Haferl, D., Kylling, A., Seckmeyer, G., and Wauben, W. M. F.: From model intercomparison toward benchmark UV spectra for six real atmospheric cases, J. Geophys. Res., 105, 4915–4925, 2000.
ACPD
8, 181–214, 2008 Hourly resolved cloud modification factors in the UV H. Staiger et al. Title Page Abstract Introduction Conclusions References Tables Figures ◭ ◮ ◭ ◮ Back CloseFull Screen / Esc
Printer-friendly Version Interactive Discussion
EGU Table 1. Summarising statistics of measured and modelled hourly UV Index (UVI) for all
effec-tive atmospheric conditions (bias see Table 2, column absolute differences).
Site year pairs average standard average standard root mean correlation regression regression measured (x) deviation x modelled (y) deviation y square error coefficient constant slope
UVI UVI UVI UVI UVI UVI
Bergen 1999 2860 1.206 1.209 1.165 1.164 0.151 0.993 0.012 0.957 Bergen 2002 3010 1.098 1.096 1.143 1.144 0.257 0.975 0.026 1.018 Potsdam 2002 3257 1.467 1.446 1.430 1.441 0.198 0.991 −0.019 0.988 Davos 1999 2868 2.480 2.347 2.380 2.242 0.321 0.992 0.030 0.948 Davos 2002 2950 2.456 2.305 2.391 2.239 0.258 0.994 0.018 0.966 Thessaloniki 1999 2917 2.494 2.265 2.529 2.281 0.228 0.995 0.029 1.003 Thessaloniki 2002 3130 2.359 2.106 2.396 2.152 0.208 0.996 −0.004 1.018 Everglades 2005 3560 3.518 2.965 3.274 2.768 0.424 0.995 0.005 0.929 Lauder 2005 3460 2.353 2.644 2.406 2.603 0.212 0.997 0.097 0.981 total 28012 2.185 2.280 2.148 2.214 0.265 0.994 0.039 0.965
ACPD
8, 181–214, 2008 Hourly resolved cloud modification factors in the UV H. Staiger et al. Title Page Abstract Introduction Conclusions References Tables Figures ◭ ◮ ◭ ◮ Back CloseFull Screen / Esc
Printer-friendly Version Interactive Discussion
EGU Table 2. Statistics of absolute (modelled – measured) and relative (modelled minus measured
divided by measured) differences of hourly UV Index (UVI) for all effective atmospheric condi-tions.
Site year absolute standard relative standard pairs
differences deviation differences deviation
UVI UVI % % Bergen 1999 −0.041 0.145 −1.65 14.64 2860 Bergen 2002 0.046 0.253 5.29 17.87 3010 Potsdam 2002 −0.037 0.194 −1.68 18.67 3257 Davos 1999 −0.100 0.305 −0.01 13.91 2868 Davos 2002 −0.065 0.250 0.16 13.09 2950 Thessaloniki 1999 0.035 0.225 1.31 12.53 2917 Thessaloniki 2002 0.037 0.205 −0.35 12.49 3130 Everglades 2005 −0.244 0.346 −8.76 10.49 3560 Lauder 2005 0.053 0.206 8.04 17.25 3460 total −0.037 0.262 0.20 15.51 28012
ACPD
8, 181–214, 2008 Hourly resolved cloud modification factors in the UV H. Staiger et al. Title Page Abstract Introduction Conclusions References Tables Figures ◭ ◮ ◭ ◮ Back CloseFull Screen / Esc
Printer-friendly Version Interactive Discussion EGU -0,5 -0,4 -0,3 -0,2 -0,1 0,0 0,1 0,2 0,3 0,4 0,5 0 5 10 15 20 25 30 35 40 45 50 55 60 65
70 D aily Cloud M odification Factor (U V_CM F) W RD C: 2000+2001
fr e que nc y, %
U V_CM F: difference ESRA - RIV M
U V_CM F: ESRA - RIV M m ean: RIV M = 0.735 ESRA = 0.719 bias: -0.0157 rm se: 0.0360 n: 120,420 r: 0.990 ESRA = 0.0055 + 0.9711*RIV M
Fig. 1. Distribution of the difference of daily UV Cloud Modification Factors (UV CMF) modelled
based on the algorithm of the European Solar Radiation Atlas (ESRA) and the Netherlands National Institute for Public Health and the Environment (RIVM) to predict total global irradiation. 183 European sites 2000 and 2001 with measured daily sums of total global radiation.
ACPD
8, 181–214, 2008 Hourly resolved cloud modification factors in the UV H. Staiger et al. Title Page Abstract Introduction Conclusions References Tables Figures ◭ ◮ ◭ ◮ Back CloseFull Screen / Esc
Printer-friendly Version Interactive Discussion
EGU
JanFebM rzA prM aiJun JulA ugSep O ktN ovD ez 0,0 5,0x10⁶ 1,0x10⁷ 1,5x10⁷ 2,0x10⁷ 2,5x10⁷ 3,0x10⁷ 3,5x10⁷
Jan FebM rz A prM aiJun JulA ugSep O ktN ovD ez 0 1000 2000 3000 4000 5000 6000 7000
JanFebM rzA prM aiJun JulA ugSep O ktN ovD ez 0,0 5,0x10⁶ 1,0x10⁷ 1,5x10⁷ 2,0x10⁷ 2,5x10⁷ 3,0x10⁷ 3,5x10⁷
Jan FebM rz A prM aiJun JulA ugSep O ktN ovD ez 0 1000 2000 3000 4000 5000 6000 7000
JanFebM rzA prM aiJun JulA ugSep O ktN ovD ez 0,0 5,0x10⁶ 1,0x10⁷ 1,5x10⁷ 2,0x10⁷ 2,5x10⁷ 3,0x10⁷ 3,5x10⁷
JanFebM rzA prM aiJun JulA ugSep O ktN ovD ez 0,0 5,0x10⁶ 1,0x10⁷ 1,5x10⁷ 2,0x10⁷ 2,5x10⁷ 3,0x10⁷ 3,5x10⁷
Jan FebM rz A prM aiJun JulA ugSep O ktN ovD ez 0 1000 2000 3000 4000 5000 6000 7000
Jan FebM rz A prM aiJun JulA ugSep O ktN ovD ez 0 1000 2000 3000 4000 5000 6000 7000 m easured
predicted clear sky: ESRA hourly accum ulated
da il y gl oba l ir rad iat ion, J m -2
Total Global Radiation Bergen 1999
m easured predicted clear sky
da il y CI E UV dos e , J m -2
Daily erythem al (CIE) UV dose Bergen 1999
m easured predicted clear sky: ESRA hourly accum ulated
da il y gl oba l ir rad iat ion, J m -2
Total Global Radiation Potsdam 2002
m easured predicted clear sky
da il y CI E UV dos e , J m -2
Daily erythem al (CIE) UV dose Potsdam 2002
m easured predicted clear sky: ESRA hourly accum ulated
da il y gl oba l ir rad iat ion, J m -2
Total Global Radiation Davos 2002
m easured predicted clear sky: ESRA hourly accum ulated
da il y gl oba l ir rad iat ion, J m -2
Total Global Radiation Bergen 2002
m easured predicted clear sky
da il y CI E UV dos e , J m -2
Daily erythem al (CIE) UV dose Bergen 2002
m easured predicted clear sky
da il y CI E UV dos e , J m -2
Daily erythem al (CIE) UV dose Davos 2002
Fig. 2a. Daily sums of measured total global radiation and modelled clear sky (left)
accumu-lated from hourly values, as well as for erythemal UV doses (right): Bergen 1999 + 2002, Potsdam 2002, and Davos 2002.
ACPD
8, 181–214, 2008 Hourly resolved cloud modification factors in the UV H. Staiger et al. Title Page Abstract Introduction Conclusions References Tables Figures ◭ ◮ ◭ ◮ Back CloseFull Screen / Esc
Printer-friendly Version Interactive Discussion
EGU
Jan FebM rzA prM aiJun JulA ug SepO ktN ovD ez 0,0 5,0x10⁶ 1,0x10⁷ 1,5x10⁷ 2,0x10⁷ 2,5x10⁷ 3,0x10⁷ 3,5x10⁷
Jan FebM rzA prM aiJun JulA ug SepO ktN ovD ez 0 1000 2000 3000 4000 5000 6000 7000
Jan FebM rzA prM aiJun JulA ug SepO ktN ovD ez 0,0 5,0x10⁶ 1,0x10⁷ 1,5x10⁷ 2,0x10⁷ 2,5x10⁷ 3,0x10⁷ 3,5x10⁷
Jan FebM rzA prM aiJun JulA ug SepO ktN ovD ez 0 1000 2000 3000 4000 5000 6000 7000
Jan FebM rzA prM aiJun JulA ug SepO ktN ovD ez 0,0 5,0x10⁶ 1,0x10⁷ 1,5x10⁷ 2,0x10⁷ 2,5x10⁷ 3,0x10⁷ 3,5x10⁷
Jan FebM rzA prM aiJun JulA ug SepO ktN ovD ez 0 1000 2000 3000 4000 5000 6000 7000
O ktN ovD ez Jan FebM rzA prM aiJun JulA ug Sep 0,0 5,0x10⁶ 1,0x10⁷ 1,5x10⁷ 2,0x10⁷ 2,5x10⁷ 3,0x10⁷ 3,5x10⁷
O ktN ovD ez JanFebM rzA prM aiJun JulA ugSep 0 1000 2000 3000 4000 5000 6000 7000 m easured
predicted clear sky: ESRA hourly accum ulated
da il y gl oba l ir rad iat ion, J m -2
Total Global Radiation Thessaloniki 1999
m easured predicted clear sky
da il y CI E UV dos e , J m -2
Daily erythem al (CIE) UV dose Thessaloniki 1999
m easured predicted clear sky: ESRA hourly accum ulated
da il y gl oba l ir rad iat ion, J m -2
Total Global Radiation Thessaloniki 2002
m easured predicted clear sky
da il y CI E UV dos e , J m -2
Daily erythem al (CIE) UV dose Thessaloniki 2002
m easured predicted clear sky: ESRA hourly accum ulated
da il y gl oba l ir rad iat ion, J m -2
Total Global Radiation Everglades 2005
m easured predicted clear sky
da il y CI E UV dos e , J m -2
Daily erythem al (CIE) UV dose Everglades 2005
2005 2004
m easured predicted clear sky: ESRA hourly accum ulated
da il y gl oba l ir rad iat ion, J m -2
Total Global Radiation Lauder 2004 - 2005
2005 2004
m easured predicted clear sky
da il y CI E UV dos e , J m -2
Daily erythem al (CIE) UV dose Lauder 2004 - 2005
ACPD
8, 181–214, 2008 Hourly resolved cloud modification factors in the UV H. Staiger et al. Title Page Abstract Introduction Conclusions References Tables Figures ◭ ◮ ◭ ◮ Back CloseFull Screen / Esc
Printer-friendly Version Interactive Discussion EGU 0 1 2 3 4 5 6 7 8 9 1011 12 13 0 1 2 3 4 5 6 7 8 9 10 11 12 13 0 1 2 3 4 5 6 7 8 9 1011 12 13 0 1 2 3 4 5 6 7 8 9 10 11 12 13 0 1 2 3 4 5 6 7 8 9 1011 12 13 0 1 2 3 4 5 6 7 8 9 10 11 12 13 0 1 2 3 4 5 6 7 8 9 1011 12 13 0 1 2 3 4 5 6 7 8 9 10 11 12 13 0 1 2 3 4 5 6 7 8 9 1011 12 13 0 1 2 3 4 5 6 7 8 9 10 11 12 13 0 1 2 3 4 5 6 7 8 9 1011 12 13 0 1 2 3 4 5 6 7 8 9 10 11 12 13 0 1 2 3 4 5 6 7 8 9 1011 12 13 0 1 2 3 4 5 6 7 8 9 10 11 12 13 0 1 2 3 4 5 6 7 8 9 1011 12 13 0 1 2 3 4 5 6 7 8 9 10 11 12 13 CM F > 0.75: r= 0.996, n= 1186, std bias= 0.125 U V Im od = 0.9707*U V Im eas + 0.022 UVI mo d UVIm eas CM F < 0.50: r= 0.988 n= 763 std bias=0.137 U V Im od = 0.9304*U V Im eas + 0.042 CM F < 0.50: r= 0.983 n= 905 std bias=0.101 U V Im od = 0.8632* U V Im eas + 0.076
UV Index (UVI): hourly Bergen 1999
C M F > 0.75: r= 0.995, n= 1299, std bias= 0.138 U VIm od = 1.0665*U VIm eas + 0.025
UVI mo d UVIm eas 0.75 > CM F > 0.50: r= 0.981n= 858 std bias= 0.200 U V Im od = 0.9852*U V Im eas + 0.055 CM F < 0.50: r= 0.966 n= 826 std bias=0.147 U V Im od = 0.9067* U V Im eas + 0.101
UV Index (UVI): hourly Bergen 2002
CM F > 0.75: r = 0.995, n = 1801, std bias = 0.232 U V Im od = 0.9759*U V Im eas + 0.029 UVI mo d UVIm eas 0.75 > CM F > 0.50: r = 0.992, n = 783, std bias = 0,209 U V Im od = 0.9313*U V Im eas + 0.054 CM F < 0.50: r = 0.988, n = 366, std bias = 0.172 U V Im od = 0.8733*U V Im eas + 0.126
UV Index (UVI): hourly Davos 2002
CM F > 0.75: r = 0.992, n = 1625, std bias = 0.218 U V Im od = 1.0071*U V Im eas - 0.031 UV Imo d UVIm eas 0.75 > CM F > 0.50: r = 0.990, n = 773, std bias = 0.157 U V Im od = 0.9451*U V Im eas + 0.042 CM F < 0.50: r = 0.987, n = 859, std bias = 0.104 U V Im od = 0.8819*U V Im eas + 0.060
UV Index (UVI): hourly Potsdam 2002
CM F > 0.75: r = 0.995, n = 2441, std bias = 0.234 U V Im od = 1.0029*U V Im eas + 0.031 UVI mo d UVIm eas 0.75 > CM F > 0.50: r = 0.992, n = 326, std bias = 0.185 U V Im od = 0.9972*U V Im eas + 0.040 CM F < 0.50: r = 0.986, n = 150, std bias = 0.136 U V Im od = 1.0165*U V Im eas + 0.064
UV Index (UVI): hourly Thessaloniki 1999
CM F > 0.75: r = 0.996, n = 2348, std bias = 0.210 U V Im od = 1.0197*U V Im eas - 0.008 UVI mo d UVIm eas 0.75 > CM F > 0.50: r = 0.990, n = 437, std bias = 0.180 U V Im od = 1.0100*U V Im eas + 0.032 CM F < 0.50: r = 0.986, n = 255, std bias = 0.138 U V Im od = 0.9743*U V Im eas + 0.075
UV Index (UVI): hourly Thessaloniki 2002
CM F > 0.75: r = 0.997, n = 2099, std bias = 0.236 U V Im od = 0.9392* U V Im eas + 0.046 UVI mo d UVIm eas 0.75 > CM F > 0.50: r = 0.994, n = 880, std bias = 0.266 U V Im od = 0.9028*U V Im eas + 0.061 CM F < 0.50: r = 0.983, n = 541, std bias = 0.243 U V Im od = 0.8572*U V Im eas + 0.079
UV Index (UVI): hourly Everglades 2005
CM F > 0.75: r = 0.998, = 2062, std bias = 0.179 U V Im od = 0.9799*U V Im eas + 0.087 UVI mo d UVIm eas 0.75 > CM F > 0.50: r = 0.994, = 876, std bias = 0.205 U V Im od = 1.0314*U V Im eas + 0.063 CM F < 0.50: r = 0.972, n = 509, std bias = 0.270 U V Im od = 1.0053*U V Im eas + 0.170
UV Index (UVI): hourly Lauder 2004 - 2005
Fig. 3. Scatter plots of measured (UVImeas) and modelled UV Index (UVImod) and regression
analysis for 3 bins of Cloud Modification Factors (CMF): Bergen 1999 + 2002, Potsdam 2002, Davos 2002, Thessaloniki 1999 + 2002, Everglades 2005, and Lauder 2005.
ACPD
8, 181–214, 2008 Hourly resolved cloud modification factors in the UV H. Staiger et al. Title Page Abstract Introduction Conclusions References Tables Figures ◭ ◮ ◭ ◮ Back CloseFull Screen / Esc
Printer-friendly Version Interactive Discussion EGU 0,1 0,2 0,3 0,4 0,5 0,6 0,7 0,8 0,9 1,0 1,1 0,97 0,98 0,99 1,00 1,01 1,02 1,03 1,04 1,05 1,06 1,07 1,08 1,09 1,10 1,11
1,12 hourly U V Index (U V I): O ct 2004 - M arch 2005 Lauder
regression slope, 95 % confidence interval fit:3rd
order polynom ial: r2
= 0.929 U V Iadj(cm f)=1.0289+0.2056*cm f-0.5339*cm f +2 +0.2992*cm f +3 di vi so r to ad jus t UVI U V_CM F
Fig. 4. Divisor to adjust modelled hourly UV Cloud Modification Factors (UV CMF) by
apply-ing the algorithm of the Netherlands National Institute for Public Health and the Environment (RIVM) originally derived for daily sums.