HAL Id: hal-00302029
https://hal.archives-ouvertes.fr/hal-00302029
Submitted on 28 Jul 2006HAL is a multi-disciplinary open access
archive for the deposit and dissemination of sci-entific research documents, whether they are pub-lished or not. The documents may come from teaching and research institutions in France or abroad, or from public or private research centers.
L’archive ouverte pluridisciplinaire HAL, est destinée au dépôt et à la diffusion de documents scientifiques de niveau recherche, publiés ou non, émanant des établissements d’enseignement et de recherche français ou étrangers, des laboratoires publics ou privés.
Annual variation and global distribution of
strato-mesospheric carbon monoxide measured by
ground-based Fourier Transform Infrared spectrometry
V. Velazco, S. W. Wood, M. Sinnhuber, I. Kramer, N. B. Jones, Y. Kasai, J.
Notholt, T. Warneke, T. Blumenstock, F. Hase, et al.
To cite this version:
V. Velazco, S. W. Wood, M. Sinnhuber, I. Kramer, N. B. Jones, et al.. Annual variation and global distribution of strato-mesospheric carbon monoxide measured by ground-based Fourier Transform Infrared spectrometry. Atmospheric Chemistry and Physics Discussions, European Geosciences Union, 2006, 6 (4), pp.7119-7135. �hal-00302029�
ACPD
6, 7119–7135, 2006 Strato-mesosphere CO measurements by ground-based FTIR V. Velazco et al. Title Page Abstract Introduction Conclusions References Tables Figures J I J I Back Close Full Screen / Esc Printer-friendly VersionInteractive Discussion
EGU
Atmos. Chem. Phys. Discuss., 6, 7119–7135, 2006 www.atmos-chem-phys-discuss.net/6/7119/2006/ © Author(s) 2006. This work is licensed
under a Creative Commons License.
Atmospheric Chemistry and Physics Discussions
Annual variation and global distribution of
strato-mesospheric carbon monoxide
measured by ground-based Fourier
Transform Infrared spectrometry
V. Velazco1, S. W. Wood2, M. Sinnhuber1, I. Kramer3, N. B. Jones4, Y. Kasai5, J. Notholt1, T. Warneke1, T. Blumenstock3, F. Hase3, F. J. Murcray6, and O. Schrems7
1
Institute of Environmental Physics University of Bremen, Bremen, Germany
2
National Institute of Water and Atmospheric Research Ltd, Lauder New Zealand
3
Institute of Meteorology and Climate Research, Forschungszentrum Karlsruhe and University of Karlsruhe, Karlsruhe, Germany
4
Department of Chemistry University of Wollongong, Wollongong, Australia
5
Global Environment Division National Institute of Information and Communications Technology (NICT), Tokyo, Japan
6
Department of Physics and Astronomy, University of Denver, Denver, Colorado, USA
7
Alfred Wegener Institute for Polar and Marine Research, Bremerhaven, Germany Received: 5 May 2006 – Accepted: 1 June 2006 – Published: 28 July 2006 Correspondence to: V. Velazco ([email protected])
ACPD
6, 7119–7135, 2006 Strato-mesosphere CO measurements by ground-based FTIR V. Velazco et al. Title Page Abstract Introduction Conclusions References Tables Figures J I J I Back Close Full Screen / Esc Printer-friendly VersionInteractive Discussion
EGU
Abstract
We present long-term time-series of strato-mesospheric CO vertical columns mea-sured from stations located in Antarctica, mid-latitudes and the Arctic, covering the period from 1997–2005. The instrument and the measurement technique allows the separation of tropospheric and strato-mesospheric contributions to the CO column,
5
therefore providing information on the chemistry and dynamics both at low and high al-titudes. Data from polar stations show a similar annual variability of strato-mesospheric CO with a strong maximum in late winter and spring and a small enhancement in late summer for some stations, which we call the “summer bulge”. Generally, the mid-latitude stations show no significant annual variability of strato-mesospheric CO
10
columns. Measurements were compared with a two-dimensional chemistry-transport model of the middle atmosphere. The annual and latitudinal variations of CO are repro-duced very well by a model run including thermospheric CO. Comparison with different model scenarios show that the polar winter maximum is due solely to downward trans-port of thermospheric CO, while the summer maximum is due to CHOx chemistry in
15
the stratosphere.
1 Introduction
The high latitude regions have a larger seasonal atmospheric variation than anywhere else on earth (Notholt et al., 1997). To study this variation, we use carbon monoxide (CO), which is an excellent tracer for global transport and air mass descent rates in the
20
polar stratosphere and lower mesosphere. Its importance as an indicator of vertical transport in the mesosphere was highlighted in results from ground-based measure-ments e.g. K ¨unzi and Carlson (1982). At altitudes of about 50 km, the photochemical lifetime of CO is about 7 days, which is comparable to the vertical and horizontal ad-vection time scales at these altitudes (Dupuy et al., 2004, Solomon et al., 1985).
25
ther-ACPD
6, 7119–7135, 2006 Strato-mesosphere CO measurements by ground-based FTIR V. Velazco et al. Title Page Abstract Introduction Conclusions References Tables Figures J I J I Back Close Full Screen / Esc Printer-friendly VersionInteractive Discussion
EGU
mosphere is the photolysis of carbon dioxide. In the stratosphere, CO is produced through the oxidation of atmospheric methane, but OH rapidly destroys it through ox-idation. This reaction acts as the main sink of CO. This process does not take place during the polar night, since OH is produced by reactions involving photolysis, e.g. of H2O, and since the concentration of OH diminishes rapidly during polar night. Carbon
5
monoxide follows the meridional circulation towards the winter hemisphere polar night region. The consecutive downward motion induces a sharp gradient in the CO con-centrations down to the stratosphere (Solomon, et al., 1985). In summer, uplifting of air masses with low CO content takes place. Solomon et al. (1985) predicted that very large abundances should accumulate in the polar night mesosphere because of the
10
absence of photochemical destruction processes.
Previous ground-based measurements of mesospheric CO were shown in pioneer-ing works such as that of K ¨unzi and Carlson (1982); Clancy, et al. (1982); Farmer, et al. (1980); Zander et al. (1981); Goldsmith et al. (1979); etc. However, there is a lack of long term ground-based observations of strato-mesospheric CO in the
litera-15
ture. Recently, satellites have been able to measure high-altitude CO (e.g. Dupuy et al., 2004; Clerbaux et al., 2005). But until now, the longest reported time series of CO in the upper atmosphere was done by Forkmann et al. (2003) over the Onsala Space laboratory, Sweden (57.4◦N, 12◦E). The time series spanned from September 2000 to September 2002.
20
Kasai et al. (2005) reported the first ground based measurements of strato-mesospheric CO by Fourier Transform Infrared (FTIR) spectrometry over Poker Flat, Alaska (65◦N, 147◦W). They have established the capability of the FTIR technique to detect the seasonal variability of strato-mesospheric CO.
In this paper we report more than seven years of time series of strato-mesospheric
25
CO measured from stations located in the high latitude regions of the Arctic (79◦N) and the Antarctic (78◦S). We augment this data set from two additional high-latitude stations and two mid-latitude stations. We also show comparisons with a global two-dimensional photolysis, chemistry and transport model in the stratosphere and
meso-ACPD
6, 7119–7135, 2006 Strato-mesosphere CO measurements by ground-based FTIR V. Velazco et al. Title Page Abstract Introduction Conclusions References Tables Figures J I J I Back Close Full Screen / Esc Printer-friendly VersionInteractive Discussion
EGU
sphere.
2 Instruments
Measurements were taken from three Arctic stations (Ny Alesund 79◦N, Kiruna 68◦N and Poker Flat 65◦N), one Antarctic station (Arrival Heights 78◦S) and two mid-latitude stations (Bremen, Germany 53◦N and Lauder, New Zealand 45◦S). All stations are
5
equipped with Bruker 120HR spectrometers except for Arrival Heights (120 M) and Bremen (125 HR). For the polar stations, measurements are limited by the polar night. Solar spectra in Ny-Alesund can be recorded between March and early October. In Kiruna, the polar night is between early December and mid January. At the Arrival Heights station in Antarctica, the polar night is between late April and mid August.
10
Measurements in Poker Flat are possible between early February and mid October. 2.1 Retrieval of strato-mesospheric CO
Partial columns of CO were retrieved from the absorption lines in two steps. First, vol-ume mixing ratio (VMR) profiles from the surface up to about 100 km were retrieved. The profiles were then converted into number densities using
height-temperature-15
pressure profiles and integrated to yield partial columns. The program used for the retrieval of CO profiles for Ny Alesund, Poker Flat, Bremen, Lauder and Arrival Heights is SFIT-2 version 3.8 (see also Rinsland et al. (1998). The program used to retrieve the Kiruna data is PROFFIT 9 developed by Hase (2000). A detailed description and comparison of both retrievals are shown in Hase et al. (2004). The pressure and
tem-20
perature profiles necessary for the forward model were obtained from balloon sondes that were launched daily from the stations. Above the altitude limits of the sondes (ap-proximately 30 km), standard pressure and temperature profiles were taken. In Kiruna, pressure and temperature profiles were taken form NCEP (Kanamitsu, 1989).
CO spectra were analyzed in the CO micro-windows based on the previous work
ACPD
6, 7119–7135, 2006 Strato-mesosphere CO measurements by ground-based FTIR V. Velazco et al. Title Page Abstract Introduction Conclusions References Tables Figures J I J I Back Close Full Screen / Esc Printer-friendly VersionInteractive Discussion
EGU
of Rinslandet al. (1998). For all stations, the HITRAN2k line list plus updates to 2001 (Rothman et al., 2003) was used. Typical averaging kernels for the retrievals in Ny Alesund are shown in Fig. 1. The figure shows that the 2 partial columns from 0.2– 18 km and from 18 km to 85 km can be separated. For some cases, the kernel for the 18 km to 85 km is not perfect, i.e. it does not have a maximum of 1. Furthermore,
5
the stratospheric columns and the mesospheric columns are not separable, thus we provide the measurements as strato-mesospheric columns.
2.2 The Chemical Transport Model
The model used is a global two-dimensional photolysis, chemistry and transport model of the stratosphere and mesosphere. It is a coupled chemistry-dynamics model which
10
combines the THIN AIR meteorological code (Kinnersley, 1996) and the SLIMCAT chemistry code (Chipperfield, 1999). Temperature, pressure and wind fields are calcu-lated by the THIN AIR code on isentropic surfaces from the bottom up to ∼100 km with a vertical spacing of about 3 km.
The model has a horizontal resolution of about 9.5◦ extending from −85.3◦S to
15
85.3◦N in 19 evenly spaced latitude bins. The chemistry module uses JPL-2003 pho-tochemistry data (Sander et al., 2003) . Though the SLIMCAT model is not appropriate for the troposphere, it is applied to the entire vertical range of the model. Heating rates are calculated in the THIN AIR module, using O3, NO2and CH4values provided by the chemistry module. CO2is also used to calculate heating rates, however, as this is very
20
long-lived in the stratosphere and mesosphere, it is not accounted for in the chemistry code. In the past, the model has been used for a number of studies concerning the composition of the middle atmosphere (Sinnhuber et al, 2003; Chipperfield and Feng, 2003). Tropospheric sources of chlorine, bromine and fluorine compounds as well as greenhouse gases like CH4, N2O and CO2are based on the WMO A1 scenario (WMO
25
2002, 2003).
Model runs started from 1988, and run to 2005. For this study, two model runs were carried out. The “base” scenario uses the original SLIMCAT chemistry which does
ACPD
6, 7119–7135, 2006 Strato-mesosphere CO measurements by ground-based FTIR V. Velazco et al. Title Page Abstract Introduction Conclusions References Tables Figures J I J I Back Close Full Screen / Esc Printer-friendly VersionInteractive Discussion
EGU
not contain CO2. This means that CO is produced solely from CH4 oxidation. In a second model run, called “thermospheric”, CO in the uppermost model box is fixed to the CO2value. This means that CO2is transported unchanged into the thermosphere, where it is transferred into CO immediately. CO will then be transported down into the mesosphere and stratosphere during polar winter; after polar sunrise, CO will react
5
with OH, re-forming CO2in a couple of days.
3 Results
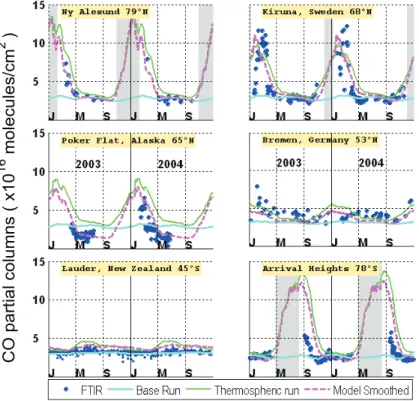
A comparison of the partial column densities measured by the FTIRs in molecules/cm2 from 18 km to the top of the atmosphere and the model results are shown in Fig. 2 for the period of 2003–2004. The partial column densities measured by the FTIRs are
10
shown by the blue dots. The cyan curve represents the base run from the model, where thermospheric CO is neglected. Clearly this run alone cannot reproduce the measure-ments. The green curve represents the complete run with the thermospheric CO. The model run smoothed by the typical averaging kernels of the FTIR is represented by magenta curve. The smoothing was done according to the formalism described in
15
Rodgers and Connor (2003) and shown in Velazco et al. (2005) for FTIR, model and satellite data comparison of CO profiles. The smoothed curves represent what the FTIR should “see” if the model were to represent the true CO. Measurements and smoothed model results compare very well in the northern hemisphere polar stations. For the Arrival heights station, the annual variation of CO is captured by the model
20
qualitatively, however, actual values of the winter maxima are significantly higher in the model results. This might be a result of a wrong estimation of the downward trans-port in the model. In the mid-latitudes, the model predicts a slight enhancement of the strato-mesospheric CO columns during winter times over Bremen and lesser values over Lauder. In both places, the quantitative agreement between model values and
25
measurements are very good.
ACPD
6, 7119–7135, 2006 Strato-mesosphere CO measurements by ground-based FTIR V. Velazco et al. Title Page Abstract Introduction Conclusions References Tables Figures J I J I Back Close Full Screen / Esc Printer-friendly VersionInteractive Discussion
EGU
atmosphere measured from FTIR (blue dots) and compared with the model (magenta dashes) are shown in Fig. 3. The measurements were taken from the three polar stations (Ny Alesund and Kiruna from the Arctic and Arrival Heights in Antarctica). The gray shaded areas represent the polar night where solar absorption measurements are not possible. Unlike the seasonal cycles of CO in the troposphere, the seasonal cycles
5
in the strato-mesosphere show very steep gradients, with maximum values occurring in January in the Arctic and in June–July in the Antarctic. As shown by the model (and partially by the measurements), the CO column above 18 km increases from about 4.0×10¹⁶ molecules/cm2 in summer to about 14×1016 molecules/cm2 in winter (an increase of about 3.5 times). This rapid increase is followed by a rapid decrease as
10
soon as the sun re-appears in spring.
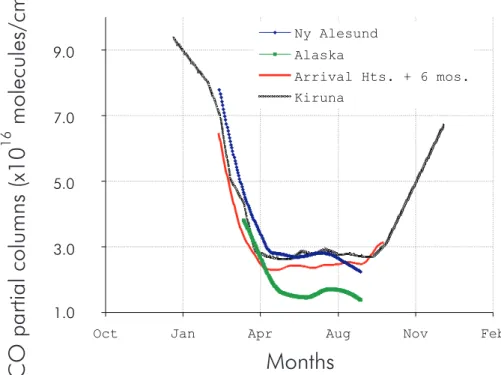
Although the annual variability in both Arctic and Antarctic are similar, there is a slight difference in amplitude. The measurements show that the values of the CO column above 18 km in the Arctic is slightly higher than in the Antarctic. This can be seen better in the average curves on Fig. 4. The average curves were calculated from
15
the whole time series of each station. Values over 15 days were averaged to yield one data point in the curve.
A small enhancement of CO columns can be observed in late summer from the measurements at the high-latitude stations. This could be seen as a small “bulge” from the average curves from Ny Alesund and Poker Flat in Fig. 4. The Kiruna and Arrival
20
Heights data exhibit this “summer bulge” for some years (e.g. 1998, 2002 and 2004 in Arrival Heights) but it tends to be averaged out due to the changing patterns in the data. Note also that Kiruna is often at the edge of the polar vortex. This summer maximum is also seen in the model, it is much clearer in the “base” model run. In the thermo-spheric model run, it is superimposed by the much sharper signal of mesothermo-spheric CO.
25
This summer maximum is produced by methane oxidation in the stratosphere, which occurs faster in summer. CO is an intermediate product of methane, it is then slowly transformed into CO2.
ACPD
6, 7119–7135, 2006 Strato-mesosphere CO measurements by ground-based FTIR V. Velazco et al. Title Page Abstract Introduction Conclusions References Tables Figures J I J I Back Close Full Screen / Esc Printer-friendly VersionInteractive Discussion
EGU
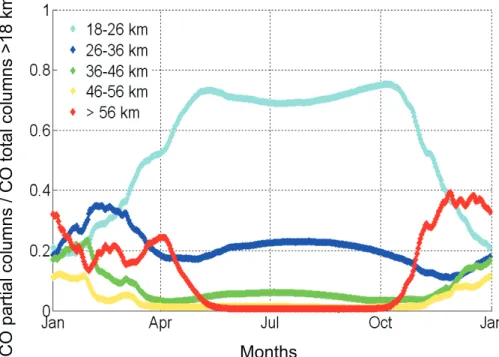
from the model for this site indicates that, generally about 20%–80% of the column above 18 km comes from the stratosphere (18–26 km), shown on Fig. 5. This estimate is based on the model data for Ny Alesund for one year. In winter, a significant portion of the column comes from above 56 km, i.e., the mesosphere and lower thermosphere. The summer maximum originates in the layer between 18–26 km. It cannot be seen
5
above 56 km. This means that the “summer bulge” detected by the FTIR really origi-nates from the stratosphere
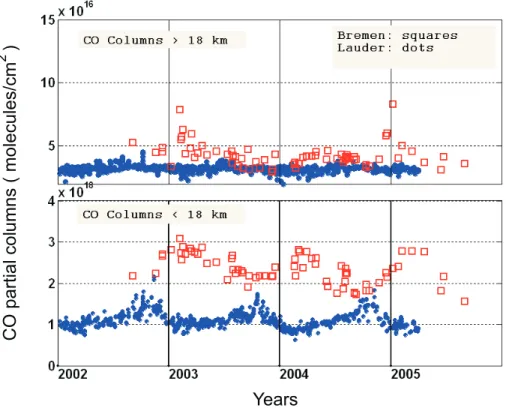
The Lauder data (45◦S) do not show the very high values of strato-mesospheric CO (Fig. 6). Although there is a strong variability in the columns below 18 km mostly due to biomass burning (Jones et al., 2001), the strato-mesospheric columns show
10
almost no variability. This shows that the columns below 18 km do not influence the columns above 18 km and that the retrieval could clearly separate both columns. The only exceptions to the monotonous strato-mesospheric CO trends in the mid-latitudes are the values measured in the winters of 2002–2003 and 2004–2005 over Bremen (53◦N).
15
4 Conclusions
The downward transport of strato-mesospheric CO above 18 km in the winter polar regions, which is strongly influenced by the meridional circulation can be seen in the data. The strong gradient showing a maximum in winter and minimum in summer are well captured by the measurements and verified by the model. It was shown that this
20
feature is generally not observed in mid-latitude stations.
CO in the mesosphere is influenced by the competition between downward transport from the thermosphere and OH oxidation. The measurements show that the pattern of the strato-mesospheric CO columns for all years in one station are almost similar. We assign this to CO having a shorter lifetime compared to the downward vertical transport
25
in the mesosphere-stratosphere during the measurement periods. On the other hand, there is a slight difference in column amounts of the strato-mesospheric CO between
ACPD
6, 7119–7135, 2006 Strato-mesosphere CO measurements by ground-based FTIR V. Velazco et al. Title Page Abstract Introduction Conclusions References Tables Figures J I J I Back Close Full Screen / Esc Printer-friendly VersionInteractive Discussion
EGU
the two poles, i.e. in spring, there is relatively more CO above 18 km in Ny Alesund than in Arrival Heights based on measurements and on the average curves. We speculate that this is due to the presence of more subsidence in the Arctic compared to the Antarctic.
Comparisons with a global two-dimensional photolysis, chemistry and transport
5
model in the stratosphere and mesosphere were shown. The assumption in the model that all the CO2in the thermosphere gets converted into CO via photolysis has been shown to be very reasonable. There is a good agreement between the model results and the measurements. According to the model, the production of CO from CH4 ox-idation in the mid to upper stratosphere results to a signal indicated by the “summer
10
bulge” in the FTIR data seen in Ny Alesund, Poker Flat and occasionally in Kiruna and Arrival Heights.
Acknowledgements. V. Velazco wishes to thank M. Palm and B. Martin Sinnhuber for helpful discussions. S. W. Wood acknowledges the New Zealand Foundation for Research Science and Technology and Antarctica New Zealand. I. Kramer, T. Blumenstock and F. Hase gratefully
15
acknowledge the Goddard Space Flight Center for providing temperature and pressure profiles via the auto mailer system and U. Raffalski from IRF Kiruna for support of FTIR measurements. Y. Kasai acknowledges Y. Muaraya (NICT), A. Kagawa (Fujitsu FIP), and T. Koshiro (Kyoto University) for the analysis of the FTIR data and useful discussions. Financial supports from the European Commission via the project UFTIR (contract EVK2-2002-000159) and from the
20
Helmholtz association within the virtual institute PEP are gratefully acknoledged.
References
Chipperfield, M. P.: Multiannual simulations with a three-dimensional chemical transport model, J. Geophys. Res., 104, 1781–1805, 1999.
Chipperfield, M. P. and Feng, W.: Comment on: Stratospheric Ozone Depletion at
25
northern mid-latitudes in the 21st century: The importance of future concentrations
of greenhouse gases nitrous oxide and methane, Geophys. Res. Letters, 30(7), 1389, doi:10.1029/2002GL016353, 2003.
ACPD
6, 7119–7135, 2006 Strato-mesosphere CO measurements by ground-based FTIR V. Velazco et al. Title Page Abstract Introduction Conclusions References Tables Figures J I J I Back Close Full Screen / Esc Printer-friendly VersionInteractive Discussion
EGU
Clancy, R. T., Muhleman, D. O., and Allen, M.: Seasonal variability of CO in the terrestrial mesosophere, J. Geophys. Res., 89(D6), 9673–9676, 1984.
Clerbaux, C., Coheur, P. F., Hurtmans, D., Barret, B., Carleer, M., Colin, R., Semeniuk, K., Mc-Connell, J. C., Boone, C., and Bernath, P.: Carbon monoxide distribution from ACE-FTS solar occultation measurements, Geophys. Res. Lett.,32, L16S01, doi:10.1029/2005GL022394,
5
2005.
Dupuy, E., Urban, J., Richard, P., Le Flochmoen, E., Lautie, N., Murtagh, D., De La Noe, J., El Amaraoui, L., Eriksson, P., Forkman, P., Frisk, U., Jegou, F., Jimenez, C., and Olberg, M.: Strato.mesospheric measurements of carbon monoxide with the Odin sub-millimeter radiometer: retrieval and first results, Geophys. Res. Lett., 31, L20101,
10
doi:10.1029/2004GL020558, 2004.
Farmer C. B., Raper, O. F., Robbins, B. D., Toth, R. A., and Muller, C.: Simultaneous
spectro-scopic measurements of stratospheric species: O3, CH4, CO, CO2, N2O, H2O, HCl and HF
at northern and southern mid-latitudes, J. Geophys. Res., 86, 5179–5184, 1980.
Forkman, P., Eriksson, P., and Winnberg, A.: Longest ground-based measurements of
meso-15
spheric CO, Geophys. Res. Lett., 30(10), 1532, doi:10.1029/2003GL016931, 2003.
Goldsmith, P. F., Litvak, M. M., Plambeck, R. L., and Williams, D. R.: Carbon monoxide mixing ratio in the mesosphere derived from gound based microwave measurements, J. Geophys. Res., 84, 416–418, 1979.
Hase, F.: Inversion von Spurengasprofilen aus hochaufgeloesten bodengebundenen
FTIR-20
Messungen in absorption, Wissenschaftliche Berichte Forschungszentrum Karlsruhe, FZKA 6512, ISSN 0947-8620, 2002.
Hase, F., Hannigan, J. W., Coffey, M. T., Goldman, A., Hoepfner , M., Jones, N. B., Rinsland,
C. P., and Wood, S. W.: Intercomparison of retrieval codes used for the analysis of high-resolution, ground-based FTIR measurements, J. Quant. Spectrosc. Radiat. Transfer, 87,
25
25–52, 2004.
Jones, N. B., Rinsland, C. P., Ben Liley, J., and Rosen, J.: Correlation of aerosol and carbon
monoxide at 45◦S: Evidence of biomass burning emissions, Geophys. Res. Lett., 289(4),
709–712, 2001.
Kanamitsu, M.: Description of the NMC global data assimilation and forecast system, Weather
30
Forecasting, 4, 335–342, 1989.
Kasai Y., Koshiro, T., Endo, M., Jones, N. B., and Murayama Y.: Ground based measurement of strato-mesospheric CO by a FTIR spectrometer over Poker Flat, Alaska, Adv. Space Res.,
ACPD
6, 7119–7135, 2006 Strato-mesosphere CO measurements by ground-based FTIR V. Velazco et al. Title Page Abstract Introduction Conclusions References Tables Figures J I J I Back Close Full Screen / Esc Printer-friendly VersionInteractive Discussion
EGU
doi:10.1016/j.asr.2005.04.099, 2005.
Kinnersley, J. S.: The climatology of the stratospheric THIN AIR model, Quart. J. Roy. Meteorol. Soc., 122, 219–252, 1996.
K ¨unzi, K. F. and Carlson, E. R.: Atmospheric CO mixing ratio profiles determined from ground
based measurements of the J=1→>0 and J=2→>1 emission lines,J. Geophys. Res., 87,
5
7235–7241, 1982.
Notholt, J., Toon, G., Stordal, F., Solberg, S., Schmidbauer, N., Becker, E., Meier, A., and
Sen, B.: Seasonal variations of trace gases in the high Arctic at 79◦N, J. Geophys. Res.,
102(D11), 12 855–12 861, 1997.
Rinsland, C. P., Jones, N. B., Connor, B. J., Logan, J. A., Pougatchev, N. S., Goldman, A.,
10
Mucray, F. J., Stephen, T. M., Pine, A. S., Zander, R., Mahieu, E., and Demoulin, P.: North-ern and southNorth-ern hemispheric ground-based infrared spectroscopic measurements of tropo-spheric carbon monoxide and ethane, J. Geophys. Res., 103(D21), 28 197–28 217, 1998. Sander, S. P., Friedl, R. R., Golden, D. M., Kurylo, M. J., Huie, R. E., Orkin, V. L., Moortgat,
G. K., Ravishankara, A. R., Kolb, C. E., Molina, M. J., and Finlayson-Pitts, B. J.: Chemical
15
Kinetics and Photochemical Data for Use in Atmospheric Studies, Evaluation No. 14, JPL Publication 02–25, Jet Propulsion Lab, Pasadena, CA, 2003.
Sinnhuber, M., Burrows, J., K ¨unzi, K. F., Chipperfield, M. P., Jackman, C. H., Kallenrode, M. B., and Quack, M.: A model study of the impact of magnetic field structure on at-mospheric composition during solar proton events, Geophys. Res. Lett., 30(15), 1818,
20
doi:10.1029/2003GL017265, 2003.
Solomon S., Garcia, R. R., Olivero, J. J., Bevilacqua, R. M., Schwartz, P. R., Clancy, R. T., and Muhleman, D. O.: Photochemistry and transport of Carbon Monoxide in the middle atmosphere, J. Atmos. Sci., 42(10), 1072–1083, 1985.
Velazco V., Notholt, J., Warneke, T., Lawrence, M., Bremer, H., Drummond, J., Schulz, A.,
25
Krieg, J., and Schrems, O.: Latitude and Altitude Variability of Carbon Monoxide in the At-lantic Detected from Ship-borne Fourier Transform Spectrometry, Model and Satellite Data, J. Geophys. Res., 110, D09306, doi:10.1029/2004JD005351, 2005.
WMO (World Meteorological Organization), Scientific Assessment of Ozone Depletion: 2002, Global Ozone Research and Monitoring Project – Report No.47, 498 pp., Geneva, 2003.
ACPD
6, 7119–7135, 2006 Strato-mesosphere CO measurements by ground-based FTIR V. Velazco et al. Title Page Abstract Introduction Conclusions References Tables Figures J I J I Back Close Full Screen / Esc Printer-friendly VersionInteractive Discussion
EGU
Fig. 1. Typical averaging kernels for the retrieval of CO from 18 km to the top most layer of the
retrieval are shown by the solid curve. The dotted curve is the averaging kernel for the retrieval of the CO column from the ground to 18 km. (Calculated for Ny Alesund for solar zenith angle
ACPD
6, 7119–7135, 2006 Strato-mesosphere CO measurements by ground-based FTIR V. Velazco et al. Title Page Abstract Introduction Conclusions References Tables Figures J I J I Back Close Full Screen / Esc Printer-friendly Version Interactive Discussion EGU C O par tial col um ns (x 10 16 mo le cu le s/ cm 2 )Fig. 2. A comparison of the partial column densities measured by the FTIRs in molecules/cm2
from 18 km to the top of the atmosphere and the model results for the period of 2003–2004. Cyan line: base model run without thermospheric CO. Green line: Model run with thermo-spheric CO. Blue dots: Retrieved columns from the FTIR. Magenta line (dashed): model run smoothed with the averaging kernels of the FTIR according to Rogers and Connor (2003). The shaded area approximately represents polar night at the sites.
ACPD
6, 7119–7135, 2006 Strato-mesosphere CO measurements by ground-based FTIR V. Velazco et al. Title Page Abstract Introduction Conclusions References Tables Figures J I J I Back Close Full Screen / Esc Printer-friendly Version Interactive Discussion EGU Years CO partial col umns (molecules/cm 2 )Fig. 3. Long-term FTIR measurements from the three polar stations; Ny Alesund and Kiruna
from the Arctic and Arrival Heights in Antarctica (blue dots) compared to the smoothed model data (dashed magenta curves). The measurements and model data are in partial column densities from 18 km to the top of the atmosphere.
ACPD
6, 7119–7135, 2006 Strato-mesosphere CO measurements by ground-based FTIR V. Velazco et al. Title Page Abstract Introduction Conclusions References Tables Figures J I J I Back Close Full Screen / Esc Printer-friendly Version Interactive Discussion EGU 1.0 3.0 5.0 7.0 9.0Oct Jan Apr Aug Nov Feb
Arrival Hts. + 6 mos.
Months
CO
partial
columns
(x10
molecules/cm
)
16 2Fig. 4. Average curves calculated from the time series of the four Polar stations: Ny-Alesund,
Poker Flat, Kiruna and Arrival Heights. The summer bulge in July–August can be clearly dis-tinguished from the Poker Flat and Ny Alesund data. The Arrival heights data (shifted by six months) only shows small “lumps” in June and August. The variability in the data in Arrival heights averages out the summer bulge. The average curves were calculated from the whole time series of each station. Values over 15 days were averaged to yield one bin in the curve.
ACPD
6, 7119–7135, 2006 Strato-mesosphere CO measurements by ground-based FTIR V. Velazco et al. Title Page Abstract Introduction Conclusions References Tables Figures J I J I Back Close Full Screen / Esc Printer-friendly Version Interactive Discussion EGU C O par tial col um ns /C O tot al col um ns >1 8 km MonthsFig. 5. Relative contributions of each layer to the column above 18 km calculated from the
model. The contributions are calculated from the CO partial columns coming from a certain layer divided by the total columns above 18 km. These curves indicate where the signal should come from. In winter, most of the CO partial column above 18 km is dominated by the CO coming from above 56 km. And from the 26–36 km layer. This is also the time when the downward transport from the mesosphere is strongest. In summer, the column above 18 km is
dominated by CO at 18–26 km where CH4oxidation plays a significant role in the production of
ACPD
6, 7119–7135, 2006 Strato-mesosphere CO measurements by ground-based FTIR V. Velazco et al. Title Page Abstract Introduction Conclusions References Tables Figures J I J I Back Close Full Screen / Esc Printer-friendly Version Interactive Discussion EGU Years CO partial col umns (molecules/cm 2 )Fig. 6. CO columns above and below 18 km from the two mid-latitude stations: Bremen 53◦N