HAL Id: hal-00297698
https://hal.archives-ouvertes.fr/hal-00297698
Submitted on 19 May 2008
HAL is a multi-disciplinary open access
archive for the deposit and dissemination of
sci-entific research documents, whether they are
pub-lished or not. The documents may come from
teaching and research institutions in France or
abroad, or from public or private research centers.
L’archive ouverte pluridisciplinaire HAL, est
destinée au dépôt et à la diffusion de documents
scientifiques de niveau recherche, publiés ou non,
émanant des établissements d’enseignement et de
recherche français ou étrangers, des laboratoires
publics ou privés.
balance across Northern Europe
P. Olofsson, F. Lagergren, A. Lindroth, J. Lindström, L. Klemedtsson, W.
Kutsch, L. Eklundh
To cite this version:
P. Olofsson, F. Lagergren, A. Lindroth, J. Lindström, L. Klemedtsson, et al.. Towards operational
re-mote sensing of forest carbon balance across Northern Europe. Biogeosciences, European Geosciences
Union, 2008, 5 (3), pp.817-832. �hal-00297698�
www.biogeosciences.net/5/817/2008/
© Author(s) 2008. This work is distributed under the Creative Commons Attribution 3.0 License.
Biogeosciences
Towards operational remote sensing of forest carbon balance across
Northern Europe
P. Olofsson1*, F. Lagergren1, A. Lindroth1, J. Lindström2, L. Klemedtsson3, W. Kutsch4, and L. Eklundh1
1Department of Physical Geography and Ecosystems Analysis, Lund University, Sölvegatan 12, SE-223 62, Lund, Sweden 2Mathematical Statistics, Centre for Mathematical Sciences, Lund University, Sölvegatan 18, SE-221 00, Lund, Sweden 3Department of Botany, Göteborg University, Box 461, SE-405 30, Gothenburg, Sweden
4Max-Planck-Institute for Biogeochemistry, Box 10 01 64, 07701, Jena, Germany
*now at: Dept. of Geography and Environment, Boston University, 675 Commonwealth Avenue, Boston, MA 02215, USA
Received: 20 July 2007 – Published in Biogeosciences Discuss.: 11 November 2007 Revised: 17 April 2008 – Accepted: 1 May 2008 – Published: 19 May 2008
Abstract.
Monthly averages of ecosystem respiration (ER), gross primary production (GPP) and net ecosystem exchange (NEE) over Scandinavian forest sites were estimated using regression models driven by air temperature (AT), absorbed photosynthetically active radiation (APAR) and vegetation indices. The models were constructed and evaluated us-ing satellite data from Terra/MODIS and measured data col-lected at seven flux tower sites in northern Europe. Data used for model construction was excluded from the evalu-ation. Relationships between ground measured variables and the independent variables were investigated.
It was found that the enhanced vegetation index (EVI) at 250 m resolution was highly noisy for the coniferous sites, and hence, 1 km EVI was used for the analysis. Linear re-lationships between EVI and the biophysical variables were found: correlation coefficients between EVI and GPP, NEE, and AT ranged from 0.90 to 0.79 for the deciduous data, and from 0.85 to 0.67 for the coniferous data. Due to sat-uration, there were no linear relationships between normal-ized difference vegetation index (NDVI) and the ground mea-sured parameters found at any site. APAR correlated better with the parameters in question than the vegetation indices. Modeled GPP and ER were in good agreement with sured values, with more than 90% of the variation in mea-sured GPP and ER being explained by the coniferous models. The site-specific respiration rate at 10◦C (R10) was needed
Correspondence to: P. Olofsson
(olofsson@bu.edu)
for describing the ER variation between sites. Even though monthly NEE was modeled with less accuracy than GPP, 61% and 75% (dec. and con., respectively) of the variation in the measured time series was explained by the model. These results are important for moving towards operational remote sensing of forest carbon balance across Northern Europe.
1 Introduction
The global carbon balance is the result of fluxes of carbon into and out of ocean and land. In this balance, terrestrial carbon sinks result in high quantities of carbon being drawn from the atmosphere into land. The compensating effect of the carbon sinks in relation to the anthropogenic fossil fuel emissions – now being the main source of atmospheric CO2(Keeling et al., 1996; Schulze et al., 2000) – makes the
knowledge of sink distribution of utmost importance for un-derstanding the biosphere’s interaction with climate and its impact on future carbon levels. There is scientific evidence of a missing carbon sink in the global carbon cycle, probably lo-cated in the Northern hemisphere (Tans et al., 1990; Keeling et al., 1996). With boreal forests covering large parts of the Northern hemisphere, knowledge of the carbon sink/strength of these regions is if great importance.
It is possible to measure the net exchange of CO2between
atmosphere and biosphere for long periods of time using eddy covariance methods. These measurements have proven to be of great importance for studies concerning carbon bud-gets and their seasonal patterns (e.g. Lindroth et al., 1998; Falge et al., 2002). However, measurements can be made
only at a limited number of locations due to the high costs of implementing the technique, for example, less than ten eddy covariance towers are currently operating in the forested ar-eas of Sweden which is not enough to represent the different forest age classes, species classes, etc., needed for making a precise national carbon balance estimate (Lagergren et al., 2006).
Two main approaches can be identified for obtaining larger scale estimates of carbon balance: i) employment of physi-ological process-based models, and ii) direct estimates from diagnostic models driven by remotely sensed data. The for-mer approach simulates ecosystem processes using detailed data sets of biophysical and meteorological conditions as in-put (e.g. Running and Hunt Jr, 1993; Liu et al., 1997). This is required for prognostic purposes, but an advanced process-based model is not necessarily more accurate than simpler models, mainly because of the high input demands. The sec-ond approach is based on the light-use efficiency concept de-vised by Monteith (1972, 1977) and Kumar and Monteith (1981), and modified by Prince (1991), which decomposes net primary productivity (NPP, Pn) into absorbed radiation
(APAR, the product of FAPAR, fa, and incident PAR, Ip)
and a light-use efficiency factor (ε):
Pn= εfaIp. (1)
The method has been proven attractive to implement on the basis of remote sensing since it is possible to obtain these parameters from satellite (e.g. Sellers et al., 1994; Nichol et al., 2000; Lobell et al., 2002).
While the gross primary productivity (GPP) gives the to-tal amount carbon fixated by photosynthesis, NPP – which is obtained by subtraction of the autotrophic respiration from GPP – gives the input of carbon to the ecosystem. Depend-ing on the definition of the LUE factor, both of these pro-ductivity measures can be successfully modeled on the ba-sis of light-use efficiency and remote sensing. For exam-ple, Xiao et al. (2004a,b) modeled the LUE factor as a func-tion of temperature, water and leaf phenology in a light-use efficiency-based GPP model. Running et al. (1999, 2000) used a process-based ecosystem model for determining LUE factors for daily GPP calculations. A number of NPP models based on the light-use efficiency concept have been published (e.g. Ruimy et al., 1994; Lagergren et al., 2005). However, since the computation of the LUE-factor usually requires me-teorological data, an operational LUE-based model may eas-ily be limited by the spatial resolution and accuracy of the meteorological input data sets (Sims et al., 2006).
The net ecosystem exchange (NEE) is obtained by sub-tracting ER from GPP. Since NEE gives the net amount of carbon uptake or release, this is a more appropriate measure than NPP and GPP of carbon sink strength (Schulze et al., 2002). However, using the LUE approach, or remote sensing techniques in general, for NEE modeling is problematic due to the difficulties involved in obtaining information on the
heterotrophic respiration from space (Valentini et al., 2000). The mechanisms behind decomposition of soil organic mat-ter are not yet fully understood as decomposition depends not only temperature but on a range of different environmen-tal constraints (Davidson and Janssens, 2006). Accordingly, estimating soil decomposition is hard in general, and espe-cially so using only data from satellite. Given the impor-tance of ER in controlling the forest carbon balance, espe-cially boreal forests at high latitudes (Valentini et al., 2000), there are strong arguments for including information on ER when studying carbon balance from space, despite the diffi-culties involved.
Most studies aiming at estimating NEE using remote sens-ing employ physiological process-based models which are parameterized for a specific location using flux data together with meteorological data; the model output is then scaled up using satellite data. Veroustraete et al. (1996) estimated NEE for a deciduous forest in Belgium using a physiological pro-cess model driven by the fractional absorption of PAR (FA-PAR) from satellite and meteorological data. Chiesi et al. (2005) estimated monthly NEE for a forested site in Italy by parameterizing and calibrating FOREST-BGC (Running and Coughlan, 1998), including FAPAR derived from Landsat normalized difference vegetation index (NDVI). With cor-relation coefficients above 0.9, NEE was obtained with high accuracy when comparing to ground-measured NEE. Hunt et al. (2004) used a LUE-based approach instead of a pro-cess model for obtaining NEE for two rangeland sites in the US. The model was driven by meteorological data together with satellite-derived FAPAR. The authors also investigated the relationship between APAR and NEE for the rangeland sites and a coniferous forest site; a linear relationship was found for the rangeland sites but not for the coniferous site.
The RACES (Regional Arctic CO2 Exchange Simulator)
equations allow for calculation of ER and GPP using only three variables: NDVI and PAR for calculation of GPP and temperature and NDVI for calculation of respiration (Vourli-tis et al., 2003). This limited input demand make the equa-tions attractive from a remote sensing perspective and, hence, allow for larger spatial representation. The model has been used for NEE studies in arctic ecosystems (Oechel et al., 2000; Vourlitis et al., 2000, 2003).
Turner et al. (2004) used remotely sensed data on land cover, stand age and harvesting in combination with BIOME-BGC (Law et al., 2001), coupled with a regional climate dataset, for monitoring of the carbon sequestration for a re-gion in the state of Oregon, USA.
A different approach was presented by Churkina et al. (2005) who used flux measurements from 28 sites in North America, Europe and Brazil for investigating the relation-ship between NEE and the carbon uptake period. The au-thors found a linear relationship between the two parameters and with the possibility of obtaining the carbon uptake pe-riod from satellite vegetation indices, the approach has the
potential of extrapolating NEE over large areas without rely-ing on heavy input datasets.
Rahman et al. (2005) investigated the relationship between MODIS enhanced vegetation index (EVI) and GPP; and MODIS surface temperature and respiration using data from ten flux tower sites across the US. The authors identified the scientific need for an operational per-pixel production model and suggested that NEE can be obtained solely from satellite parameters.
Sims et al. (2006) also identified the need for a fully satel-lite driven productivity model not relying on the traditional LUE approach, and investigated the use of MODIS EVI for GPP estimations using data from nine flux tower sites across the US. The authors showed that a GPP model driven solely by EVI performs as good as or even better than the MODIS GPP product. The authors state that they are exploring the use of satellite derived air temperature for a robust carbon balance model entirely based on satellite data. The MODIS GPP product, which gives eight day averages of GPP glob-ally at 1 km resolution, was in turn validated by (Turner et al., 2003) who compared MODIS GPP to ground measured GPP for a boreal and a hardwood site in the US. It was found that the product overestimated growing season GPP at the hard-wood site while an underestimation was found at the boreal site.
In general, the main advantages of a LUE-model for esti-mation of NPP or GPP lies in the possibilities of operational implementation (Running et al., 2000), and that it can out-put productivity with high accuracy if parameterized correct (Turner et al., 2005). However, a LUE-model usually re-lies on meteorological data sets for obtaining the LUE-factor. With some meteorological variables being only available at about 1◦×1◦, a meteorological data set may be too coarse to take the heterogeneity in LUE into account, and accordingly, may result in erroneous estimates of carbon uptake (Turner et al., 2002; Sims et al., 2006). Alternatively, parameteriza-tion of process-based model can give the full carbon balance (NEE) but this will require a detailed input data set that is rarely available on a regional scale, making it hard to imple-ment operationally.
For these reasons, the aim of this paper is to investigate the possibilities of implementing a model for obtaining NEE, GPP and respiration over large areas. The aim is to no rely on large input data sets but to drive the model using only a few parameters that can be obtained from satellite.
2 Data and methodologies
2.1 In-situ measurements
NEE, PAR and air temperature (AT) were measured at seven sites in Northern Europe (Table 1), and used in the analy-sis. Negative values of NEE and GPP indicate a release of carbon; positive values indicate uptake, while positive values
of respiration indicate release. Table 2 gives the years for which data were acquired. The flux towers are part of the CARBOEUROPE project (CARBOEUROPE, 2005). No er-ror analysis of the data was performed in this study. Daily max. NEE was calculated as the mean of five values cen-tered on the daily maximum. These daily values were then averaged over the months.
Incident PAR was measured using PAR sensors mounted on the flux towers at Asa with a LiCor 190SB at 38 m tower hight (Berggren et al., 2004), a LiCor 190SZ at 98 m tower hight in Norunda (Lundin et al., 1999), LiCor 190SB at 22 m tower hight in Skyttorp and Knottåsen (Berggren et al., 2004). Shortwave radiation at Hyytiälä was measured with a Reemann TP-3 pyranometer (Kolari et al., 2004), a Kipp & Zonen CM11 in Sorø (Pilegaard et al., 2001) and a Kipp & Zonen CM14 in Hainich (Knohl et al., 2003). A PAR-to-shortwave conversion factor of 0.43 was used (Olofsson et al., 2007).
AT is defined as the averaged daily temperature when the global radiation exceeds 1 W m−2.
The reason for including Hainich is that data from only one deciduous site (Sorø) is present in the material, and by including Hainich, which is rather similar to the beech forest in Southern Scandinavia, the amount of deciduous data is doubled.
2.1.1 GPP and ER from measured NEE
GPP and ER were derived from the NEE measurements. Res-piration at Norunda was derived from a two month relation-ship of average night NEE and night temperature; while res-piration at Skyttorp was derived from a half month relation-ship between air temperature and night NEE. At the other sites, respiration was obtained through a short-term temper-ature response of night-time fluxes based on NEE. This pro-cessing had been performed beforehand since all data were obtained through the CARBOEUROPE project. A review of the different methods for separating ER and GPP from NEE measurements is given by Reichstein et al. (2005). Correct ground measurements are crucial when comparing against values derived from satellite measurements for evaluation of model accuracy and robustness. Although no error analysis of the flux measurements was performed, averaging the data over long periods (from half-hourly to monthly) reduced the random sampling errors to relatively small values (Baldoc-chi, 2003).
2.2 NDVI
The NDVI is the normalized quotient of the near infrared and red surface reflectance (ρN I Rand ρR, respectively):
NDVI=ρN I R− ρR ρN I R+ ρR
. (2)
The NDVI data set for Scandinavia is based on season-ally adjusted NDVI at 250 m resolution from Terra/MODIS.
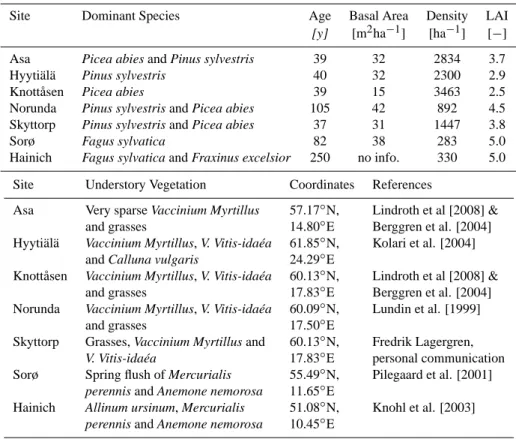
Table 1. Information on the sites (Pinus sylvestris is Scots pine, Picea abies Norway spruce, Fagus Sylvatica beech and Fraxinus excelsior ash).
Site Dominant Species Age Basal Area Density LAI
[y] [m2ha−1] [ha−1] [−]
Asa Picea abies and Pinus sylvestris 39 32 2834 3.7 Hyytiälä Pinus sylvestris 40 32 2300 2.9 Knottåsen Picea abies 39 15 3463 2.5 Norunda Pinus sylvestris and Picea abies 105 42 892 4.5 Skyttorp Pinus sylvestris and Picea abies 37 31 1447 3.8 Sorø Fagus sylvatica 82 38 283 5.0 Hainich Fagus sylvatica and Fraxinus excelsior 250 no info. 330 5.0
Site Understory Vegetation Coordinates References
Asa Very sparse Vaccinium Myrtillus 57.17◦N, Lindroth et al [2008] & and grasses 14.80◦E Berggren et al. [2004] Hyytiälä Vaccinium Myrtillus, V. Vitis-idaéa 61.85◦N, Kolari et al. [2004]
and Calluna vulgaris 24.29◦E
Knottåsen Vaccinium Myrtillus, V. Vitis-idaéa 60.13◦N, Lindroth et al [2008] & and grasses 17.83◦E Berggren et al. [2004] Norunda Vaccinium Myrtillus, V. Vitis-idaéa 60.09◦N, Lundin et al. [1999]
and grasses 17.50◦E
Skyttorp Grasses, Vaccinium Myrtillus and 60.13◦N, Fredrik Lagergren,
V. Vitis-idaéa 17.83◦E personal communication Sorø Spring flush of Mercurialis 55.49◦N, Pilegaard et al. [2001]
perennis and Anemone nemorosa 11.65◦E
Hainich Allinum ursinum, Mercurialis 51.08◦N, Knohl et al. [2003]
perennis and Anemone nemorosa 10.45◦E
Table 2. The sites, tree type and for which data is available.
Site Country Type 2000 2001 2002 2003 2004 2005
Asa SWE Con. – – √ – – –
Hyytiälä FIN Con. √M √M √M √M √M √ Knottåsen SWE Con. – √ √ – – – Norunda SWE Con. √M √M √M √ – – Skyttorp SWE Con. – – √ – – – Sorø DEN Dec. √M √M √M √ √ √ Hainich GER Dec. √M √M √M √ √ √
MData used for model construction and excluded from the evaluation.
Creation and validation of the data set is described and dis-cussed in Olofsson and Eklundh (2007). MODIS NDVI for Hyytiälä and Hainich were obtained from the MODIS ASCII Subset project at 1 km resolution. The data were processed in the same manner as the data set in Olofsson and Eklundh (2007), which includes season adjustments by nonlinear least square fitting of local double logistic model functions to the time-series, using the computer program TIMESAT. TIME-SAT fits the function to the upper envelope of the VI data, thus, effectively reducing negatively biased noise due to re-maining atmospheric influence. The least-squares procedure
also, to some extent, eliminates single outliers such as the high values often occurring during early and late parts of the season, when Solar zenith angles are very high (Jönsson and Eklundh, 2002, 2004). This processing is done in order to filter out the noise in the VI time series, clearly visible in Figs. 1 and 2.
Since Hyytiälä and Hainich were not included in the data set created by Olofsson and Eklundh (2007), 1 km NDVI time series at these two sites were obtained from The Oak Ridge National Laboratory Distributed Active Archive Cen-ter (ORNL DAAC).
20000 2001 2002 2003 2004 2005 2006 50 100 150 200 250 Year
EVI for a coniferous site (0 − 255)
KNO EVI
TS EVI 1 km TS EVI 250 m Raw EVI 1 km Raw EVI 250 m
Fig. 1. Raw and TIMESAT-adjusted EVI at both 0.25 and 1 km resolution for a coniferous site at 60◦N (Knottåsen).
2.3 EVI
The EVI was developed to optimize the vegetation signal but maintaining sensitivity in high biomass areas, while mini-mizing background and atmospheric influences (Huete et al., 2002). The EVI is defined as
EV I= G ρN I R− ρR L+ ρN I R+ C1ρR− C2ρB
, (3)
where G is a gain factor; C1 and C2 are coefficients for
correction of atmospheric influences utilizing the red and blue bands; and L is a background adjustment factor that compensates for the higher near infrared reflectance due to the red extinction through the canopy (Liu and Huete, 1995; Huete et al., 1997, 2002).
EVI at 250 m and 1 km were acquired from Terra/MODIS and processed in the same manner as the NDVI data (Olofs-son and Eklundh, 2007), which includes the TIMESAT pre-ocessing.
The EVI data cover Scandinavia and Finland (tiles H18V02, H18V03 and H19V02). Only 250 m data was used in the analysis for Sorø since the MODIS 1 km pixel rep-resents other land covers than deciduous forest at this site (Olofsson and Eklundh, 2007).
2.4 VI issues
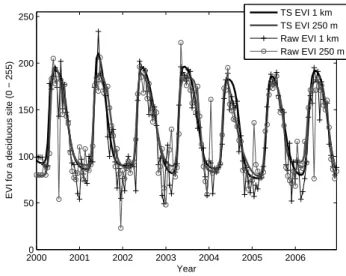
Time series of EVI, NDVI and FAPAR for a specific flux site were constructed using values from the single pixel centered on the flux site. Figure 1 shows raw and TIMESAT-adjusted EVI at both 250 m and 1 km resolution for the Knottåsen site (coniferous). It is apparent that the 250 m EVI is unable to trace the seasonal development of the vegetation, mainly be-cause of unrealistically high values in between the growing
20000 2001 2002 2003 2004 2005 2006 50 100 150 200 250 Year
EVI for a deciduous site (0 − 255)
TS EVI 1 km TS EVI 250 m Raw EVI 1 km Raw EVI 250 m
Fig. 2. Raw and TIMESAT-adjusted EVI at both 0.25 and 1 km resolution for a deciduous site at 55◦N (Sorø).
seasons. TIMESAT eliminates the most severe outliers but is unable to extract the seasonal dynamics. The 1 km data on the other hand displays the expected seasonal trend clearly. Although not plotted, there is a large difference between the 250 m and 1 km data also at the other coniferous sites. The situation is strikingly different for the Hainich site (decidu-ous) as seen in Fig. 2. The NDVI is not exhibiting the same difference between resolutions, and as stated, there is no dis-crepancy in EVI for the deciduous pixels. Why there is such a difference in EVI, but not for NDVI, between the two res-olutions for the coniferous sites is not fully clear. It is hy-pothesized that three different factors interact to generate the erroneous values: i) failure of retrieving aerosol depth result-ing in poor atmospheric correction; ii) presence of light snow cover not detected by the snow algorithm; iii) downsampling of the blue band from 500 to 250 m (Kamel Didan, personal communication). A study is currently being planned aiming at investigating the reasons for the observed differences and evaluating the performance of the MODIS NDVI and EVI at 1 km , 500 and 250 m across Scandinavia.
2.5 FAPAR
An FAPAR data set based on MODIS 250 m NDVI across Scandinavia was created by Olofsson and Eklundh (2007). The data set was evaluated at Sorø, Asa, Norunda, and Skyt-torp, and produced an RMSE of the means at these sites be-tween 2.5 to 6.6% at a daily basis. The data were monthly averaged for use in this study which is likely to have de-creased the errors further. Since the data set was created for Scandinavia, FAPAR data for Hyytiälä and Hainich was lacking. To obtain these data, the NDVI-FAPAR relation-ship observed in Olofsson and Eklundh (2007) was applied to the 1 km NDVI at these sites. However, the NDVI-FAPAR
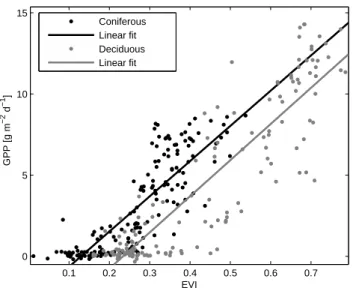
0.1 0.2 0.3 0.4 0.5 0.6 0.7 0 5 10 15 EVI GPP [g m −2 d −1 ] Coniferous Linear fit Deciduous Linear fit
Fig. 3a. Relationship between 1 km EVI and monthly averages of GPP. r2=81% and 69% for the deciduous and coniferous data,
re-spectively.
relationship established is valid for the 250 m NDVI while the NDVI for these sites has a spatial resolution of 1 km. The 1 km and 250 m NDVI data, just like the EVI, do not appear to behave in the same manner, and a comparison between the NDVI time series at Norunda and Hyytiälä reveals that the winter values for all years are lower at the latter site. Bear-ing this in mind, applyBear-ing the NDVI-FAPAR relationship ob-served in Olofsson and Eklundh (2007) to the 1 km NDVI at Hyytiälä will generate a somewhat biased FAPAR. Exactly how large this bias is and how large the difference between 1 and 0.25 km NDVI is, will be investigated in a future study. 2.6 Models
Obtaining estimates over large areas requires NEE to be de-rived from parameters obtained at high areal and temporal resolution as the involved processes’ responses to the envi-ronment are non-linear. Since NEE (Fn) is the difference
between GPP (Pg) and ER (Re),
Fn= Pg− Re, (4)
both terms need to be modeled.
The vegetation indices (VIs) are obtained from satellite; APAR is estimated with FAPAR from satellite (see below) and measured PAR. AT is measured – these parameters are as input for predicting the biophysical parameters: NEE, GPP, and respiration. To solve this task, linear regression models were constructed for monthly values of GPP and ER, for the two different forest types.
For GPP, a simple linear model with EVI and APAR as independent variables gave the best fit to measured values: Pg(t )= a1+a2E(t )+a3Ip,a(t )+ǫ(t), ǫ(t) ∈ N(0, σ2),(5) 25 0.5 0.75 0 5 10 15 20 25 30 EVI Max. NEE [g m −2 d −1 ] Coniferous Linear fit Deciduous Linear fit
Fig. 3b. Relationship between 1 km EVI and monthly averages of max. NEE. r2 = 83% and 72% for the deciduous and coniferous data, respectively.
where E(t ) is EVI at month t, Ip,a(t ) the amount of
ab-sorbed PAR at month t , and {ǫ(t )} is independent Gaussian white noise. APAR is calculated as the product of measured incident PAR and the FAPAR obtained from Terra/MODIS NDVI in Olofsson and Eklundh (2007) (see Sect. 2.5).
Since soil respiration is a highly complex biological pro-cess involving many variables which are not possible to de-rive using the limited number of satellite parameters we have at our disposal (Davidson and Janssens, 2006), an external variable is most likely needed. It has been shown that the Lloyd-Taylor equation for calculation of soil respiration can be successfully used with the original parameterization for obtaining ecosystem respiration for many of the sites in this study (Anders Lindroth, unpublished results). The expres-sion is given by Re = R10exp ( a1 a2 − a1 T − a3 ), (6)
where R10is the site-specific respiration rate at T=10◦; and
a1−3are model coefficients (Lloyd and Taylor, 1994). The
original coefficients were derived from a large data set on soil respiration representing ecosystems all over the world, however, no boreal forests were included and a new set of coefficients based on the data in the present study was there-fore derived using non-linear least squares methods. An R10
value was derived from the data set for each site and year. Different sets of model coefficients were calculated for de-ciduous and coniferous stands, respectively, and in order not to use the same data for model parameterization and eval-uation, about half of the data was used for estimation and the other half for validation. Three years from Hainich and three years from Sorø were used for estimating the deciduous
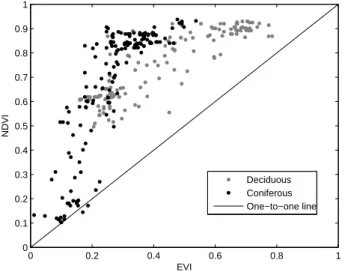
0 0.2 0.4 0.6 0.8 1 0 0.1 0.2 0.3 0.4 0.5 0.6 0.7 0.8 0.9 1 EVI NDVI Deciduous Coniferous One−to−one line
Fig. 4. Scatterplot of 1 km EVI and 250 m NDVI for all sites listed in this study.
model and the rest of the data (also 6 years) was used for evaluating the performance of the model. All the data from Norunda and Hyytiälä except the last year at each site was used for estimating the model for the coniferous stands (8 years of data) while the rest of the data was used for evalua-tion (6 years of data, all stands represented). Since the data used for evaluation was completely excluded from the data used for estimating the model, the model performance gives the accuracy by which these biophysical parameters can be obtained using this technique.
Given that the validation set differs from the calibration set, both in time and space, the validation tests for model ro-bustness both in location and time. The model accuracy is re-ported by the root mean square error (RMSE) and the coeffi-cient of determination r2(the squared correlation coefficient of the predicted and measured values, y and ˆy), respectively) which gives the amount of response variation explained by the model.
3 Results and discussion
3.1 Operational remote sensing of APAR and AT
The models were estimated using measured values on AT and PAR, with APAR being the product of measured PAR and FAPAR estimated from satellite. In order for the methodol-ogy to be used on an operational basis, these parameters have to be available from satellite at the same resolution as the VIs and FAPAR. Van Laake and Sanchez-Azofeifa (2004, 2005) presented a method which gives incident PAR by implemen-tation of a simple radiative transfer model where the amount of PAR is a function of the solar constant, solar zenith an-gle and the atmospheric transmittance, which in turn is
cal-0 0.25 0.50
EVI
Jul −01 Jan −01 Jul −02 −2
0 2 4 6 8 10 Time GPP [g m −2 d −1 ] EVI GPP
Fig. 5. Monthly values of EVI and GPP at Knottåsen 2001 and 2002.
Table 3. Correlation between monthly averages of parameters ob-tained from satellite (X) and ground measured data (Y ).
Dec. r(X, Y ) NEE GPP ER maxNEE minNEE APAR 0.86 0.91 0.79 0.88 –0.69 AT 0.79 0.87 0.85∗ 0.88 –0.72 EVI 0.83 0.90 0.79 0.91 –0.74 NDVI 0.73 0.79 0.70 0.82 –0.67 Con. r(X, Y ) NEE GPP ER maxNEE minNEE APAR 0.76 0.93 0.81 0.89 –0.70 AT 0.61 0.90 0.92∗ 0.90 –0.80 EVI 0.67† 0.83† 0.76† 0.85† –0.68† NDVI 0.49† 0.70† 0.66† 0.74† -0.63†
∗ Logarithmic ER
† Correlation between VI at time t+ 1 months and parameter at
time t .
culated using daily atmospheric data from the MODIS sen-sor onboard the NASA platforms Terra and Aqua. Olofsson et al. (2007) implemented the method for Scandinavian con-ditions and found that five day averages of PAR could be op-erationally obtained with an r2of 83% at Norunda and 74% at Asa. It is likely that monthly averages would yield higher accuracies.
As an alternative approach, Liang et al. (2006) psented a new method for estimating incident PAR using re-flectance data from MODIS. Surface and top-of-atmosphere reflectance were used for deriving both diffuse and direct in-stantaneous PAR. Daily values were obtained by regression analysis. With the use of look-up tables and by assuming known aerosol properties the method does not rely on at-mospheric data which has proven to be hard retrieve from
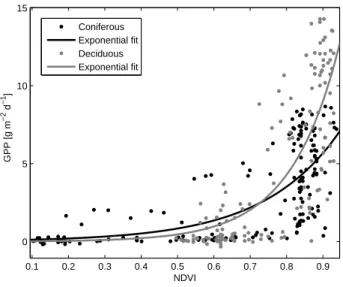
0.1 0.2 0.3 0.4 0.5 0.6 0.7 0.8 0.9 0 5 10 15 NDVI GPP [g m −2 d −1 ] Coniferous Exponential fit Deciduous Exponential fit
Fig. 6a. Relationship between 1 km NDVI and monthly averages of GPP. r2=62% and 49% for the deciduous and coniferous data,
respectively. 0.1 0.2 0.3 0.4 0.5 0.6 0.7 0.8 0.9 0 5 10 15 20 25 NDVI Max. NEE [g m −2 d −1 ] Coniferous Exponential fit Deciduous Exponential fit
Fig. 6b. Relationship between 1 km NDVI and monthly averages of max. NEE. r2= 67% and 55% for the deciduous and coniferous data, respectively.
satellite. The results published so far are promising, and rel-ative errors as low as 2% for daily values have been reported (Liang et al., 2006).
Accordingly, incident PAR can be obtained at high accu-racy from e.g. the MODIS sensor. Temperature can also be obtained from MODIS: the land surface temperature prod-uct gives temperature at 1 km resolution globally every day by the use of seven thermal infrared bands (Wan and Li, 1997). The product have been validated against ground mea-sured temperature and high accuracies have been reported,
0.1 0.2 0.3 0.4 0.5 0.6 0.7 −2 0 2 4 6 8 EVI NEE [g m −2 d −1 ] Coniferous Linear fit Deciduous Linear fit
Fig. 7. Relationship between 1 km EVI and monthly averages of NEE. r2=69% and 45% for the deciduous and coniferous data,
re-spectively. 0.1 0.2 0.3 0.4 0.5 0.6 0.7 0.8 0.9 −2 0 2 4 6 8 NDVI NEE [g m −2 d −1 ] Coniferous Exponential fit Deciduous Exponential fit
Fig. 8. Relationship between 1 km NDVI and monthly averages of NEE. r2=53% and 24% for the deciduous and coniferous data,
respectively.
however, since thermal infrared signals from the earth sur-face are hard to register by a satellite sensor when clouds are present, temperature is only retrieved when the sky is clear (Wan et al., 2004). Furthermore, the MODIS sensor is car-ried by both the Terra and Aqua platforms, resulting in two daily observations around noon instead of daily means. As-suming that AT, as it is defined in this study, can be obtained from satellite is therefore not a fully valid assumption. As an alternative to satellite observations, regional climate data sets is a solution. For example, the SWECLIM data set gives
Table 4. Models for GPP and ER. Deciduous
Pg= 0.24Ip,a+ 10E − 3.7
Re= R10exp[105.9(34.18−1− (T − 247.4)−1)]
Coniferous
Pg= 0.19Ip,a+ 4.3E − 0.9
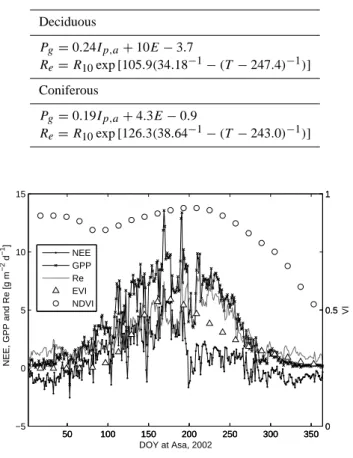
Re= R10exp[126.3(38.64−1− (T − 243.0)−1)] 50 100 150 200 250 300 350 −5 0 5 10 15 NEE, GPP and Re [g m −2 d −1 ] 50 100 150 200 250 300 350 0 0.5 1 50 100 150 200 250 300 350 0 0.5 1 VI DOY at Asa, 2002 NEE GPP Re EVI NDVI
Fig. 9. Daily GPP, ER and NEE together with 16-days composites of EVI and NDVI at Asa 2002.
modeled air temperature with a three hour temporal resolu-tion across the Nordic countries (Rummukainen et al., 2000). 3.2 Correlation between satellite and biophysical
parame-ters
Figure 3 shows the relationships between 1 km EVI and GPP (a) and daily maximum NEE (b) averaged over one month and for all coniferous and deciduous data, ex-cept for Sorø where 250 m data was used since the 1 km pixel is clearly influenced by the surrounding crop lands. The linear correlation is stronger for the deciduous sites, r(E, Pg)=0.90; r(E, Fn,max)=0.91, than for the coniferous
sites (0.83 and 0.85, respectively). One of the reasons for this is that the deciduous data are collected from only two sites (12 years of data), which are quite similar in terms of species and structure, while the coniferous data are collected at five different sites, including both pure and mixed stands of Scots pine and Norway spruce, for a total of 15 years. Another reason is that the EVI has a larger dynamic range for the deciduous sites than for the coniferous, with EVI values ranging between about 0.15 and 0.8 as compared to 0− 0.5 for the coniferous (Fig. 4, also evident in Figs. 1
−15 −10 −5 0 5 10 15 20 25 −2 −1.5 −1 −0.5 0 0.5 1 1.5 2 2.5 3 AT [deg. C] log(ER) [g m −2 d −1] Nor lin Hyy lin Asa lin Sky lin Kno lin
Fig. 10a. Relationship between monthly averages of logarithmic ecosystem respiration and air temperature for the coniferous data.
−5 0 5 10 15 20 −1.5 −1 −0.5 0 0.5 1 1.5 2 2.5 3 AT [deg. C] log(ER) [g m −2 d −1 ] Hai Lin. fit Sor Lin. fit
Fig. 10b. Relationship between monthly averages of logarithmic ecosystem respiration and air temperature for the deciduous data.
and 2), which in combination with higher uptake levels re-sults in a stronger correlation. It was found that the produc-tivity of the coniferous ecosystems is one month ahead the EVI (Fig. 5), or in other words, the EVI reaches the corre-sponding GPP level one month “too late”, and the reported relationships were established using the EVI data from the one month following of the biophysical parameters. (This is clearly illustrated in Fig. 5 which shows EVI and GPP for the Knottåsen site.) The reason for this is not fully clarified. One issue that may help explain the phenomenon is the use of TIMESAT; the original EVI sometimes exhibits a peak in the beginning of summer which tends to be eliminated by the adjustment. This is obvious in Fig. 1 – which, just as Fig. 5,
Hai030 Hai04 Hai05 Sor03 Sor04 Sor05 5 10 15 R2 = 86%; RMSE = 1.78 GPP Meas. Model
Hai030 Hai04 Hai05 Sor03 Sor04 Sor05 5
10 15
R2 = 73%; RMSE = 1.42
ER
Hai03 Hai04 Hai05 Sor03 Sor04 Sor05 −5 0 5 10 R2 = 61%; RMSE = 1.85 NEE a. b. c.
Fig. 11. Measured and modeled time series of GPP, RE and NEE for the deciduous stands [g m−2d−1].
shows 1 km EVI at Knottåsen – for the EVI curves 2001 and 2002 (and also 2006), especially for 2002 where the original EVI peaks about one month before the TIMESAT-adjusted EVI.
The GPP-NDVI and max. NEE-NDVI relationships are weaker than the EVI relationships because the NDVI satu-rates at high uptake levels (Fig. 6). Only 250 m data has been used except in Hainich and Hyytiälä, so the area rep-resentation is likely to be higher for the NDVI than for the EVI. As stated by Huete et al. (2002), one of the main ad-vantages of the EVI over the NDVI is the higher sensitivity over regions with high biomass, making the the former less prone to saturation, a fact which is confirmed by the results of this study. As stated, the NDVI values are higher than the EVI values for almost all data points, with an average NDVI of 0.65 and 0.75 for the coniferous and deciduous sites, re-spectively, as compared to 0.27 and 0.41 for the EVI. The same has been found in ecosystems considerably different from the ones in this study (Huete et al., 2002; Fensholt et al., 2006). However, NDVI correlates fairly well with the maxi-mum uptake (r=0.86 and 0.73 for deciduous and coniferous data, respectively), but due to the exponential behavior in-duced by the NDVI saturation, the confidence and prediction intervals are wider compared to the EVI relationships, espe-cially for the deciduous data. The correlation coefficients are given in Table 3, which also gives the correlation between the VIs and monthly values of NEE and respiration; again, EVI is superior to the NDVI and correlates better with all parameters for both forest types, and again, the saturation of the NDVI at higher levels of uptake (or release for respira-tion) is responsible for the lack of correlation. The saturation
Nor030 Hyy05 Asa02 Sky02 Kno01 Kno02
5 10 R2 = 93%; RMSE = 0.8 GPP Meas. Model
Nor030 Hyy05 Asa02 Sky02 Kno01 Kno02
5 10
R2 = 93%; RMSE = 0.59
ER
Nor03 Hyy05 Asa02 Sky02 Kno01 Kno02
−5 0 5 R2 = 75%; RMSE = 0.73 NEE a. b. c.
Fig. 12. Measured and modeled time series of GPP, RE and NEE for the coniferous stands [g m−2d−1].
generates a characteristic “wall” of NDVI values around 0.9, parallel to the y axis (Figs. 6 and 8), which is not present for the EVI (Figs. 3 and 7). There is low correlation be-tween monthly NEE and the VIs, considerably lower than for GPP and ER, mainly because of a slight time discrep-ancy in the seasonal development between productivity and ER. This occurs because the latter depends on both air and soil temperature, and soil temperature lags air temperature, which causes a decrease in the net carbon uptake sometime around late summer. With NDVI being less able to capture the vegetation peak, EVI is better correlated with these pa-rameters. An example of this is given in Figure 9 which shows NEE, GPP, ER and the VIs for Asa 2002; the EVI traces the NEE until about DOY 190 where the carbon up-take suddenly drops. APAR is the main driver of photosyn-thesis and not surprisingly correlates better to all biophysical parameters than the VIs (Table 3). AT correlates very well with logarithmic ER for the coniferous data, with correla-tion coefficients of 1.0 when rounded at Asa (which is suspi-ciously high although derived from only twelve points), 0.98 at Skyttorp, 0.97 at Hyytiälä, 0.96 at Knottåsen and 0.89 at Norunda (Fig. 10a). The relationship is weaker for the decid-uous stands (Fig. 10b), r[T , log(R)]=0.85 (0.91 for Hainich and 0.87 for Sorø). As seen by the slope of the linear fit, ER also seems to be responding to temperature quite differently, with the response being much sharper at Sorø indicating that an increase in temperature results in sharper rise in ER at Sorø than in Hainich.
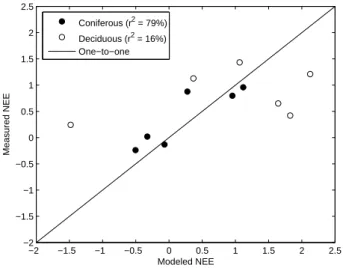
−2 −1.5 −1 −0.5 0 0.5 1 1.5 2 2.5 −2 −1.5 −1 −0.5 0 0.5 1 1.5 2 2.5 Modeled NEE Measured NEE Coniferous (r2 = 79%) Deciduous (r2 = 16%) One−to−one
Fig. 13. Scatterplot of annually averaged measured and modeled NEE [g m−2d−1].
3.3 Models of ER, GPP and NEE
Different sets of models were constructed for the two for-est types (Table 4). The models were constructed using data from certain sites and evaluated in others.
The strong correlations reported here (Table 3) indicate that the biophysical parameters, GPP and max. NEE above all, can be obtained using a simple linear regression model with only one independent variable. For example, when esti-mating Pg(t )using E(t+1) as independent variable, the
re-gression model explains 79% of the variation for the conif-erous data. Using Ip,a(t )instead gives an r2value of 90%.
The corresponding figures using E(t ) and Ip,a(t )for the
de-ciduous data are 76% and 78%, respectively. These results support the findings of Sims et al. (2006) who stated that EVI alone can be used successfully for estimating GPP. Us-ing APAR instead of EVI will give even higher accuracies, assuming that incident PAR can be obtained with high accu-racy.
Coniferous max. NEE was estimated using E(t+1) as in-dependent variable with an r2value of 80%. Using APAR instead gave a lower accuracy which is a bit surprising since the full APAR time series correlated better with max. NEE than the EVI. Also deciduous max. NEE was more accu-rately modeled using E(t ) as independent variable, with 80% of the variation in measured max. NEE explained. Accord-ingly, the maximum carbon uptake, calculated as the mean of the five observation around the highest daily recorded value, can be modeled on a monthly basis using EVI alone with an r2value of 80% for both forest types.
As expected, monthly coniferous NEE can not be mod-eled using neither APAR, EVI nor AT alone, nor combined in a multiple regression model. These models explained only about 50% or less of the measured variation in NEE. The
de-Fig. 14. Map over Northern Europe showing the different sites.
ciduous NEE in this study was more regular and displayed a higher degree of periodicity, resulting in higher correlations with e.g. APAR, thereby making it possible to estimate it di-rectly from APAR alone. Even though such a model explains about 75% of the variation, it is likely that the inclusion of other stands would lower that figure, making it necessary to include e.g. temperature. However, more data is needed be-fore such conclusions can be drawn.
To obtain NEE, individual multiple regression models for GPP and ER were created. It was found that using EVI and APAR as independent variables for GPP gave the highest ac-curacy, with APAR being a more important variable explain-ing more of the variation than EVI. No accuracy was gained by using E(t+1) instead of E(t), probably because APAR is the more important variable. As suggested by the observed correlations in Table 3, using EVI instead of NDVI gave a higher correlation, probably because of the larger dynamic range of the EVI. Monthly GPP was well described by the re-gression models, with a large proportion of the total variabil-ity in measured GPP being explained by the model: r2=86% (dec.) and r2=95% (con.), respectively (Figs. 11 and 12; and Tables 4 and 6). The lower accuracy for the deciduous stands is to a large extent caused by an underestimation of the
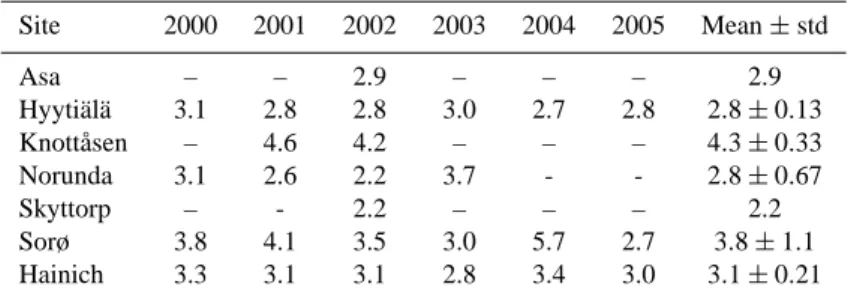
Table 5. Values of R10for each site and year. Last column gives the mean and standard deviation. Site 2000 2001 2002 2003 2004 2005 Mean± std Asa – – 2.9 – – – 2.9 Hyytiälä 3.1 2.8 2.8 3.0 2.7 2.8 2.8± 0.13 Knottåsen – 4.6 4.2 – – – 4.3± 0.33 Norunda 3.1 2.6 2.2 3.7 - - 2.8± 0.67 Skyttorp – - 2.2 – – – 2.2 Sorø 3.8 4.1 3.5 3.0 5.7 2.7 3.8± 1.1 Hainich 3.3 3.1 3.1 2.8 3.4 3.0 3.1± 0.21
Table 6. Coefficients of determination and RMSE [g m−2d−1] of modeled GPP, ER and NEE.
Error and r2 NEE GPP ER Deciduous, r2 61% 86% 73% Deciduous, RMSE 1.8 1.8 1.4 Coniferous, r2 75% 95% 93% Coniferous, RMSE 0.73 0.80 0.59
productivity peaks during the summers in Sorø. Since the coniferous GPP model is constructed using data from only two sites and evaluated at five sites representing four years, the r2value of 95% indicates that the model is robust both in time and space. With only two stands, the same conclu-sion cannot be drawn for the deciduous model. However, a high accuracy is achieved and even though more validation is needed, the results indicate that deciduous GPP can be ac-curately modeled on an operational basis using only EVI and APAR as independent variables. It is evident from Fig. 11 that the accuracy of the NEE modeling suffers from failure to capture the high respiration at Sorø during the summer of 2005, and overestimates the spring productivity during 2005. The high productivity rates during 2004 cannot be explained by any of the satellite parameters since they do not increase from 2003 to 2004, in fact, both APAR and AT decrease from the summer of 2003 to 2004 and with summer EVI staying the same, the model will output a relatively low GPP, causing a large error.
ER was modeled using Eq. 4, and just as with GPP, a high accuracy was achieved, especially for the coniferous data (r2=73% and r2=93%; Figs. 11 and 12; and Tables 4 and 6). As evident in Fig. 12, modeled coniferous ER traces measured ER very well. The accuracy of the deciduous ER model is not able to capture the much higher respiration rates at Sorø compared to Hainich, especially during 2005. How-ever, chamber measurements of ER at Hainich indicate that the respiration rate is slightly higher than the flux based es-timates included in the database used in this study (Knohl
et al., 2007). The differences between the two sites would have been less and which might have resulted in a better fit if these data would have been used instead. There is also a weaker relationship between AT and ER for the deciduous data (Table 3), with the two stands exhibiting quite different responses in ER to changes in AT (Fig. 10b). Since AT is strongly correlated to logarithmic ER, an attempt was made to model ER as an exponential function of AT without rely-ing on R10. Even though such a model will be able to
ex-plain much of the variation in ER at a specific site, the model – which was constructed in the same manner as the GPP model – was unable to capture the respiration magnitudes for the different sites, confirming the findings of Janssens et al. (2001) who found AT to control changes in soil respiration within sites but not between sites. For example, the model was able to simulate ER at Hyytiälä 2005 and Asa which ex-hibits quite similar AT response (Fig. 10a), but failed to cap-ture the high respiration rates during summer at Knottåsen. As a consequence, an external factor which defines the site-specific magnitude in ER has to be introduced. Equation 4 uses the year- and site-specific ER rate at 10◦, R10, which is
derived from the observed logarithmic ER and AT relation-ship, and hence, makes the model non-operational as there is no established approach to obtain this parameter from space. The observed R10are given in Table 5. An attempt was made
to relate these values to the VI’s but no significant relation-ships were found.
NEE is the difference between productivity and respira-tion, and modeled NEE was here defined as the difference between modeled GPP and ER. Much of the carbon fixed by photosynthesis in Northern European forests is lost through respiratory processes (Valentini et al., 2000), which – from a computational aspect – means that the remaining NEE be-comes small and therefore is more likely to generate a higher relative error in the modeled time series, and hence, weaker correlation. This is especially true for the boreal sites which have an annual NEE close to zero. At Norunda, for exam-ple, an annual carbon loss has been observed, probably due to past soil drainage which enhance the respiratory processes at this site (Lindroth et al., 1998). Therefore, it is not surpris-ing that the fit of modeled NEE to measured data was weaker
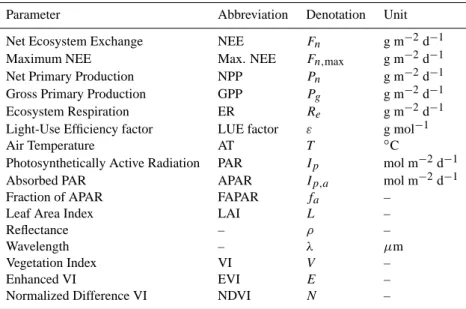
Table 7. Abbreviations, denotations and units.
Parameter Abbreviation Denotation Unit Net Ecosystem Exchange NEE Fn g m−2d−1
Maximum NEE Max. NEE Fn,max g m−2d−1
Net Primary Production NPP Pn g m−2d−1
Gross Primary Production GPP Pg g m−2d−1
Ecosystem Respiration ER Re g m−2d−1
Light-Use Efficiency factor LUE factor ε g mol−1 Air Temperature AT T ◦C
Photosynthetically Active Radiation PAR Ip mol m−2d−1
Absorbed PAR APAR Ip,a mol m−2d−1
Fraction of APAR FAPAR fa –
Leaf Area Index LAI L –
Reflectance – ρ –
Wavelength – λ µm
Vegetation Index VI V –
Enhanced VI EVI E –
Normalized Difference VI NDVI N –
compared to the GPP and ER models for both forest types, r2= 61% (dec.) and r2=75% (con.) (Figs. 11 and 12; and Tables 4 and 6). In general, it is obvious that a small dis-crepancy in the modeled GPP and ER can result in a large relative error in the final NEE. For example, the GPP model misses the growing season production peak in Hyytiälä by about 1 g m−2d−1which results in an average relative error of about 6%. Although rather small, this error, together with a very accurate estimation of ER, results in a 45% average relative error in final NEE for Hyytiälä. As a consequence, the accuracy of the coniferous GPP and ER models, with co-efficients of determination above 90%, results in 75% of the total variation in measured NEE is being explained by the models. These are still good estimates, proving the poten-tial for operational remote sensing of boreal carbon balance. The modeled deciduous NEE is less accurate, with the car-bon uptake at Sorø 2004 being completely missed due to the inaccurate 2004 GPP estimation.
In summary, GPP was modeled with higher accuracy for the coniferous sites than for the deciduous, in spite of the higher correlations observed between the satellite parameters and all ground measured biophysical parameters (Table 3). This could be attributed to the fact that only two deciduous site were used for parameterization and evaluation, with none of the sites being very variable from year to year. For the coniferous data, two sites were used for parameterizing, sites that have a higher interannual variation, especially Norunda where, as mentioned, the higher variability may be attributed to soil disturbance caused by past drainage. Accordingly, the availability of measured biophysical data – GPP, ER, and in particular, NEE – is of utmost importance: the more data that is available, both in time and space, the more reliable es-timates can be obtained. For this study, it would be desirable
to use more data in general, especially from other deciduous sites in Scandinavia, such as oak and birch. The latter species is abundant in forests in Northern Scandinavia.
Finally, annual modeled NEE, obtained by the averaging of the monthly estimates over the years, was compared to averaged measured NEE. The result is seen in Fig. 13. The points for the coniferous data are clearly dispersed along the one-to-one line (r2=79%), while the deciduous points devi-ate from the line. One explanation for the very low accuracy of the deciduous annual estimates compared to the monthly, is that the interannual NEE behavior is quite similar from year to to year with small changes even between Hainich and Sorø. Again, the lack of deciduous data makes it hard to draw further conclusions on the annual NEE estimates. The conif-erous sites exhibit more variation which in combination with a more accurate monthly modeling results in a high annual accuracy.
4 Conclusions
The results of this study illustrate that remote sensing can be used for assessing the carbon uptake of forested areas in Northern Europe. Capturing the spatially varying respira-tion rates can not be done using only remotely sensed data, mainly because the processes controlling the soil respiration are not visible from space. It is concluded that additional in-formation (such as the annual respiration base rate) is needed for obtaining the ecosystem respiration, and in turn, the full carbon balance.
Linear relationships between parameters that can be made available from satellite (VIs, APAR, and AT) and measured biophysical parameters (NEE, max. NEE, GPP and ER) were found for both coniferous and deciduous data. APAR was
highly correlated with the biophysical parameters. There were no linear relationships between NDVI and the biophys-ical parameters found at any site, mainly because of a distinct saturation in the NDVI at higher uptake levels.
Modeling monthly and annual carbon balance (ER, GPP and NEE) using a regression model driven solely by APAR and EVI (with the former being more important), and the Lloyd-Taylor equation with AT and annual R10 as input,
was proven successful, especially for the boreal coniferous stands. The deciduous modeling was less successful and suf-fered from a lack of data. In order to make the presented method fully operational, large scale retrieval of R10 must
be accomplished. The presented method relies on measured biophysical data for both model parameterization and eval-uation, and hence, the amount of measured biophysical data available is crucial.
Acknowledgements. The data acquired from the flux towers is
part of the CARBOEUROPE project (GOCE-CT2003-505572), with data from Hainich, Sorø and Hyytiälä obtained from the CarboEurope-IP Ecosystem Component Database. The Terra/MODIS data used in this study were provided by Earth Observing System Data and Information System (EOSDIS), Distributed Active Archive Center at Goddard Space Flight Center which archives, manages and distributes the data. NDVI for Hyytiälä and Hainich were acquired from The Oak Ridge National Laboratory Distributed Active Archive Center (ORNL DAAC). L. Klemedtsson’s part of this paper was done within Tellus (The Centre of Earth Systems Science at the University of Gothenburg). Edited by: J. Kesselmeier
References
Baldocchi, D. D.: Assessing the eddy covariance technique for eval-uating the carbon dioxide exchange rates of ecosytems: past, present and future, Global Change Biol., 9, 479–492, 2003. Berggren, D., Bergkvist, B., Johansson, M. B., Langvall, O.,
Ma-jdi, H., Melkerud, P. A., Nilsson, A., Weslien, P., and Olsson, M.: A Description of LUSTRAs Common Field Sites. No 87, Reports in Forest Ecology and Forest Soils, Swedish University of Agricultural Sciences, 2004.
CARBOEUROPE: Concerted action: Synthesis of the European Greenhouse Gas Budget, CARBOEUROPE – GHG, Description of Work, 2005.
Chen, J. M., Pavlic, G., L., B., Cihlar, J., Leblanc, S. G., White, H. P., Hall, R. J., Peddle, D. R., King, D. J., and Trofy-mow, J. A.: Derivation and validation of Canada-wide coarse-resolution leaf area index maps using high-coarse-resolution satellite imagery and ground measurements, Remote Sens. Environ., 80, 165–184, 2002.
Chiesi, M., Maselli, F., Bindi, M., Fibbi, L., Cherubini, P., Arlotta, E., Tirone, G., Matteucci, G., and Seufert, G.: Modelling carbon budget of Mediterranean forests using ground and remote sens-ing measurements, Agric. For. Meteorol., 135, 22–34, 2005.
Churkina, G., Schimel, D. S., Braswell, B. H., and Xiao, X.: Spa-tial analysis of growing season length control over net ecosystem exchange, Global Change Biol., 11, 1777–1787, 2005.
Davidson, E. A. and Janssens, I. A.: Temperature sensitivity of soil carbon decomposition and feedbacks to climate change, Nature, 440, 165–173, doi:10.1038/nature04514, 2006.
Eklundh, L., Harrie, L., and Kuusk, A.: Investigating relationships between Landsat ETM+ sensor data and leaf area index in a bo-real conifer forest, Remote Sens. Environ., 78, 239–251, 2001. Falge, E., Baldocchi, D., Tenhunen, J., Aubinet, M., Bakwin, P.,
Berbigier, P., Bernhofer, C., Burba, G., Clement, R., Davis, J. D., Elbers, J. A., Goldstein, A. H., Grelle, A., Granier, A. Gud-mundsson, J., Hollinger, D., Kowalski, A. S., Katul, G., Law, B. E., Malhi, Y., Meyers, T., Monson, R. K., Munger, J. W., Oechel, W., Paw, U., Pilegaard, K., Rannik, U., Rebmann, C., Suyker, A., Valentini, R., and Wofsy, S.: Phase and amplitude of ecosystem carbon release and uptake potentials as derived from FLUXNET measurements, Agric. For. Meteorol., 113, 75–95, 2002.
Fensholt, R., Sandholt, I., and Stisen, S.: Evaluating MODIS, MERIS, and VEGETATION Vegetation Indices Using In Situ Measurements in a Semiarid Environment, IEEE Trans. Geosci. Remote Sens., 44, 1774–1786, 2006.
Huete, A., Didan, K., Miura, T., Rodriguez, E. P., Gao, X., and Fer-reira, L. G.: Overview of the radiometric and biophysical perfor-mance of the MODIS vegetation indices, Remote Sens. Environ., 83, 195–213, 2002.
Huete, A. R., Liu, H. Q., Batchily, K., and van Leeuwen, W.: A comparison of vegetation indices over a global set of TM images for EOS-MODIS, Remote Sens. Environ., 59, 440–451, 1997. Hunt, E. R., Kelly, R. D., Smith, W. K., Fahnestock, J. T., Welker,
J. M., and Reiners, W. A.: Estimation of Carbon Sequestration by Combining Remote Sensing and Net Ecosystem Exchange Data for Northern Mixed-Grass Prairie and Sagebrush-Steppe Ecosys-tems , Environ. Manage., 33, 432–441, 2004.
Janssens, I. A., Lankreijer, H., Matteucci, G., Kowalski, A. S., Buchmann, N., Epron, D., Pilegaard, K., Kutsch, W., Long-doz, B., Grünwald, T., Montagnani, L., Dore, S., Rebmann, C., Moors, E. J., Grelle, A., Rannik, U., Morgenstern, K., Oltchev, S., Clement, R., Gudmundsson, J., Minerbi, S., Berbigier, P., Ibrom, A., Moncrieff, J., Aubinet, M., Bernhofer, C., Jensen, N. O., Vesala, T., Granier, A., Schulze, E. D., Lindroth, A., Dol-man, A. J., Jarvis, P. G., Ceulemans, R., and Valentini, R. Produc-tivity overshadows temperature in determining soil and ecosys-tem respiration across European forests, Global Change Biol., 7, 269–278, 2001.
Jönsson, P. and Eklundh, L.: Seasonality extraction by function fit-ting to time-series of satellite sensor data, IEEE Trans. Geosci. Remote Sens., 40, 1824–1832, 2002.
Jönsson, P. and Eklundh, L.: TIMESAT – a program for analyzing time-series of satellite sensor data, Computers and Geosciences 30, 833–845, 2004.
Keeling, R. F., Piper, S. C., and Heimann, M.: Global and hemi-spheric CO2 sinks deduced from changes in atmohemi-spheric O2
con-centration, Nature 381, 218–221, 1996.
Knohl, A., Schulze, E. D., Kolle, O., and Buchmann, N.: Large carbon uptake by an unmanaged 250-year-old deciduous forest in Central Germany, Global Change Biol., 118, 151–167, 2003. Knohl, A., Soe, A. R. B, Kutsch, W. L., Godecke, M., and
Buch-mann, N.: Representative estimates of soil and ecosystem respi-ration in an old beech forest, Plant and Soil, 302, 189–202, 2007. Kolari, P., Pumpanen, J., Rannik, U., Ilvesniemi, H., Hari, P., and Berninger, F.: Carbon balance of different aged Scots pine forests in Southern Finland, Global Change Biol., 10, 1106–1119, 2004. Kumar, M. and Monteith, J. L.: Plants and the daylight spectrum. Academic Press, London, Ch. Remote Sensing of crop growth, 133–144, 1981.
Lagergren, F., Eklundh, L., Grelle, A., Lundblad, M., Mölder, M., Lankreijer, H., and Lindroth, A.: Net primary production and light use efficiency in a mixed coniferous forest in Sweden, Plant Cell Environ., 28, 412–423, 2005.
Lagergren, F., Grelle, A., Lankreijer, H., Mölder, M., and Lindroth, A. Current Carbon Balance of the Forested Area in Sweden and its Sensitivity to Global Change as Simulated by Biome-BGC, Ecosystems, 9, 894–908, 2006.
Law, B. E., Thornton, P. E., Irvine, J., Anthoni, P. M., and Van Tuyl, S.: Carbon storage and fluxes in ponderosa pine forests at dif-ferent developmental stages, Global Change Biol., 7, 755–777, 2001.
Liang, S., Zheng, T., Liu, R., Fang, H., Tsay, S. C., and Run-ning, S.: Estimation of incident photosynthetically active radia-tion from moderate resoluradia-tion imaging spectrometer data, J. Geo-phys. Res., 111, d15208, doi:10. 1029/2005JD006730, 2006. Lindroth, A., Grelle, A., and Moren, A. S.: Long-Term
Measure-ments of Boreal Forest Carbon Balance Reveal Large Tempera-ture Sensitivity, Global Change Biol., 4, 443–450, 1998. Liu, H. Q. and Huete, A. R.: A feedback based modifiction of the
NDVI to minimize canopy background and atmospheric noise, IEEE Trans. Geosci. Remote Sens., 33, 457–465, 1995. Liu, J., Chen, J. M., Cihlar, J., and Park, W. M.: A Process-Based
Boreal Ecosystem Productivity Simulator Using Remote Sensing Inputs, Remote Sens. Environ., 62, 158–175, 1997.
Lloyd, J. and Taylor, J. A.: Temperature and soil respiration, Func. Ecol. 8, 315–323, 1994.
Lobell, D. B., Hicke, J. A., Asner, G. P. Field, C. B., and Los, S. O.: Satellite estimates of productivity and light use efficiency in United States agriculture, 1982–1998, Global Change Biol., 8, 722–735, 2002.
Lundin, L. C., Halldin, S., Lindroth, A., Cienciala, E., Grelle, A., Hjelm, P., Kellner, E., Lundberg, A., Mölder, M., and Moren, A. S.: Continuous long-term measurements of soil-plant-atmosphere variables at a forest site, Agric. For. Meteorol., 99, 53–73, 1999.
Monteith, J. L.: Solar radiation and productivity in tropical ecosys-tems, J. Appl. Ecology, 9, 747–766, 1972.
Monteith, J. L.: Climate and the efficiency of crop production in Britain, Philos. Trans. R. Soc., London B, 281, 277–294, 1977. Myneni, R. B., Hoffman, S., Knyazikhin, Y., Privette, J. L., Glassy,
J., Tian, Y., Wang, Y., Song, X., Zhang, Y., and Smith, G. R.: Global products of vegetation leaf area and fraction absorbed PAR from year one of MODIS data, Remote Sens. Environ., 83, 214–231, 2002.
Nichol, C. J., Huemmrich, K. F., Black, T. A., Jarvis, P. G., Walthall, C. L., Grace, J., and Hall, F. G.: Remote sensing of photosynthetic-light-use efficiency of boreal forest, Agric. For. Meteorol., 101, 131–142, 2000.
Oechel, W. C., Vourlitis, G. L., Verfaille, J. J., Crawford, T., Brooks, S., Dumas, E., Hope, A., Stow, D., Boynton, B., Nosov, V., and
Zulueta, R.: A scaling approach for quantifying the net CO2 flux of the Kuparuk River Basin, Alaska, Global Change Biol., 6, 160–173, 2000.
Olofsson, P. and Eklundh, L.: Estimation of absorbed PAR across Scandinavia from satellite measurements, Part II: modeling and evaluating the fractional absorption, Remote Sens. Environ, 110(2), 240–251, 2007.
Olofsson, P., Van Laake, P. E., and Eklundh, L.: Estimation of absorbed PAR across Scandinavia from satellite measurements, Part I: Incident PAR, Remote Sens. Environ., 110(2), 252–261, 2007.
Pilegaard, K., Hummelshøj, P., Jensen, N. O., and Chen, Z.: Two years of continuous CO2eddy-flux measurements over a Danish
beech forest, Agric. For. Meteorol., 107, 29–41, 2001.
Prince, S. D.: A model of regional primary production for use with coarse resolution satellite data, Int. J. Remote Sens., 12, 1313– 1330, 1991.
Rahman, A. F., Sims, D. A., Cordova, V. D., and El-Masri, B. Z.: Potential of MODIS EVI and surface temperature for directly estimating per-pixel ecosystem C fluxes, Geophys. Res. Lett., 32, l19404, doi:10.1029/2005GL024127, 2005.
Reichstein, M., Falge, E., Baldocchi, D., Papale, D., Aubinet, M., Berbigier, P., Bernhofer, C., Buchmann, N., Gilmanov, T., Granier, A., Grunwald, T., Havrankova, K., Ilvesniemi, H., Janous, D., Knohl, A., Laurila, T., Lohila, A., Loustau, D., Mat-teucci, G., Meyers, T., Miglietta, F., Ourcival, J. M., Pumpanen, J., Rambal, S., Rotenberg, E., Sanz, M., Tenhunen, J., Seufert, G., Vaccari, F., Vesala, T., Yakir, D., and Valentini, R.: On the separation of net ecosystem exchange into assimilation and ecosystem respiration: review and improved algorithm, Global Change Biol., 11, 1424–1439, 2005.
Ruimy, A., Saugier, B., and Dedieu, G.: Methodology for the estimation of terrestrial net primary production from remotely sensed data, J. Geophys. Res., 99, 5263–5283, 1994.
Rummukainen, M., Bergström, S., Källen, E., Moen, L., Rodhe, J., and Tjernström, M.: Sweclim – the first three years, Tech. Rep. No 94, SMHI Reports Meteorology and Climatology, 2000. Running, S. W. and Coughlan, J. C.: A general model of forest
ecosystem processes for regional applications, I. Hydrologic bal-ance, canopy gas exchange and primary production processes, Ecol. Modell., 42, 125–154, 1998.
Running, S. W. and Hunt Jr, E. R.: Scaling Physiological Processes: Leaf to Globe. Academic Press, Inc., New York, Ch. General-ization of a forest ecosystem process model for other biomes, BIOME-BGC, and an application for global-scale models, 1993. Running, S. W., Nemani, R., Glassy, J. M., and Thornton, P. E.: MODIS Daily Photosynthesis (PSN) and Annual Net Primary Production (NPP) Product (MOD17): Algorithm Theoretical Ba-sis Document, Version 3. 0, 1999.
Running, S. W., Thornton, P. E., Nemani, R. R., and Glassy, J. M.: Methods in Ecosystem Science, Springer-Verlag, New York, Ch. Global Terrestrial Gross and Net Primary Productivity from the Earth Observing System, 2000.
Schulze, E., Wirth, C., and Heimann, M.: Climate Change: Manag-ing Forests After Kyoto, Science, 289, 2058–2059, 2000. Schulze, E. D., Valentini, R., and Sanz, M. J.: The long way from
Kyoto to Marrakesh: Implications of the Kyoto Protocol negotia-tions for global ecology, Global Change Biol., 8, 505–518, 2002. Sellers, P. J., Los, S. O., Tucker, C. J., Justice, C. O., Dazlich, D. A.,
Collatz, G. J., and Randall, D. A.: A global 1◦by 1◦NDVI data set for climatic studies, pt. 2: The adjustment of the NDVI and generation of global fields of terrestrial biophysical parameters, Int. J. Remote Sens., 15, 3519–3546, 1994.
Sims, D. A., Rahman, A. F., Cordova, V. D., El-Masri, B. Z., Bal-docchi, D. D., Flanagan, L. B., Goldstein, A. H., Hollinger, D. Y., Misson, L., Monson, R. K., Oechel, W. C., Schmid, H. P., Wofsy, S. C., and Xu, L.: On the use of MODIS EVI to assess gross pri-mary productivity of North American ecosystems, J. Geophys. Res., G04015, doi:10.1029/2006JG000162, 2006.
Tans, P. P., Fung, I. Y., and Takahashi, T.: Observational constraints on the global atmospheric carbon CO2 budget, Science, 247, 1431–1438, 1990.
Turner, D. P., Gower, S. T., Cohen, W. B., Gregory, M., and Maiersperger, T. K.: Effects of spatial variability in light use ef-ficiency on satellite-based NPP monitoring, Remote Sens. Envi-ron., 80, 397–405, 2002.
Turner, D. P., Guzy, M., Lefsky, M. A., Rits, W. D. abd Van Tuyl, S., and Law, B. E.: Monitoring Forest Carbon Sequestration with Remote Sensing and Carbon Cycle Modeling, Ecol. Modell., 33, 457–466, 2004.
Turner, D. P., Ritts, W. D., Cohen, W. B., Gower, S. T., Zhao, M., Running, S. W., Wofsy, S. C., Urbanski, S., Dunn, A. L., and Munger, J. W.: Scaling Gross Primary Production (GPP) over bo-real and deciduous forest landscapes in support of MODIS GPP product validation, Remote Sens. Environ., 88, 256–270, 2003. Turner, D. P., Ritts, W. D., Cohen, W. B., Maeirsperger, T. K.,
Gower, S. T., Kirschbaum, A., Running, S. W., Zhao, M., Wofsy, S. C., Dunn, A. L., Law, B. E., Campbell, J. C., Oechel, W. C., Kwon, H. J., Meyers, T. P., Small, E. E., Kurc, S. A., and Ga-mon, J. A.: Site-level evaluation of satellite-based global terres-trial gross primary production and net primary production moni-toring, Global Change Biol., 11, 666–684, 2005.
Valentini, R., Matteucci, G., Dolman, A. J., Schulze, E. D., Reb-mann, C., Moors, E. J., Granier, A., Gross, P., Jensen, N. O., Pilegaard, K., Lindroth, A., Grelle, A., Bernhofer, C., Grünwald, T., Aubinet, M., Ceulemans, R., Kowalski, A. S., Vesala, T., Ran-nik, ., Berbigier, P., Loustau, D., Guðmundsson, J., Thorgeirsson, H., Ibrom, A., Morgenstern, K., Clement, R., Moncrieff, J., Mon-tagnani, L., Minerbi, S., and Jarvis, P. G.: Respiration as the main determinant of carbon balance in European forests, Nature, 404, 861–865, 2000.
Van Laake, P. E. and Sanchez-Azofeifa, G. A.: Simplified atmo-spheric radiative transfer modelling for estimating incident PAR using MODIS atmosphere products, Remote Sens. Environ., 91, 98–113, 2004.
Van Laake, P. E. and Sanchez-Azofeifa, G. A.: Mapping PAR using MODIS atmosphere products, Remote Sens. Environ., 94, 554– 563, 2005.
Veroustraete, F., Patyn, J., and Myneni, R. B.: Estimating Net Ecosystem Exchange of Carbon Using the Normalized Differ-ence Vegetation Index and an Ecosystem Model, Remote Sens. Environ., 58, 115–130, 1996.
Vourlitis, G. L., Harazono, Y., Oechel, W. C., Yoshimoto, M., and Mano, M.: Spatial and temporal variations in landscape-scale net CO2exchange, respiration, and gross primary production in
arctic tundra ecosystems, Func. Ecol., 14, 203–214, 2000. Vourlitis, G. L., Verfaillie, J., Oechel, W. C., Hope, A., Stow, D.,
and Engstrom, R.: Spatial variation in regional CO2exchange
for the Kuparuk River Basin, Alaska over the summer growing season, Global Change Biol., 9, 930–941, 2003.
Wan, Z. and Li, Z.: A Physics-Based Algorithm for Retrieving Land-Surface Emissivity and Temperature from EOS/MODIS Data, IEEE Trans. Geosci. Remote Sens., 35, 980–996, 1997. Wan, Z., Zhang, Y., Zhang, Q., and Li, Z.: Quality assessment and
validation of the MODIS global land surface temperature, Int. J. Remote Sens., 25, 261–274, 2004.
Xiao, X., Hollinger, D., Aber, J., Goltz, M., Davidson, E. A., Zhang, Q., and Moore, B.: Satellite-based modeling of gross primary production in an evergreen needleleaf forest, Remote Sens. Env-iron., 89, 519–534, 2004a.
Xiao, X., Zhang, Q., Braswell, B., Urbanski, S., Boles, S., Wofsy, S., Moore, B., and Ojima, D.: Modeling gross primary pro-duction of temperate deciduous broadleaf forest using satellite images and climate data, Remote Sens. Environ, 91, 256–270, 2004b.
![Fig. 12. Measured and modeled time series of GPP, RE and NEE for the coniferous stands [g m − 2 d − 1 ].](https://thumb-eu.123doks.com/thumbv2/123doknet/14777089.594392/11.892.78.422.99.418/fig-measured-modeled-time-series-gpp-coniferous-stands.webp)