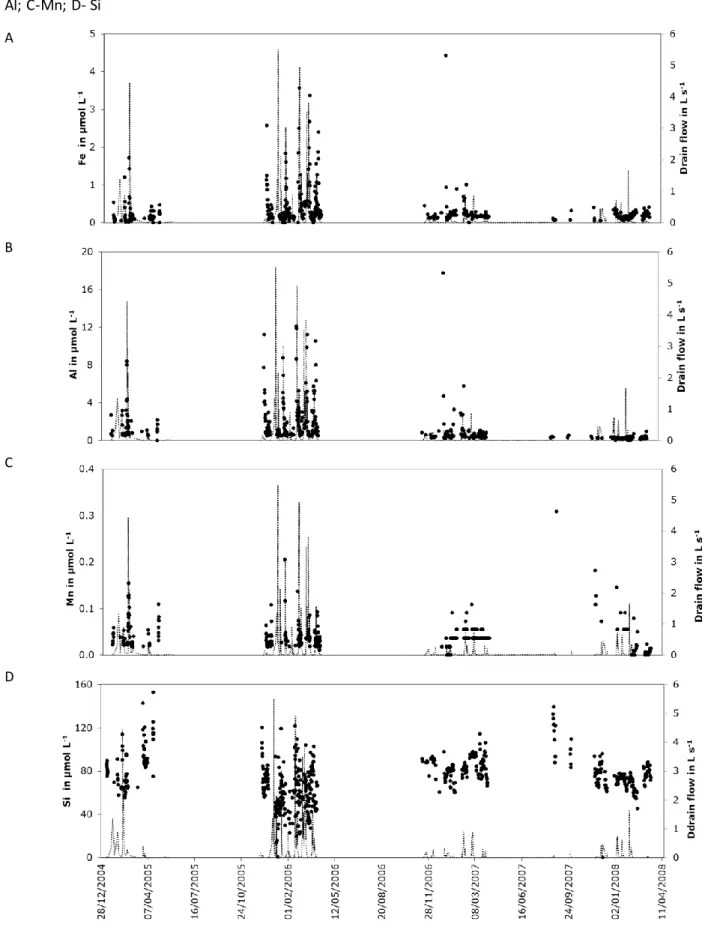
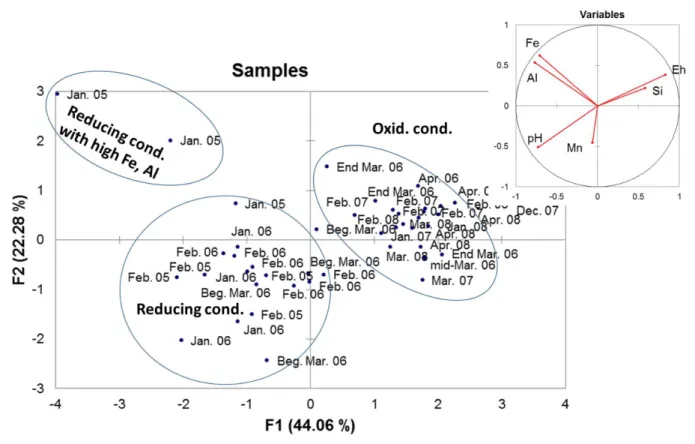
Soluble and colloidal translocation of Al, Fe, Si and Mn in an artificially drained French Retisol
Texte intégral
Figure

Documents relatifs
Une nouvelle translocation robertsonienne dans la race Prim’Holstein.. Alain Pinton, Alain Ducos, Hélène
Le projet a mis en évidence que les nanoparticules sont non seulement capables de pénétrer dans les cellules épithéliales mais aussi dans les cellules
Le projet a montré que les nanoparticules sont capables de pénétrer non seulement dans les cellules épithéliales mais aussi dans les cellules vasculaires pulmonaires. Le mécanisme
The boar carrying the translocation had only four degraded diakinetic sperm and many pachytene cells. Figure 3 shows synaptonemal complexes; the chromosome 12 and 13
The comparative analysis of GTG- and RBG-banding patterns of the translocation chromosome and its homologues has shown that the centric fusion occurred without obvious loss
is justified to expect higher fertility depression from a reciprocal translocation as compared to the usually mild effects of Robertsonian translocations in cattle.
The C banding technique revealed the presence of 2 constitutive heterochromatin blocks in the pericentromeric region of the F chromosome and only 1 block on the long
The use of immunolocalization techniques revealed some meiotic abnormalities since SC analysis demonstrated the presence of an open quadrivalent in most cells studied, but also
