HAL Id: hal-00069152
https://hal-insu.archives-ouvertes.fr/hal-00069152
Submitted on 19 May 2006HAL is a multi-disciplinary open access archive for the deposit and dissemination of sci-entific research documents, whether they are pub-lished or not. The documents may come from teaching and research institutions in France or abroad, or from public or private research centers.
L’archive ouverte pluridisciplinaire HAL, est destinée au dépôt et à la diffusion de documents scientifiques de niveau recherche, publiés ou non, émanant des établissements d’enseignement et de recherche français ou étrangers, des laboratoires publics ou privés.
Characterization of model soil colloids by cryo-scanning
electron microscopy.
M. Nègre, P . Leone, Jean Trichet, Christian Défarge, V. Boero, M. Gennari
To cite this version:
M. Nègre, P . Leone, Jean Trichet, Christian Défarge, V. Boero, et al.. Characterization of model soil colloids by cryo-scanning electron microscopy.. Geoderma, Elsevier, 2004, 121, pp.1-2, 1-16. �10.1016/j.geoderma.2003.09.011�. �hal-00069152�
Characterization of model soil colloids by
cryo-scanning electron microscopy
M. Nègre a, , P Leonea, J. Trichetb, C. Défargeb, V. Boeroa and M. Gennaric
a Settore Chimica Agraria, Dipartimento di Valorizzazione e Protezione delle Risorse
Agroforestali, Universita' di Torino, Italy
b Unité Mixte de Recherche 6113 CNRS, Institut des Sciences de la Terre d'Orléans,
Université d'Orléans, France
c Settore Scienze Agrochimiche, Dipartimento di Scienze Agronomiche, Agrochimiche e delle
Produzioni Animali, Università di Catania, Italy
Abstract
The cryo-scanning electron microscopy (cryo-SEM) consists of the SEM examination of samples whose microstructure has been fixed by plunge-freezing into a liquid with a high thermal conductivity, such as nitrogen slush. The advantage of this cryo-preparation method is that it can transform the interstitial water of the samples into ice whose crystalline domain dimensions (a few nm to a few tens of nanometers) do not exceed those of the finest details that can be observed, and thus do not modify sample morphology at the observation scale. Cryo-SEM was applied to the study of wet-state model soil colloids: a soil humic acid, a commercial smectite, a synthetic ferrihydrite and their binary and ternary associations. The cryo-SEM images have given the following information: The smectite suspension behaved as a non-oriented network, the ferrihydrite suspension was formed from particles of various shapes and dimensions, and the humic acid exhibited a sponge-like structure. The micromorphology of the ferrihydrite–humic acid association was close to that of pure ferrihydrite, while the smectite-containing associations recalled the basic network of the smectite. The comparison of the images obtained by cryo-SEM, and by conventional SEM performed on the same samples after they had been freeze-dried, points out the morphologic modifications deriving from the conventional drying process. Besides SEM investigation, the soil colloids have been characterized by X-ray diffractometry, FTIR spectroscopy, elementary analysis and surface area determination.
Author Keywords: Cryo-scanning electron microscopy; Smectite; Ferrihydrite; Humic acid; Model soil colloids
1. Introduction
Soil micromorphology is becoming more and more involved in studies on soils as porous media in relation to their physical properties (Chen, 1998). In particular, scanning electron microscopy (SEM) has been largely used to observe natural soil aggregates (Remley and Bradford, 1989; Sullivan, 1990; Robertson and Eggleton, 1991; Watanabe et al., 1992; Boer and Crosby, 1995; Jeong, 1998; Harris and Hollien, 2000 and Laird, 2001) and also applied to inorganic soil components and their associations. Malekani et al. (1996) used this technique in a study of the fractal
dimension of clay minerals. Associations of aluminium–iron species with silica particles (Taylor et al., 1990) and with clay minerals (Sakurai et al., 1990) and complexes of copper ions and iron-oxide-coated sand (Lai et al., 2000) have also been described by SEM. This technique has also been used to observe the microstructure of organic soil components and their associations with inorganic material (Tan, 1985 and Chen and Schnitzer, 1976).
However, most of the procedure of sample preparation, in particular, drying techniques, are known to alter or damage the original structure of the studied materials. Freeze-drying is considered less disruptive than air drying because minimizing the shrinkage and distortion of the sample by surface tension (Gu and Donner, 1992 and Chen, 1998), but slow cooling rates often lead to distortions of the suspension structure due to water crystallisation. Quick freezing by immersion in liquid freon followed by freeze-drying has allowed to minimize the artifacts due to water crystallization. Such technique has been applied to humic and fulvic acids and to humic–clay complexes (Chen and Schnitzer, 1976).
Cryo-SEM is a promising technique whose advantage is that it can transform the water into ice whose crystalline domain dimensions (a few nanometers to a few tens of nanometers) do not exceed those of the finest details that can be observed, and thus do not modify the morphology of the samples at the observation scale (Défarge, 1997). Such result is obtained by plunging the sample into a liquid with a high thermal conductivity, resulting in ultrarapid freezing (cryofixation). Cryo-SEM appears to be a reliable technique compared with freeze-drying (Chen, 1998) and has allowed micro-morphologic studies of microbial sediments (Défarge, 1997) and microbial soil crusts (Défarge et al., 1999). Cryo-SEM has been applied to the characterization of clay-amended sand (Heijenen et al., 1993), clay– or sand–polysaccharide associations (Chenu, 1993) and to the investigation of the role of roots and microrganisms in clay particle organization (Dorioz et al., 1993). Cryo-SEM observation of suspensions of humic substances and their associations with clay minerals have also been reported and have pointed out that application of such technique to model soil colloids could lead to a better understanding of the role of organic soil polymers in the aggregation processes of soil components (Vicente and Robert, 1981).
The scope of this work was to characterize by cryo-SEM the wet-state morphology of some soil components and their associations, in order to simulate the behaviour of naturally occurring soil colloids. In particular, the investigation has concerned a soil humic acid, a commercial smectite, a synthetic ferrihydrite and their binary and ternary associations. In order to avoid any artifact due to drying processes, the samples were rigorously prepared and conserved as suspensions. The soil components and their associations have also been characterized in dry state (after freeze-drying) by conventional SEM, surface area determination, XRD analysis and FTIR spectroscopy.
2. Materials and methods
2.1. Soil components
The humic acid was prepared from a histosol (pH 8.2, organic carbon: 3.5%, clay: 5.7%) according to the IHSS procedure (Swift, 1996), including 0.5 N NaOH extraction, precipitation at pH 1 with 6 N HCl, washing with 0.1 N HCl–0.3 N HF (50:50, v/v ) then water and dialysis against water (MWCO 6000–8000 Da). The amount of acidic groups determined with the procedures reported by Swift (1996) were as follows: carboxylic groups: 3.82 meq g−1; phenolic groups: 7.19 meq g−1; total acidity: 11.01 meq g−1. The elementary composition was: C 49.6%, H 4.6%, N 4.3%, S 0.5%, O 41.0%.
The ferrihydrite was prepared by adding 6N NaOH to an aqueous solution of Fe(NO3)3·9H2O (20 g in 500 ml) until it reaches pH 7. The resulting precipitate was then dialyzed against water (MWCO 10 000 Da). This method, based on that of Schwertmann and Cornell (1991), except for the use of NaOH instead of KOH, leads to a two-line ferrihydrite.
The smectite was the <2 mm fraction of a commercial Na-smectite (SWy-1) from Wyoming (Crook County, USA). In order to reproduce the conditions of preparation of the smectite-containing binary and ternary systems, a smectite suspension (10 g in 500 ml water) was shaken overnight at 25 °C, then dialyzed against water (MWCO 10 000 Da).
2.2. Preparation of the soil components associations
The preparation of the binary and ternary systems was based on the procedures reported by Celis et al., 1997; Celis et al., 1998 and Celis et al., 1999.
2.2.1. Smectite–ferrihydrite association
For the preparation of the smectite–ferrihydrite association, 10 g smectite were added to a Fe(NO3)3·9H2O solution (6 g in 500 ml). After 10 min of stirring, the pH of the suspension was brought to 7.0 with 1 N NaOH. The resulting suspension was stirred overnight at 25 °C then dialyzed against water (MWCO 10 000 Da).
2.2.2. Smectite–humic acid association
An aliquot of the humic acid suspension obtained from the above preparation procedure, corresponding to about 0.4 g humic acid, was brought to pH 10 with 1 N NaOH in order to promote its complete solubilization. After bringing back the pH to 7 with 1 N HCl, 10 g smectite was added to the solution. The resulting suspension was shaken overnight at 25 °C then dialyzed against water (MWCO 10 000 Da).
2.2.3. Ferrihydrite–humic acid association
The pH of a Fe(NO3)3·9H2O aqueous solution (20 g in 500 ml) was brought to 7.0 with 6 N NaOH. The resulting suspension was centrifuged at 20 000 rpm for 30 min.
After elimination of the supernatant, a humic acid solution at pH 7 prepared as above was added and the suspension was shaken overnight at 25 °C then dialyzed against water (MWCO 10 000 Da).
2.2.4. Smectite–ferrihydrite–humic acid association
The pH of a Fe(NO3)3·9H2O solution (6 g in 500 ml) added with 10 g smectite was brought to 7.0 with 1 N NaOH. After 10 min of stirring, the suspension was centrifugated at 8000 rpm for 10 min. After elimination of the supernatant, a humic acid solution at pH 7 prepared as above was added and the suspension was shaken overnight at 25 °C then dialyzed against water (MWCO 10 000 Da).
2.3. Storage of the samples
The samples were concentrated at 35 °C at atmospheric pressure in order to obtain a paste consistency corresponding to a concentration of the suspensions of about 6% (wt/vol) and stored under N2 atmosphere, in the dark, at 10 °C. Subsamples were freeze-dried for the analytical determinations to be performed in dry state.
2.4. Analytical methods
Cryo-scanning electron microscope (cryo-SEM) observations of the wet-state samples were performed with a Hitachi S 4200 Field Emission instrument (FESEM) equipped with a Polaron LT 7400 cryopreparation device. Cryofixation of the samples was carried out by plunge-freezing in nitrogen slush at −210 °C. Sublimation of the ice formed from the interstitial water of the sample was then obtained by progressively rising the temperature to about −80 °C. The temperature of the sample was then lowered back to about −150 °C, allowing a complete stabilization of the microstructure of the sample in a state close to its natural one. The cryo-FESEM observations were performed at 1 kV without any metal or carbon coating of the samples. Resolutions attained by FESEM are significantly higher than those of conventional SEM (Défarge, 1997 and Défarge et al., 1999).
Scanning electron microscope (SEM) images of the freeze-dried samples were obtained with a SEM Cambridge 360. The samples were previously covered with a thin Au layer.
The Fe concentration has been determined according to the method of McKeague and Day (1966). The pH has been measured in the liquid part of a water suspension of the samples (50 mg in 10 ml). The elementary composition has been determined with a LECO C–H–N analyser model 600. The surface area has been measured by N2 adsorption using a Fisons Sorptomatic 1900. X-ray diffractograms have been measured with a Philips PW 1729 diffractometer using Co Kα radiation, from 15° to 80° 2Å with 0.05 2Å step and 30 s counting time. FT–IR analysis has been carried out on KBr pellets (0.5 mg HA in 200 mg KBr) using a Perkin Elmer 2000 instrument.
3. Results and discussion
3.1. Characteristics of the studied colloids
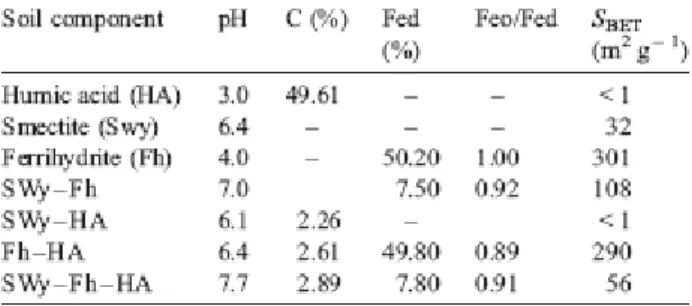
The main properties of the studied systems (determined on freeze-dried samples) are reported in Table 1. The concentrations of C and Fe in the humic acid- and ferrihydrite-containing associations were in agreement with the expected values. The Feo/Fed ratio of the iron-containing systems was close to 1, confirming the presence of amorphous and poorly ordered iron oxide.
Table 1. Characteristics of the studied colloids
3.2. Microstructure of the smectite
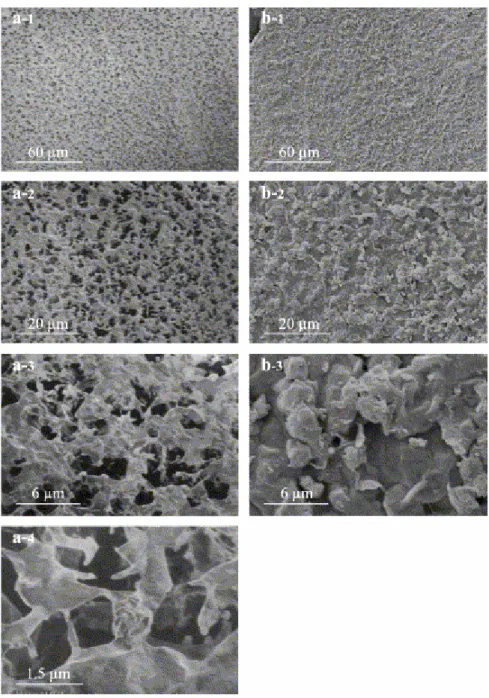
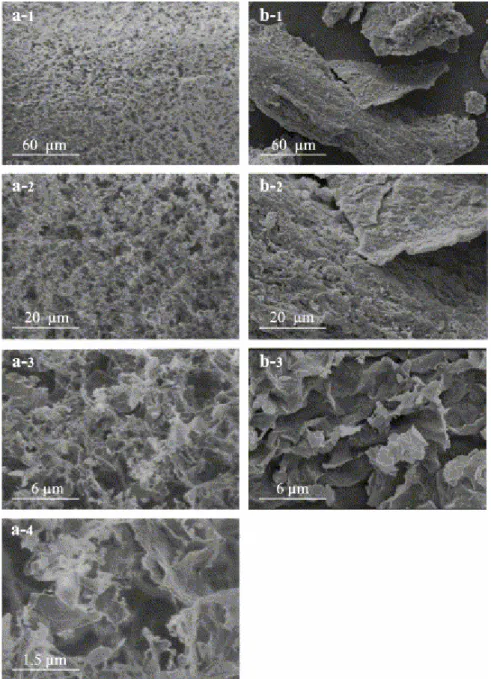
The microstructure of the smectite suspension revealed by cryo-SEM (Fig. 11 to a-4) is a tridimensional non-oriented network. The medium pore spaces are about 1–2 μm in diameter, while some larger ones seem to be the result of the breaking of the bridges between particles as can be seen at the highest magnification (Fig. 1a-4). Similar isotropic network due to the association of tactoids has been observed by quick-freezing SEM in the case of hydrated Na-montmorillonites (Metzger and Robert, 1985 and Chenu and Tessier, 1995), while Ca-montmorillonites exhibited a more oriented structure (Vicente and Robert, 1981 and Metzger and Robert, 1985). The SEM images of Na-montmorillonite fixed in molten freon reported by Chen and Schnitzer (1976) showed a more open structure probably due to the lower concentration of the suspension (1% vs. 6% in our case).
Fig. 1. Smectite. (a-1 to a-4) Cryo-SEM micrographs; (b-1 to b-3) conventional SEM micrographs of freeze-dried sample.
The conventional freeze-drying process provokes the formation a more compact organisation of flock-like aggregates (Fig. 1b-1 to b-3), probably corresponding to an edge-to-edge association of tactoids. Similar organisation, but with aggregates exhibiting lamellar and crumpled sheet aspect has been observed by SEM for the same SWy smectite (Celis et al., 1998) previously acidified and freeze-dried and for a montmorillonite coming from a natural clay deposit observed as freshly fractured surfaces (Watanabe et al., 1992).
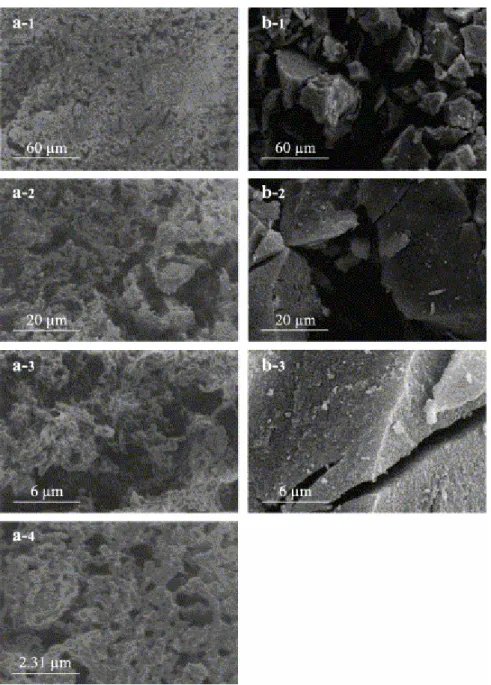
3.3. Microstructure of the ferrihydrite
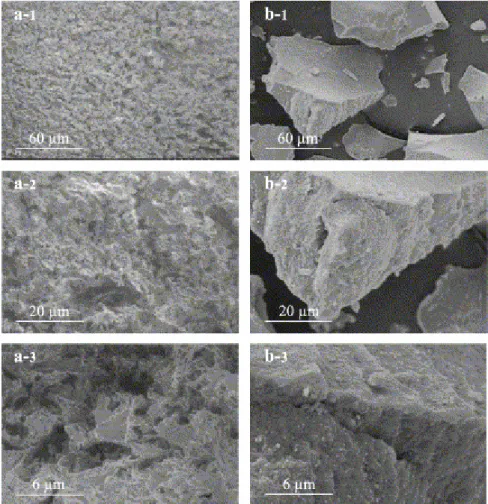
The ferrihydrite suspension (Fig. 2a-1 to a-3) behaves like a non-organized association of shapeless particles, whose dimension varies from a few micrometers to more than 20 μm. When higher tensions of SEM observation were applied, the particles tended to separate and the largest to disaggregate, indicating that they were clusters of smaller ones not strongly linked together. The fragility of the structure is likely due to the electrostatic repulsion forces due to the positive charges present on the iron oxide surface at the pH (4) of the suspension.
Fig. 2. Ferrihydrite. (a-1 to a-3) Cryo-SEM micrographs; (b-1 to b-3) conventional SEM micrographs of freeze-dried sample.
The conventional freeze-drying process leads to a random aggregation of particles of various shapes and dimensions (Fig. 2b-1 to b-3), as already observed by SEM (Leone et al., 2001). This is expected for a synthetic two-line ferrihydrite that has been seen to be heavily aggregated with single particles difficult to identify (Schwertmann and Cornell, 1991). HRTEM investigation on freeze-dried ferrihydrite has revealed that freeze-drying techniques induced artefacts disturbing elementary colloidal organization and favouring the formation of more ordered phases (Greffié et al., 2001). The surface area (301 m2 g−1; Table 1) is consistent with that commonly observed for such iron oxide and should correspond to 5–6 nm single particles packed together to form aggregates >0.1 μm across (Cornell and Schwertmann, 1996). Such aggregation is responsible for the uncertainty about the real surface
area of ferrihydrite because the internal area is not fully accessible. The comparison of the micrographs of wet-state and dry-state ferrihydrite (compare Fig. 2a and b) suggests that the surface area measured on the freeze-dried sample by N2 adsorption is lower than the wet-state area.
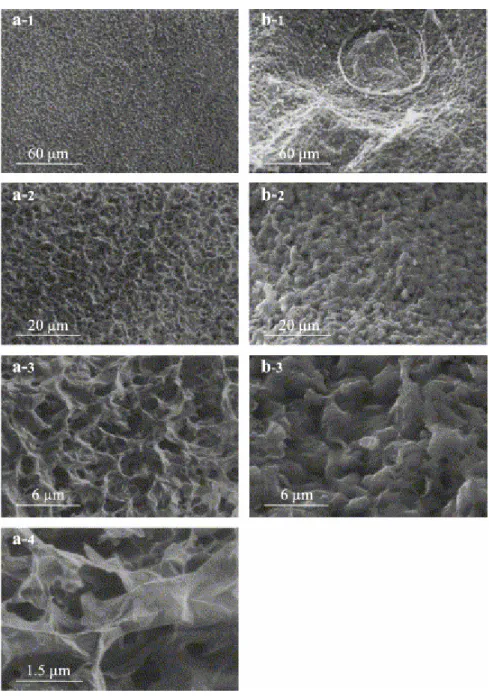
3.4. Microstructure of the humic acid
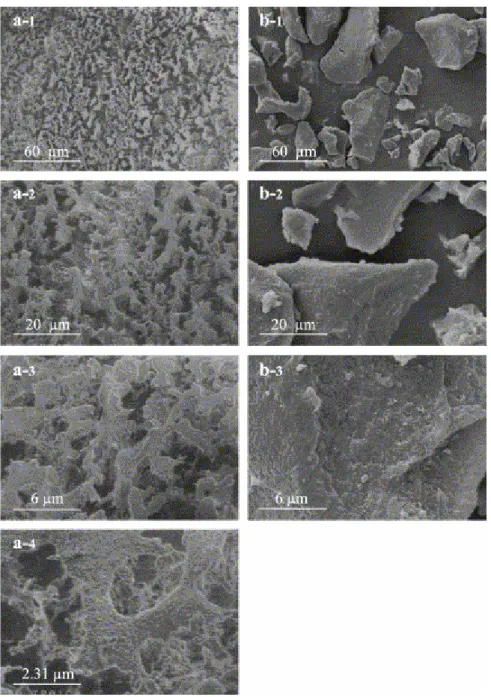
The microstructure of the humic acid suspension (Fig. 3a, a-1 to a-4) is a sponge-like network of elongated particles (about 1 μm width and 5–10 μm length) different from the structures previously reported in the literature for humic substances: Humic and fulvic acids from diluted solutions at low pH (2.3) fixed by immersion in molten freon have been seen to exhibit a fiber-like basic microstructure (Chen and Schnitzer, 1976; Vicente and Robert, 1981 and Gosh and Schnitzer, 1982), with fibers which tended to associate in bundles and in network at increasing pH (Chen and Schnitzer, 1976). Tan (1985) reported tissue-like structures in the case of diluted solution of fulvic acids (pH 3) and humic acids (pH 7) prepared by freezing in liquid N2 then evaporating under vacuum at room temperature. The fact that we observed a different microstructure than those reported in the above papers is probably due to both the physical state (concentrated suspension instead of diluted solution) and the preparation of the sample. On the other hand, SEM examination of humic acids from different soils has also pointed out that they can exhibit different morphology depending on their chemical structure (Lobartini and Tan, 1988 and Nègre et al., 2002). Since the humic macromolecules are composed of both hydrophobic (aromatic, aliphatic) and hydrophilic (carboxylic, phenolic, proteinic and polysaccharidic) moieties, the sponge-like regular organization is likely aimed to expose the more polar groups at the solid–water interface. The surrounding water has been seen through molecular modeling of humic substances in water to be bound to such groups mainly by hydrogen bonding and dipole–dipole interaction (Schulten, 1999).
Fig. 3. Humic acid. (a-1 to a-4) Cryo-SEM micrographs; (b-1 to b-3) conventional SEM micrographs of freeze-dried sample.
The regular organization completely collapses under conventional freeze-drying, provoking the formation of particles of various shapes and dimensions (Fig. 31 to b-3), as previously reported for freeze-dried humic acids (Nègre et al., 2002) and for humic acids dried over silica gel (Senesi et al., 1996). However, the SEM observation of dry preparations of humic acids previously washed with a weak solution of alkali (etching), and then by water, has clearly shown a stratal composition with deep breaks and cracks, attesting the disruption of their ordered arrangement in the course of drying (Orlov et al., 1975).
3.5. Microstructure of the smectite–ferrihydrite association
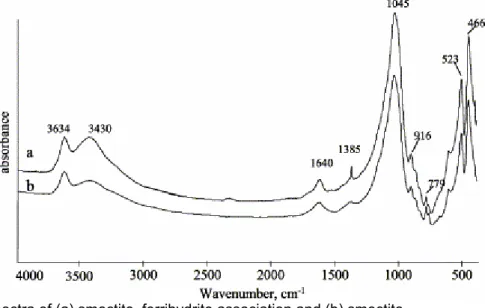
Associations of iron oxides with clay minerals, prepared at pH values lower than the PZC of the oxide, have been seen to be very stable and not affected by further pH variations (Follet, 1965; Saleh and Jones, 1984; Yong and Ohtsubo, 1987 and Otsubo et al., 1991). The coulombic attraction between the positive iron oxide surface and the negatively charged clay minerals seems to be responsible for the interaction, though the irreversibility of the binding should suggest that stronger forces are involved. A strong irreversible interaction of goethite with silica sand has also been reported (Scheidegger et al., 1993). These authors suggest that, besides electrostatic attraction, van der Waals forces and chemical bonds between the iron oxide surface and the silica surface can take place. On the basis of their results from X-ray photoelectron microscopy, they propose the formation of Fe–O–Si bond. Such a bond should be detectable by IR spectroscopy as a broad peak at 940 cm−1 corresponding to the Si–O stretching of Fe–O–Si (Schwertmann and Thalmann, 1976). However, the IR spectrum of the goethite–silica sand association did not give evidence of such rearrangement. The spectrum of the smectite–ferrihydrite association (Fig. 4a) exhibited the same absorption bands than that of pure smectite (Fig. 4b) except for the 3430 and 1640 cm−1 peaks, which are likely due to adsorbed water, and a sharp peak at 1385 cm−1 corresponding to traces of NO3− deriving from the synthesis of the iron oxide. The main peaks at lower frequencies were typical of the smectite (1045, 523 and 466 cm−1) and overlapped the main absorption of the ferrihydrite which occurred at 575 and 447 cm−1. Consequently, no evidence of a specific interaction between the smectite and ferrihydrite surfaces was given by FTIR investigation. The XRD analysis has indicated that the basal spacing of the smectite (13.9 Å) was not changed by the interaction with ferrihydrite, excluding the penetration of ferrihydrite in the smectite interlayer as already observed by Celis et al. (1998) on a similar association.
Fig. 4. FTIR spectra of (a) smectite–ferrihydrite association and (b) smectite.
The cryo-scanning electron micrographs of the smectite–ferrihydrite suspensions reported in Fig. 5a-1 to a-4 show that the network structure of the smectite is maintained, but the surface is much more indented as compared with the more smooth looking aspect of the pure smectite (Fig. 1a-1 to a-4). The dimension of the pores is reduced and the formation of new bridges seems to occur. The images of
Fig. 5a recall strongly the scanning electron micrographs of sediments obtained from a Na-montmorillonite suspension mixed with aged FeCl3 or β-FeOOH and fixed by supercritical drying (Ma and Pierre, 1999). According to Celis et al. (1998), the smectite surface of similar associations is uniformly coated with the iron oxide. The increase of the surface area of the smectite following the ferrihydrite interaction (from 32 to 108 m2 g−1; Table 1) measured on freeze-dried samples is in agreement with the results of these authors, who established that the increase of surface area is not only the result of the increase in surface roughness, but also due to the fact that the iron particles held on the negatively charged surfaces of montmorillonite make the orientation of montmorillonite quasi-crystals more difficult during sample drying.
Fig. 5. Smectite–ferrihydrite association. (a-1 to a-4) Cryo-SEM micrographs; (b-1 to b-3) conventional SEM micrographs of freeze-dried sample.
The conventional SEM observation of the freeze-dried sample (Fig. 5b-1 to b-3) indicates that, in dry state, the smectite–ferrihydrite association is organized in
aggregates of various shapes and dimensions as in the case of pure ferrihydrite (Fig. 2b-1 to b-3). However, views at the highest magnification reveal that the surface of the particles exhibits the flocky-like aspect of pure smectite (compare Fig. 1 and Fig. 5).
3.6. Microstructure of the smectite–humic acid association
The interaction between smectite and humic acid should not be promoted at the pH (7) of preparation of this system since both the smectite surface and the carboxylic groups of humic acids are negatively charged. However, clay–humic substances complexes have been seen to form also at neutral pH through different physical and chemical mechanisms depending on the nature of the clay and of the saturating cation, and on the electrolyte concentration (Kodama and Schnitzer, 1968; Rashid et al., 1972; Theng, 1976 and Varadachari et al., 1994). The probable modes of interaction in clay–humus complexes included anion and ligand exchange on the crystal edges, cation or water bridges on the basal surface, H-bonding to the siloxane or gibbsite sheet, van der Waals forces, trapping in crystal pores and intradomain regions, adsorption in interlayer spaces (Schnitzer and Kodama, 1966 and Varadachari et al., 1991). A strong organic matter adsorption by Al sites of the clays have been seen to take place even at very high pH values (Schulthess and Huang, 1991). Our preparation procedure did not include any attempt to eliminate the weakly bound humic acid, consequently, we observed by cryo-SEM a suspension in which humic acid and smectite should be associated by both strong and weak forces. According to Varadachari et al. (1994), in such suspension, water bridges must bond humic substances to the cations at the surface of the clay mineral. The cryo-SEM images (Fig. 6a-1 to a-4) indicate that the clay surface and the humic molecules are in close contact. The microstructure of the smectite–humic acid association is a network similar to that of the smectite (Fig. 1a-1 to a-4), defining pores smaller than those of pure smectite and exhibiting a more regular round form. At the final pH (6.1) of the smectite–humic acid association, a partial precipitation of the humic acid on the clay surface cannot be excluded, but it should concern only a small fraction of the added humic acid. The SEM observation of clay–fulvic acid complexes at pH 5 fixed in molten freon had revealed a more open structure with fulvic acids fibers adsorbed on the clay surface (Chen and Schnitzer, 1976). The reason for this different behaviour should be due to the clay–humic complexes preparation (fulvic instead of humic acid and a lower humic to clay ratio) and to the higher dilution of the observed suspension.
Fig. 6. Smectite–humic acid association. (a-1 to a-4) Cryo-SEM micrographs; (b-1 to b-3) conventional SEM micrographs of freeze-dried sample.
In the case of the freeze-dried sample, the coating of the clay surface by the humic molecule is indicated by the decrease of the surface area, from 32 m2 g−1 to a nonmeasurable value (Table 1), characteristic of humic substances. The XRD analysis of the freeze-dried sample has excluded the penetration of the humic acid in the smectite interlayer. No useful information has been given by FTIR spectroscopy because, at the humic acid concentration, its typical absorption peaks were too weak to be detected. The micrograph of the conventionally freeze-dried sample (Fig. 6b-1 to b-3) reveals an organization of aggregates similar to that of pure smectite (compare with Fig. 1b-1 to b-3), suggesting collapsing of the water-containing pores of the suspension. The elimination of water is known to promote complexation by bringing the interacting species closer to each other (Varadachari et al., 1994). Indeed, when these components are in close contact, weak forces, such as London and van der Waals, which are additive, can become effective according to the large
dimension of the humic molecule (Greenland, 1971). This is probably the reason why the humic acid appears as an uniform coating of the clay mineral surface on the micrographs of the freeze-dried sample. These micrographs can be compared with those obtained on the <2 μm particle size fraction of a soil dried in a dessicator (Laird, 2001) which has revealed the presence of two dimension aggregates: discrete particles (0.5–2 μm) and large aggregates (5–20 μm). Some of the discrete particles exhibited a platy morphology and were believed to be 2:1 phyllosilicates with surface coating of humic substances. A further separation of this fraction through an aggressive procedure including cycles of resuspension, dispersion and centrifugation leaded to a fine clay fraction containing 82% smectite and 51.7 g C kg−1 clay. The composition of this fraction was very similar to that of the artificial smectite–humic acid association that we prepared (smectite+22.6 g humic C kg−1). Both the natural and artificial colloids exhibited the typical morphology of clay minerals, but the humic fraction of the natural soil colloid was supposed to be concentrated in diffuse filamentous coatings observed on surfaces of the mineral particles. This is in agreement with the observation of Chen and Schnitzer (1976) indicating that fulvic acids in artificial clay–fulvic acid complexes exhibited a fiber-like morphology but in contrast with our results indicating that in our conditions of preparation, a uniform coating of the humic acid can occur on the clay surface. These contrasting results point out that further studies are needed to better understand the effect of the condition of preparation and on the composition of the organo-clays associations on their microstructure.
3.7. Microstructure of the ferrihydrite–humic acid association
At the pH (7) of preparation of this binary system, the humic acid, whose carboxylic groups are dissociated, is expected to interact strongly with the positively charged ferrihydrite surface. The interaction mechanism between soil iron oxides and humic substances has been supposed to involve ligand exchange between the carboxylate groups of the humic molecules and the Fe–OH groups of the iron oxides. Evidence of such mechanism has been given by FTIR spectroscopy on natural soil associations (Fontes et al., 1992) and on artificially prepared associations (Parfitt et al., 1977). In a previous paper dealing with a ferrihydrite–HA association prepared and characterized as in the present study, we also confirmed, by FTIR investigation, the occurrence of a ligand exchange mechanism (Leone et al., 2001). The cryo-SEM images of the suspension of the ferrihydrite–HA association (Fig. 7a-1 to a-4) show indented particles of different shapes and dimensions, recalling the original structure of the pure ferrhihydrite suspension (Fig. 2a-1 to a-4). However, the structure looks much more organized, since the particles are better defined and, in some cases, linked together. According to the above interaction mechanism, the associated humic acid, bound through its polar groups, should exhibit an hydrophobic surface likely responsible for the formation of large pore spaces.
Fig. 7. Ferrihydrite–humic acid association. (a-1 to a-4) Cryo-SEM micrographs; (b-1 to b-3) conventional SEM micrographs of freeze-dried sample.
The conventional freeze-drying of the sample provokes the formation of particles of various shapes and dimensions (from a few micrometers to up to 50 μm; Fig. 7b-1 to b-3), similar to that of pure freeze-dried ferrihydrite (Fig. 2b-1 to b-3). The decrease of the surface area (from 301 to 290 m2 g−1; Table 1) attests for the coating of the ferrihydrite surface by the humic acid. However, the residual 290 m2 g−1 indicates that the initial pores of the ferrihydrite are still accessible to the nitrogen molecule.
3.8. Microstructure of the smectite–ferrihydrite–humic acid association
The morphology of the wet-state ternary system (Fig. 8a-1 to a-4) is similar to that of the smectite–humic acid association (compare with Fig. 6a-1 to a-4) as far as the basic network and the pore spaces are concerned, though the highest magnifications
point out both the roughness typical of the iron oxide coating and the round forms typical of the humic acid coating.
Fig. 8. Smectite–ferrihydrite–humic acid association. (a-1 to a-4) Cryo-SEM micrographs; (b-1 to b-3) conventional SEM micrographs of freeze-dried sample.
The specific area of the freeze-dried sample (56 m2 g−1; Table 1) is intermediate between that of pure smectite (32 m2 g−1) and that of the smectite–ferrihydrite association (108 m2 g−1), indicating that the iron oxide pores are still reached by the N2 molecule, but that the surface is partially coated by the humic molecules. The dry-state micrographs of the ternary system (Fig. 8b-1 to b-3) are similar to those of the pure smectite (Fig. 1b-1 to b-3) and of the smectite–humic acid association (Fig. 6b-1 to b-3), recalling an edge-to-edge organization of the tactoids.
4. Conclusion
This study has confirmed that cryo-scanning electron microscopy is a useful tool to observe the behaviour of soil colloids in the presence of water, which is an essential factor determining soil structures. The comparison of the SEM images obtained in wet-state, with those of freeze-dried samples observed under conventional SEM, has confirmed that drying processes and events affect the microstructure of the samples, in particular, by promoting the formation of aggregates. This preliminary contribution of the application of cryo-SEM to soil colloids suggests that it could be an attractive approach for a best knowledge on the wet-state aggregation processes. For example, more information concerning the role of organic substances in clay minerals aggregation, in particular, the influence of the clay–organic C ratio, as well as the nature of both the clay mineral and the organic material (humic substances, polysaccharides, root exudates), on the microstructure of their mutual associations could be provided. The use of simulated soil colloids, though not completely representative of real soil constituents, but consisting in much more simple systems, should also allow to evaluate the influence of the variation of some parameters such as the pH and the composition of the soil solution on their association organisation. As far as natural soil colloids are concerned, cryo-SEM observations could also give a morphological interpretation of the particular behaviour of some natural colloids such as the high stability of the humic–allophanes and vertisolic complexes.
Acknowledgements
The authors would like to thank Annie Richard from the Centre de Microscopie Electronique de l'Université d'Orléans for her useful help in the cryo-SEM observations and the Head of the Dipartimento di Scienze Mineralogiche e Petrologiche dell'Università di Torino, Prof. Franchini-Angela, for the access to SEM equipment.
References
Boer, D.H. and Crosby, G., 1995. Evaluating the potential of SEM/EDS analysis for fingerprinting suspended sediment deriving from two contrasting topsoils. Catena 24, pp. 243–258.
Celis, R., Cornejo, J., Hermosin, M.C. and Koskinen, W.C., 1997. Sorption– desorption of atrazine and simazine by model soil colloidal components. Soil Sci.
Soc. Am. J. 61, pp. 436–443.
Celis, R., Cornejo, J. and Hermosin, M.C., 1998. Textural properties of synthetic clay–ferrihydrite associations. Clay Miner. 33, pp. 395–407.
Celis, R., Koskinen, W.C., Hermosin, M.C. and Cornejo, J., 1999. Sorption and desorption of triadimefon by soils and model soil colloids. J. Agric. Food Chem. 47, pp. 776–781.
Chen, Y., 1998. Electron microscopy of soil structure and soil components. In: Huang, P.M., Senesi, N. and Buffle, J., Editors, 1998. Structure and Surface Reaction
of Soil Particles, Wiley, Chichester, UK, pp. 158–182.
Chen, Y. and Schnitzer, M., 1976. Scanning electron microscopy of a humic acid and of a fulvic acid and its metal and clay complexes. Soil Sci. Soc. Am. J. 40, pp. 682– 686.
Chenu, C., 1993. Clay– or sand–polysaccharide associations as models for the interface between micro-organisms and soil: water related properties and microstructure. Geoderma 56, pp. 143–156.
Chenu, C. and Tessier, D., 1995. Low temperature scanning electron microscopy of a humic acid and of a fulvic acid and its metal and clay complexes. Soil Sci. Soc. Am.
J. 40, pp. 683–686.
Cornell, R.M. and Schwertmann, U., 1996. The Iron Oxides. Structure, Properties, Reactions and Uses. , VCH, Germany.
Défarge, C., 1997. Apports du cryo-microscope électronique à balayage et du microscope electronique à balayage haute résolution à l'étude des matières organiques et des relations organo-minerales naturelles. Exemple des sédiments microbiens actuels. C. R. Acad. Sci. Paris 324, pp. 553–561.
Défarge, C., Malam Issa, O. and Trichet, J., 1999. Apports du cryo-microscope électronique à balayage et du microscope electronique à balayage haute résolution à l'étude des matières organiques et des relations organo-minerales naturelles. Application aux croûtes microbiotiques des sols. C. R. Acad. Sci. Paris 328, pp. 591– 597.
Dorioz, J.M., Robert, M. and Chenu, C., 1993. The role of roots, fungi and bacteria on clay particle organization. An experimental approach. Geoderma 56, pp. 179–194. Follet, E.A.C., 1965. The retention of amorphous, colloidal "ferric hydroxide" by kaolinites. J. Soil Sci 16, pp. 334–341.
Fontes, M.R., Weed, S.B. and Bowen, L.H., 1992. Association of microcrystalline goethite and humic acid in some oxisols from Brazil. Soil Sci. Am. J. 56, pp. 982–990.
Gosh, K. and Schnitzer, M., 1982. A scanning electron microscopic study of effects of adding neutral electrolytes to solutions of humic substances. Geoderma 28, pp. 53– 56.
Greenland, D.J., 1971. Interactions between humic and fulvic acids and clays. Soil
Sci. 111, pp. 34–41.
Greffié, C., Amouric, M. and Parron, C., 2001. HRTEM study of freeze-dried and untreated synthetic ferrihydrites: consequence of sample processing. Clay Miner. 36, pp. 381–387.
Gu, B. and Donner, H.E., 1992. Electron microscopy of clay and humic acid suspension. Clay Clay Miner. 40, pp. 246–250.
Harris, W.G. and Hollien, K.A., 2000. Changes across artificial E–Bh boundaries formed under simulated fluctuating water tables. Soil Sci. Soc. Am. J. 64, pp. 967– 973.
Heijenen, C.E., Chenu, C. and Robert, M., 1993. Micro-morphological studies on clay-amended and -unamended loamy sand, relating survival of introduced bacteria and soil structure. Geoderma 56, pp. 195–207.
Jeong, G.Y., 1998. Vermicular kaolinite epitactic on primary phyllosilicates in the weathering profiles of anorthosite. Clay Clay Miner. 46, pp. 509–520.
Kodama, H. and Schnitzer, M., 1968. Effects of interlayer cations on the adsorption of a soil humic compound by montmorillonite. Soil Sci. 106, pp. 73–74.
Lai, C.H., Lo, S.L. and Chiang, H.L., 2000. Adsorption/desorption properties of copper ions on the surface of iron-coated sand using BET and EDAX analysis.
Chemosphere 41, pp. 1249–1255.
Laird, D., 2001. Nature of clay–humic complexes in an agricultural soil: II. Scanning electron microscopy analysis. Soil Sci. Soc. Am. J. 65, pp. 1419–1425.
Leone, P., Gennari, M., Nègre, M. and Boero, V., 2001. Role of ferrihydrite in adsorption of three imidazolinone herbicides. J. Agric. Food Chem. 49, pp. 1315– 1320.
Lobartini, J.C. and Tan, K.H., 1988. Differences in humic acid characteristics as determined by carbon-13 nuclear magnetic resonance, scanning electron microscopy and infrared analysis. Soil Sci. Am. J. 52, pp. 125–130.
Ma, K. and Pierre, A.C., 1999. Colloidal behaviour of montmorillonite in the presence of Fe3+ ions. Colloids Surf., A Physicochem. Eng. Asp. 155, pp. 359–372.
Malekani, K., Rice, J.A. and Lin, J.S., 1996. Comparison of techniques for determining the fractal dimension of clay minerals. Clay Clay Miner. 44, pp. 677–685.
McKeague, J.A. and Day, J.H., 1966. Dithionite- and oxalate-extractable Fe and Al as aids in differentiating various classes of soils. Can. J. Soil Sci. 46, pp. 13–22.
Metzger, L. and Robert, M., 1985. A scanning electron microscopy study of the interaction between sludge organic components and clay particles. Geoderma 35, pp. 159–167.
Nègre, M., Vindrola, D., Spera, S., Ferraris, L. and Gennari, M., 2002. Effect of the chemical composition of humic acids on their viscosity, surface pressure and morphology. Soil Sci. 167, pp. 636–651.
Orlov, D.S., Ammosova, Ya.M. and Glebova, G.I., 1975. Molecular parameters of humic acids. Geoderma 13, pp. 211–229.
Otsubo, M., Yoshimura, A., Wada, S.H. and Yong, R.N., 1991. Particle interaction and rheology of illite–iron oxide complexes. Clay Clay Miner. 39, pp. 347–354.
Parfitt, R.L., Fraser, A.R. and Farmer, V.C., 1977. Adsorption on hydrous oxides: III. Fulvic acid and humic acid on goethite, gibbsite and imogolite. J. Soil Sci 28, pp. 289–296.
Rashid, M.A., Buckley, D.E. and Robertson, K.R., 1972. Interaction of marine humic acid with clay minerals and a natural sediment. Geoderma 8, pp. 11–27.
Remley, P.A. and Bradford, J.M., 1989. Relationship of soil crust morphology to inter-rill erosion parameters. Soil Sci. Soc. Am. J. 53, pp. 1215–1221.
Robertson, I.D.M. and Eggleton, R.A., 1991. Weathering of granitic muscovite to kaolinite and halloysite and of plagioclase-derived kaolinite to halloysite. Clay Clay
Miner. 39, pp. 113–126.
Sakurai, K., Teshima, A. and Kyuma, K., 1990. Changes in zero point of charge (ZPC), specific surface area (SSA), and cation exchange capacity (CEC), of kaolinite and montmorillonite, and strongly weathered soils caused by Fe and Al coatings. Soil
Sci. Plant Nutr. 36, pp. 73–81.
Saleh, A.M. and Jones, A.A., 1984. The crystallinity and surface characteristics of synthetic ferrihydrite and its relationship to kaolinite surfaces. Clay Miner. 19, pp. 745–755.
Scheidegger, A., Borkovec, M. and Sticher, H., 1993. Coating of silica sand with goethite: preparation and analytical identification. Geoderma 58, pp. 43–65.
Schnitzer, M. and Kodama, H., 1966. Montmorillonite: effect of pH on its adsorption of a soil humic acid. Science 153, pp. 70–71.
Schulten, H.-R., 1999. Interactions of dissolved organic matter with xenobiotic compounds: modeling in water. Environ. Toxicol. Chem. 18, pp. 1643–1655.
Schulthess, C.P. and Huang, C.P., 1991. Humic and fulvic acid adsorption by silicon and aluminium oxide surfaces on clay minerals. Soil Sci. Soc. Am. J. 55, pp. 34–42. Schwertmann, U. and Cornell, R.M., 1991. Iron Oxides in the Laboratory. , VCH, Weinheim, Germany.
Schwertmann, U. and Thalmann, H., 1976. The influence of [Fe(II)], [Si], and pH on the formation of lepidocrite and ferrihydrite during oxidation of aqueous FeCl2 solution. Clay Miner. 11, pp. 189–200.
Senesi, N., Rizzi, F.R., Dellino, P. and Acquafredda, P., 1996. Fractal dimension of humic acids in aqueous suspension as a function of pH and time. Soil Sci. Soc. Am.
J. 60, pp. 1773–1780.
Sullivan, L.A., 1990. Micropiting of some clay materials adjacent structural pores.
Geoderma 46, pp. 371–376.
Swift, R.S. 1996. Organic matter characterisation. Methods of Soil Analysis. Part 3. Chemical Methods. Soil Science Society of America and American Society of Agronomy.
Tan, K.H., 1985. Scanning electron microscopy of humic matter as influenced by methods of preparation. Soil Sci. Soc. Am. J. 49, pp. 1185–1191.
Taylor, R.m., Raupach, M. and Chartres, C.J., 1990. Simulation of soil reactions: aluminium–iron (III) hydroxy species react with silica to give deposits on particle surfaces. Clay Miner. 25, pp. 375–389.
Theng, B.K.G., 1976. Interaction between montmorillonite and fulvic acid. Geoderma 15, pp. 243–251.
Varadachari, C., Monda, A.H. and Ghosh, K., 1991. Some aspects of clay–humus complexation: effect of exchangeable cations and lattice charge. Soil Sci. 151, pp. 220–227.
Varadachari, C., Monda, A.H., Nayak, D.C. and Ghosh, K., 1994. Clay–humus complexation: effect of pH and the nature of bonding. Soil Biol. Biochem. 26, pp. 1145–1149.
Vicente, M.A. and Robert, M., 1981. Role des acides fulviques et humiques dans la microagregation des particules argileuses. C. R. Acad. Sci. Paris 292, pp. 1161– 1166.
Watanabe, T., Sawada, Y., Russel, J.D., McHardy, W.J. and Wilson, M.J., 1992. The conversion of montmorillonite to interstratified halloysite–smectite by weathering in the Omi acid clay deposit, Japan. Clay Miner. 27, pp. 159–173.
Yong, R.N. and Ohtsubo, M., 1987. Interparticle action and rheology of kaolinite– amorphous iron hydroxide complexes. Appl. Clay Sci. 2, pp. 63–81.