HAL Id: hal-00750714
https://hal.archives-ouvertes.fr/hal-00750714
Submitted on 18 Jul 2020HAL is a multi-disciplinary open access
archive for the deposit and dissemination of sci-entific research documents, whether they are pub-lished or not. The documents may come from teaching and research institutions in France or abroad, or from public or private research centers.
L’archive ouverte pluridisciplinaire HAL, est destinée au dépôt et à la diffusion de documents scientifiques de niveau recherche, publiés ou non, émanant des établissements d’enseignement et de recherche français ou étrangers, des laboratoires publics ou privés.
Optical subsystems calibration and derived radiometric
instrument response of the PHEBUS spectrometer on
board of the BepiColombo Mission
P. Zuppella, A. J. Corso, V. Polito, Jean-François Mariscal, Nicolas Rouanet,
Jean-Luc Maria, P. Nicolosi, Eric Quémerais, M. G. Pelizzo
To cite this version:
P. Zuppella, A. J. Corso, V. Polito, Jean-François Mariscal, Nicolas Rouanet, et al.. Optical subsys-tems calibration and derived radiometric instrument response of the PHEBUS spectrometer on board of the BepiColombo Mission. Journal of Instrumentation, IOP Publishing, 2012, 7 (10), P10023 (14p.). �10.1088/1748-0221/7/10/P10023�. �hal-00750714�
Journal of Instrumentation
OPEN ACCESS
Optical subsystems calibration and derived
radiometric instrument response of the PHEBUS
spectrometer on board of the BepiColombo
Mission
To cite this article: P Zuppella et al 2012 JINST 7 P10023
View the article online for updates and enhancements.
Related content
Characterization of fast microchannel plate photomultipliers for the ITER core LIDAR Thomson scattering system
L Giudicotti and R Pasqualotto
-Transmission grating based imaging spectrometers in the XUV and VUV for various plasmas
D Kumar, M Parman, D Stutman et al.
-Performance of the second Deep Inelastic Neutron Scatering spectrometer at the Bariloche electron LINAC
L A Rodríguez Palomino, J J Blostein and J Dawidowski
-Recent citations
J. -F. Mariscal et al-2012 JINST 7 P10023
PUBLISHED BYIOP PUBLISHING FORSISSAMEDIALAB
RECEIVED: July 3, 2012 REVISED: September 18, 2012 ACCEPTED: October 2, 2012 PUBLISHED: October 25, 2012
Optical subsystems calibration and derived
radiometric instrument response of the PHEBUS
spectrometer on board of the BepiColombo Mission
P. Zuppella,a,1 A.J. Corso,a,b V. Polito,a,b J.F. Mariscal,c N. Rouanet,c J.L. Maria,c
P. Nicolosi,bE. Quemeraisc and M.G. Pelizzob,1 aCNR — IFN UOS Padova,
Via Trasea 7, 35131 Padova, Italy
bUniversity of Padua, Department of Information Engineering,
Via Trasea 7, 35131 Padova, Italy
cLATMOS-CNRS,
11 Boulevard d’Alembert, 78280 Guyancourt, France
E-mail:[email protected],[email protected]
ABSTRACT: Probing of Hermean By Ultraviolet Spectroscopy (PHEBUS) is a double spectrometer that will fly onboard of the BepiColombo mission. It will investigate the composition and dynamic of Mercury’s exosphere to better understand the coupled surface - exosphere - magnetosphere sys-tem of the planet. The radiometric calibration tests are ongoing and an approach based on the Mueller Matrix formalism has been adopted to determine the pure efficiency of the instrument. To our knowledge, this is the first time that a such complete method is applied to the calibration of space instrumentation.
KEYWORDS: Spectral responses; Spectrometers; Space instrumentation; Polarisation
1Corresponding authors.
c
2012 JINST 7 P10023
Contents
1 Introduction 1
2 PHEBUS optical configuration 2
3 Matrix Mueller formalism 3
4 Experimental 5
5 Results and discussions 7
6 Conclusions 9
1 Introduction
PHEBUS is a double spectrometer (Chassefiere [1]) working in the Extreme UltraViolet (EUV) and Far UltraViolet (FUV) spectral ranges that will investigate the composition and dynamic of Mercury’s exosphere onboard of the BepiColombo Mission. Its distinctive feature is to work in the EUV region (55–155 nm) allowing for the first time observations of additional species like He, Ar and N (Chassefiere [1], Yoshioka [2]). The ground calibration activities include the characteriza-tion of the optical subsystems, and the the measure of the efficiency and the geometrical acceptance in term of ´etendue at the full instrument level. The purpose of such calibrations is the development of a full radiometric model in which all the instrument parameters are taken into account. This work shows the results of the subsystems calibration, and the model that has been built to describe the response of the full instrument in term of efficiency. An exhaustive approach that takes into ac-count the polarization state of the light entering into the instrument and its polarization dependence response has been adopted and mathematically formalized in term of the Mueller Matrix theory. The purpose of the experimental measurements has been the determination of the Mueller Matrix associated to each optical component, while the Mueller Matrix associated to the full instrument has been built properly combining the results obtained at the subsystems characterization level. The proposed approach has a general validity, and allows to improve the astronomical capability when applied to a flight instrument. In the case of PHEBUS, the Mercury’s exosphere, that is still under study, is supposed to be slightly polarized, then the residual dependence to polarization must be evaluated to fully characterize the response of the instrument (Killen [3], Buenzli [4]). A radiometric calibration is properly addressed by assuming that each optical instrument induces a polarization effect on the propagating light, resulting the instrument response a very complex func-tion strongly dependent on the polarizafunc-tion status of the incoming light. In particular, it must be understood that each optical component not only affects the throughput, but introduces a phase shift in the incoming beam, whenever the incident angle is different from 0◦. This happens in a cascade
2012 JINST 7 P10023
when there is a series of optical components. In general, these dependencies are not expressed in the calibration of optical instruments, being sometimes neglected in name of ”the normal incidence configuration” usually adopted. The importance of this approach is even more dramatic if the in-strument, as in the case of PHEBUS, is provided by a scanning system which changes dynamically the mutual position of the optical elements. In the present analysis, the Mueller Matrix has been experimentally determined by characterizing the optical components for the nominal incidence an-gle, which actually is defined by following the optical path of the chief ray of the central field of view of the instrument. The full field of view and aperture and the curvature of the optical surfaces that geometrically affect the optical path of the beam resulting in the local variation of the angle of incidence of the entering rays with respect to the chief ray, must be taken into account during the radiometric simulation tool as a secondary effects.
The model that has been built allows the determination of the Mueller Matrix for any position of the scanning system, resulting therefore in a very flexible tool for the data analysis. The future experimental sessions dedicated to the full instrument efficiency measurement and the ´etendue determination will be interpreted as an experimental verification of the model proposed with for selected position of the scanning system.
The first part of the manuscript is devoted to the instrument by defining the optical design and the basic characteristics of the optics, then it moves to the description of the method, supported by a Mueller formalism recall. The theory will be fundamental to select and drive the proper mea-surements and the consequent experimental results modeling. The Mueller parameters of PHEBUS have been finally determined and critically discussed in light of PHEBUS instrument configuration and theoretical predictions.
2 PHEBUS optical configuration
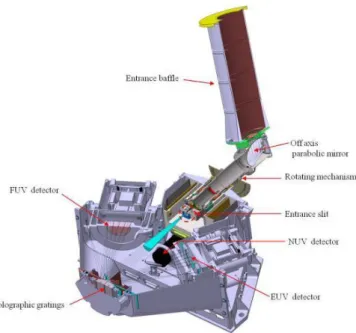
PHEBUS (see figure1) is a French led spectrometer implemented in a cooperative project involving Japan, Russia and Italy. It consists of two distinct channels working in the EUV (55-155 nm) and FUV (145-315 nm) spectral ranges with an extension for two extra visible lines at 404.7 nm and 422.8 nm (Chassefiere [1]). The paraxial field of view of the instrument is 2◦by 0.1◦. The optical scheme (see figure2) includes two drawing blocks: the collecting and the spectrometer parts.
The collector one is composed of the straylight rejection baffle, the primary mirror and the entrance slit. The mirror is a Silicon Carbide (SiC) off-axis parabola, 50◦incidence angle and 170 mm focal length. The SiC has been chosen for its efficiency performances in the whole 55 - 315 nm spectral range and for its mechanical and thermal properties. The coating has been manufactured by CVD process. The nominal surface roughness has been specified as 0.5 nm RMS in order to minimize the straylight inside the instrument. The mirror is positioned at the baffle exit and accommodated inside a scanner rotating mechanism. The main function of the scanner mechanism is to point the spectrometer’s toward the selected line-of-sight selected in order to provide the whole coverage of the Merury exosphere. The spectrometer is instead composed by two channels, the EUV and the FUV one. Two holographic gratings share the same mechanical mount and are accommodated in front of the slit. The light is then diffracted and collected by two Multi Channel Plates (MCPs) detectors. The aberration corrected holographic gratings of PHEBUS are made of aluminum covered by platinum coating. The holograph process has been adopted in order to obtain a Variable Line Space Gratings with a mean groove density of 1600 grooves/mm for the FUV
2012 JINST 7 P10023
Figure 1. PHEBUS inner view. The light incoming from the baffle impinges on the off-axis parabolic mirror and is focused on the entrance slit.
Figure 2. PHEBUS optical layout. The spectrometer consists of two distinct channels working in the EUV and FUV respectively, with a common collecting part.
and 2700 grooves/mm for the EUV one respectively. The groove profiles are laminar ion-etched optimized for the respective spectral range.
3 Matrix Mueller formalism
A block diagonal Mueller matrix is associated to each optical component at each wavelength:
Mm/g= |rTMm/g|2+|rm/g TE|2 2 |rm/gTM|2−|rm/g TE |2 2 0 0 |rTMm/g|2−|rm/g TE|2 2 |rm/gTM|2+|rm/g TE |2 2 0 0 0 0 ℜ(rTMm/g¯rTEm/g) ℑ(rm/gTM¯rm/gTE ) 0 0 −ℑ(rm/gTM¯rm/gTE ) ℜ(rm/gTM¯rm/gTE ) (3.1)
2012 JINST 7 P10023
such matrix can be easily derived by considering the gratings and the mirror as a combination of a polarizer and a phase retarder (Fundamentals of Photonics [5], Polarized Light [6]). The terms rT M/T Em/g ( ¯rT M/T Em/g are the complex conjugates) are respectively the Fresnel reflection (efficiency for the grating) coefficients of the TM and TE components of the electric fields. Since |rm/gT M/T E|2=
Rm/gT M/T E, the Mueller parameters will depend on the reflectance/efficiency of the optical components and correspondent phase shift Φm= φm
TM− φTEm. The scanning system is described by the rotation
matrix reported below:
Ms= 1 0 0 0 0 cos 2θ sin 2θ 0 0 − sin 2θ cos 2θ 0 0 0 0 1 (3.2)
where θ is the scan angle. By combining the matrices (3.1) and (3.2) the Mueller Matrix M associated to the spectrometer can be derived:
M= Mg× Ms× Mm= M00 M01 M02 M03 M10 M11 M12 M13 M20 M21 M22 M23 M30 M31 M32 M33 (3.3)
From a general point of view, the matrix M is an operator acting on the polarization state of the light described by the Stokes vectors:
S= S0 S1 S2 S3 = |ETM|2+ |ETE|2 |ETM|2− |E TE|2 2ℜ(ETEE¯TM) 2ℑ(ETEE¯TM) (3.4)
where ET M/T E are the T M/T E component of the electric field.
If we assume Sinputand Soutputare the Stokes vectors associated to the incoming light and to the beam impinging the detector (Polarized Light [6]), the relationship:
Soutput= M × Sinput
can be written. The detectors used to collect the radiation are MCPs. In general, the quantum detection efficiency ηd associated to them depends on the polarization state of the incoming light
and on the bias angle in the first stack (Tomc [7], Yoshioka [2], Yoshioka [8]). In this respect, some preliminar analysis have been done and a fully characterization will be carried on during the proper calibration activities.
Then, taking into account the efficiency of the MCP at fixed wavelenght and polarization state of the light, the detected signal is the following:
Soutput0 = ηd(M00Sinput0 + M01Sinput1 + M02Sinput2 + M03S3input) (3.5)
2012 JINST 7 P10023
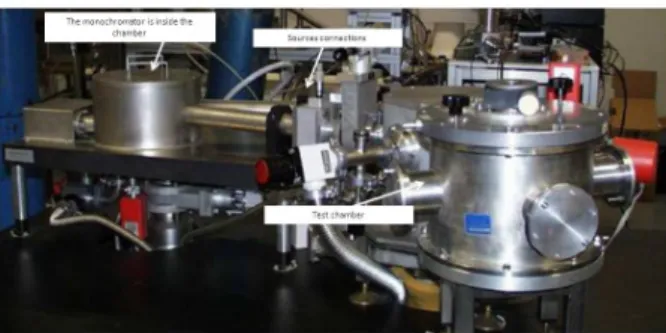
Figure 3. The normal incidence reflectometer at CNR-IFN UOS Padova. It consists of a Johnson-Onaka monochromator with a 600 grooves/mm toroidal grating optimized for the UV range.
and the relevant terms of the M Mueller matrix of the spectrometer are the coefficients of the first row: M00 = R g TM+ R g TE 2 RmTM+ RmTE 2 + RgTM− RgTE 2 RmTM− Rm TE 2 cos2θ (3.6) M01 = RgTM+ RgTE 2 RmTM− Rm TE 2 + RgTM− RgTE 2 RmTM+ Rm TE 2 cos2θ (3.7) M02 = RmTMR m TE RgTM− RgTE 2 cosΦ m sin2θ (3.8) M03 = −RmTMR m TE RgTM− RgTE 2 sinΦ m sin2θ (3.9) 4 Experimental
The experimental characterization of the PHEBUS Flight Model (FM) optical subsystems has been performed by using the normal incidence reflectometer (see figure 3) at CNR-IFN UOS Padova (Garoli [9]). It consists of a Johnson-Onaka monochromator with a 600 grooves/mm toroidal grat-ing optimized for the UV range. A toroidal mirror focuses the monochromatic radiation on the sample placed in the experimental chamber together with the detector fixed in the θ − 2θ config-uration. As sources, different lamps have been coupled with the facility: an home made hollow cathode filled with different gases, a deuterium and a Hg lamps. A Channel Electron Multiplier (CEM AMPTEK MD501) working in photon counting mode has been adopted for the EUV test, while a PhotoMultiplier (PM Hamamatsu 6352) for the FUV(see table1).
The beam probe provided by the reflectometer is polarized by the optical components of the reflectometer itself; therefore to obtain all the information necessary for a full knowledge of the PHEBUS subsystem components, the probe beam has been fully characterized with a dedicated experimental session. The method adopted is the same reported in (Garoli [9]) and the results are expressed in term of the polarization degree f =|ETE|2−|ETM|2
|ETE|2+|ETM|2 as reported in table1.
Then the measurements have been performed in two different positions of the test chamber rotated 90◦to each other giving Rm/gup and Rm/gdownrespectively:
Rm/gup/down=
Signalup/downm/g
2012 JINST 7 P10023
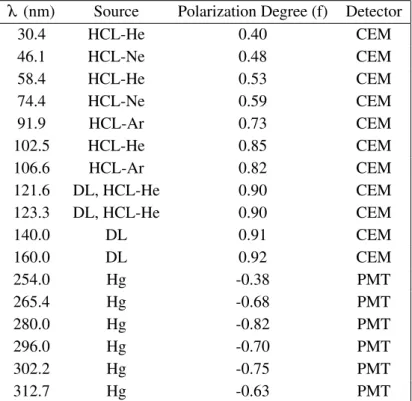
Table 1. Sources, Polarization Degree of the illumination system & Detectors. Hollow Cathode Lamp (HCL); Deuterium Lamp (DL); Mercury Lamp (Hg); Channel Electron Multiplier Ampektron MD-501 (CEM); Photomultiplier Hamamatsu 6352 (PMT).
λ (nm) Source Polarization Degree (f) Detector
30.4 HCL-He 0.40 CEM 46.1 HCL-Ne 0.48 CEM 58.4 HCL-He 0.53 CEM 74.4 HCL-Ne 0.59 CEM 91.9 HCL-Ar 0.73 CEM 102.5 HCL-He 0.85 CEM 106.6 HCL-Ar 0.82 CEM 121.6 DL, HCL-He 0.90 CEM 123.3 DL, HCL-He 0.90 CEM 140.0 DL 0.91 CEM 160.0 DL 0.92 CEM 254.0 Hg -0.38 PMT 265.4 Hg -0.68 PMT 280.0 Hg -0.82 PMT 296.0 Hg -0.70 PMT 302.2 Hg -0.75 PMT 312.7 Hg -0.63 PMT
where Signalm/gup/downand Signalup/downdirect are the reflected/refracted and the direct signal. The average of the two values corresponds to the throughput for unpolarized light Rm/gun . To determine the
relevant parameters (equations (3.6), (3.7), (3.8) and (3.9)) of the the Phebus associated Mueller Matrix, the term Rm/gT M/T E must be calculated accordingly to the following equation starting from the experimental data:
Rm/gT M/T E =R m/g up + Rm/gdown 2 ± Rm/gup − Rm/gdown 2 f (4.2)
The phase shift Φm(equation (3.5)) has been derived by a combination of experimental data, their
fitting and proper simulations. The method is resumed in the following steps: • Experimental measure of Rm/gup and Rm/gdown
• Determination of Rm/gun from Rm/gup and Rm/gdownaveraging
• Fitting of Rm/gun with a simulation software (optimization of optical constant and roughness
via IMD software in case of SiC mirror, optimization of grooves parameters via PC Grate Software demo version in case of the gratings)
• Recovering of Rm/gT M/T E curves by simulation and consequent determination of the phase shifts Φm
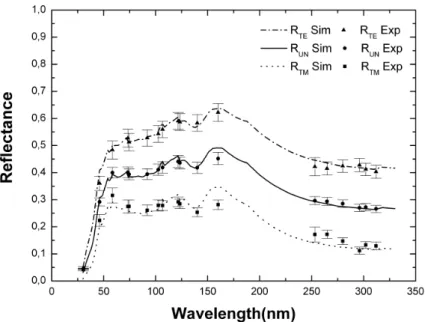
The Rm/gT M/T E results of FM optical subsystems are reported in figure4,5, and6.
2012 JINST 7 P10023
Figure 4 shows the results obtained for the SiC mirror and relative fitting. The characteri-zazion have been performed over the whole Phebus working range, since the mirror is shared by the two gratings and the two channels. In the range from 30.4 nm to 121.6 nm the fitting have been computed by using the experimental optical constants provided by D. Windt (Windt [10]) and finely adjusting the roughness surface (σ =2.1 nm) and the roughness of the substrate (σ =1 nm). As it can be seen, a very good match has been obtained by simulations with this proce-dure. In the range from 123.3 to 160 nm, experimental optical constants are available in licterature only for two wavelenghts (132 and 149 nm) and beyond 200 nm (F´ernandez-Perea [11], Larru-quert [12]), and only in case of a SiC layers deposited by sputtering or Pulsed Laser Deposition (PLD)(Monaco [13], Monaco [14]). In the FUV range, threfore, the fitting has involved also the optical constants starting from (F´ernandez-Perea [11], Larruquert [12]) below 200 nm, and (Pa-lik [15]) for longer wavelengths. The unavailability of the optical constants beyond 121.6 nm has justified the small mistmacth that still persists between simulations and value derived by experimen-tal measurements (figure5). Nevertheless, it is important to underline that for the purpose of this work the need has been finding a combination of roughnesses/optical costants that allows a good fit of the experimental data and not the determination of each specific parameter indipendently.
In the case of the EUV grating, the fittings and then the simulations have been computed with PC Grate Software demo version; the input parameters (20 nm depth, 2726 grooves/mm, land to period ratio c/d=0.45) are taken from the grating’s specifications provided by the manufacturing company Jobin Yvon. The substrate is Al, the coating is Pt with an interlayer of Cr interposed; the optical constants used are those provided with the software and are very well known in the EUV spectral range. It is worth to be noticed that the theoretical curve is perfectly compatible with the experimental data (figure5).
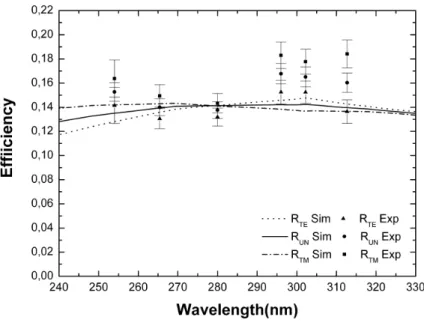
Analogous procedure has been followed for the FUV grating; 51.7 nm depth, 1603 grooves/mm and c/d=0.56 have been used as input parameters on the PC Grate Software. In this case the exper-imental data are slightly higher than the those simulated by the fitting parameters (figure6). The discrepancy can be attributed to differences between the optical constants used in the calculus and actual ones and mostly in the modelling of the groove profile.
5 Results and discussions
The Mueller parameters M00, M01, M02, and M03of PHEBUS have been experimentally determined
at different scan angles θ . In figure7 and8the coefficient values are reported for three selected cases, being θ = 0◦/90◦ and θ = 45◦ . In the case of θ = 0◦/90◦, the M02, and M03 calculated
parameters are zero, as can be deduced from equations (3.8), and (3.9), while at θ = 45◦a non zero contribution is reported in figure8; again, formula (3.8), and (3.9) tell that these are the maximum values obtainable. Nevertheless, the value of M02, and M03 in this case are still at least one order
lower than M01at each wavelength (figure8), so the equation (3.5) can be re-written according to
the following approximation:
Soutput0 ≈ ηd(M00Sinput0 + M01Sinput1 ) (5.1)
The complete response of the instrument has been therefore determined for each wavelength and each scanning angle. The results take into account the roles of the optical subsystems, which
2012 JINST 7 P10023
Figure 4. SiC entrance mirror. Experimental measurements of Rm
untogether with theoretical trend. RmT M/T E
have been obtained from the experimental measurements by knowing the polarization degree f.
Figure 5. EUV grating. Experimental data are and theoretical trend are shown in the graph. The simulation has been obtained by PC Grate Software.
affect the efficency and phase of the incidence beam; if we consider that both mirror and gratings work at an incidence angle far from the normal one, the effect is of course very pronunciated. On the contrary the model built shows that the instrument response only partially depends on the source polarization status, since Sinput2 and Sinput3 do not enter in the approximation5.1. In order to estime the relative importance of the S0inputand Sinput1 parameters, we have calculated the Soutput0 assuming
2012 JINST 7 P10023
Figure 6. FUV grating. The data obtained by the experimental measurements are shown togheter with the simulated trend.
ηd= 1 for a different set of Stokes parameters, being:
Sinput= 1 Xi 0 0
where Xivaries from 0 to 1 with a step of 0.1 (figure9); this set of Stokes vectors describes different
source status, ranging from a completely unpolarized one to a completely linearly polarized one. If the polarization factor of the source is less than 20% (i.e. S = (1, 0.2, 0, 0)T), the calculated S0output shows that can be approximated to:
Soutput0 ≈ M00Sinput0 +C (5.2)
where C is a correction factor lower than 10%. In this case, the recovering of the intensity of the input source can be obtained by knowing M00 with an error lower than 10% according to the
value reported in figure9. For higher polarization factor, the formula (5.1) contains two unknown parameters, and therefore it is not possible to derive a full knowledge of the entering source. As already recall in the introduction, this model has been built for the chief ray of the central field of view. For the complete radiometric model, it will be necessary to take into account the optical path associated to each ray entering to the system.
6 Conclusions
A method based on the Mueller Matrix formalism has been adopted to fully determine the pure ef-ficiency of PHEBUS spectrometer by using the experimental throughputs of the optical subsystems and the simulations. Right now the PHEBUS data could be understood by applying the proposed
2012 JINST 7 P10023
Figure 7. M00and M01PHEBUS parameters at θ = 0◦and θ = 90◦respectively. The empty symbols refer
to θ = 0◦, while the black ones to θ = 90◦. In both cases M00= M01= 0.
Figure 8. The Mueller parameters of PHEBUS at θ = 45◦.
approach. In fact, the Mueller parameters have been determined at different scan angles. It has also been studied the theoretical response of the instrument for different polarization status of the incoming light ranging from a completely unpolarized one to a completely linearly polarized one. If the polarization factor of the source is less than 20%, its intensity can be obtained by means of the first Mueller parameter with an error lower than 10%.
2012 JINST 7 P10023
Figure 9. Soutput0 has been calculated for different Stokes parameters describing different sources status, ranging from a completely unpolarized one to a completely linearly polarized one.
Acknowledgments
This paper is supported by the Italian Space Agency (contract ASI/INAF n.I/022/10/0) for the BepiColombo mission.
References
[1] E. Chassefiere et al., PHEBUS: A double ultraviolet spectrometer to observe Mercury’s exosphere, Planet. Space Sci.58 (2010) 201.
[2] K. Yoshioka et al., Development of the EUv detector for the BepiColombo mission,Adv. Space Res. 41 (2008) 1392.
[3] R. Killen et al., Expected emission from Mercury’s exosphere species, and their ultraviolet-visible signatures,Astrophys. J. Suppl.181 (2009) 351.
[4] E. Buenzli et al., Polarization models for Rayleigh scattering planetary atmospheres,Earth Moon Planets105 (2009) 153.
[5] B.E.A. Saleh and M.C. Teich Fundamentals of photonics, John Wiley & Sons Inc., Hoboken, U.S.A (2007).
[6] D. Goldstein, Polarized light, Marcel Deker Inc., New York U.S.A. (1993).
[7] J. Tomc et al., Variations in the polarization sensitivity of microchannel plates with photon incidence angle and wavelength in the VUV,Appl. Opt.23 (1984) 656.
[8] K. Yoshioka et al., Optical performance of PHEBUS/EUV detector onboard BepiColombo,Adv. Space Res.49 (2012) 1265.
[9] D. Garoli et al., Reflectance measurements and optical constants in the extreme ultraviolet-vacuum ultraviolet regions for SiC with a different C7Si ratio,Appl. Opt.45 (2006) 5642.
2012 JINST 7 P10023
[10] D.L. Windt et al., Optical constants for thin films of C, diamond, Al, Si, and CVD SiC from 24 ˚Ato 1216 ˚A,Appl. Opt.27 (1988) 279.
[11] M. F´ernandez-Perea et al., In situ reflectance and optical constants of ion-beam-sputtered SiC films in the58.4 to 149.2 nm region,Appl. Opt.48 (2009) 4698.
[12] J.I. Larruquert et al., Self-consistent optical constants of SiC thin films, J. Opt. Soc. Am. A 28 (2011) 2348.
[13] G. Monaco et al., Silicon carbide thin films for EUV and soft X-ray applications in the 58.4 to 149.2 nm region,Eur. Phys. J.169 (2009) 159.
[14] G. Monaco et al., Synthesis of heteroepytaxial 3C-SiC by means of PLD,Appl. Phys.A 105 (2011) 225.
[15] E.D. Palik et al., Handbook of optical constants of solids, Elsevier (1998).