HAL Id: hal-00583435
https://hal.archives-ouvertes.fr/hal-00583435
Submitted on 5 Apr 2011
HAL is a multi-disciplinary open access
archive for the deposit and dissemination of
sci-entific research documents, whether they are
pub-lished or not. The documents may come from
teaching and research institutions in France or
abroad, or from public or private research centers.
L’archive ouverte pluridisciplinaire HAL, est
destinée au dépôt et à la diffusion de documents
scientifiques de niveau recherche, publiés ou non,
émanant des établissements d’enseignement et de
recherche français ou étrangers, des laboratoires
publics ou privés.
A new radar sensor for coastal and riverbank monitoring
R. Rouveure, P. Faure, M.O. Monod
To cite this version:
R. Rouveure, P. Faure, M.O. Monod. A new radar sensor for coastal and riverbank monitoring.
OCOSS 2010 : Ocean and Coastal Observation : Sensors and observing systems, numerical models
and information Systems, Jun 2010, Brest, France. 5 p. �hal-00583435�
A New Radar Sensor for Coastal
and Riverbank Monitoring
R. Rouveure, P. Faure, M.O. Monod
Cemagref, Technologies and Information Systems Research Unit 24 avenue des Landais, BP. 50085
63172, Aubière, France
Abstract-For environmental management, remote sensing techniques are of major interest as they can provide global and local coverage of natural environments. Considering the visibility conditions that are often poor in outdoor environments (day/night cycles, clouds, shadows, fog, etc.), microwave system offers an alternative solution in order to overcome the difficulties of optical sensors. In order to deal with the need of high spatial resolution, close temporal acquisition, and low-cost data availability, we developed a small-sized microwave radar sensor called K2Pi. This radar is based on the principle of Frequency-Modulated Continuous Wave (FM-CW) technology. This radar can be easily positioned on different vehicles, including boats. An application in simultaneous localization and mapping using scan matching of radar images (R-SLAM algorithm) has been developed in order to build radar map of the environment. The potentialities of the sensor are presented through an application of riverbank mapping.
I. INTRODUCTION
Natural forces such as wind, waves, currents, rain, flood, etc. are constantly shaping the interface between the hydrosphere and the lithosphere. The monitoring of the evolutions of this interface, based on erosion and accretion processes, is of major interest in order to better understand the functioning of rivers and coastal regions [1], [2]. The development of numerical models to monitor or predict coastal and riverbank evolutions imply the availability of accurate and redundant data. But robust solutions for perception in extended outdoor environments are not so frequent, particularly with regard to the problem of resistance to the environmental conditions [3], [4]. Laser and video based systems are common optical based sensors, particularly well adapted in indoor environments. However, these systems are affected by visibility conditions that are often poor in outdoor environments: day/night cycles change illumination, weather phenomena as fog, rain or dust may deteriorate the quality of information provided. In the microwave range, data can be acquired independently of atmospheric conditions and time of the day. So radar can provide an alternative solution to overcome the shortcomings of optical sensors. Moreover, backscattering signal has an unquestionable potential for environmental applications, as it can be shown in satellite remote sensing [5].
In response to new requirements related to the monitoring of environment at lower scales in comparison to airborne radar systems, we developed a small-sized radar sensor easy to embark on board of different vehicles and we show in this
paper its potentialities through a preliminary application in riverbank mapping.
Because of its intrinsic characteristics, microwave radar is particularly well suited for outdoor applications and large scale mapping, and particularly in outdoor mobile robotics. Microwave radar has been successfully used in numerous domains such as terrain imaging [9], [7], [6], target tracking [8], three-dimensional map building [10], vehicle localization and vehicle navigation [11]. Moreover in recent years different simultaneous localization and mapping algorithms based on microwave radar sensor have been developed [12], [14], [13].
This paper is divided into the following sections. The principle and the characteristics of the K2Pi radar imager is presented in Section II. Section III develops and describes the R-SLAM algorithm which is based on a scan matching approach and the description of the environment with an occupancy grid. Results obtained on the Ayday Lake (France) are presented in Section IV.
II. PRESENTATION OF THE K2PI RADAR IMAGER
For short-range distance measurements i.e. few hundreds of meters, the classical pulse radar technology is not the best adapted solution. For example, a precision of 1 meter in distance measurement imposes a precision of 3.3 ns in time measurement, therefore fast and expensive electronics. We developed the K2Pi microwave radar (meaning 360° scanning in K band) using the frequency modulation continuous wave (FMCW) principle. This principle is known and used for several decades [15], [16]. When the range is some hundreds of meters, frequency modulation presents the following advantages:
- low transmission power, as it is the mean power which determines the range, which is safer for the user,
- transposition of the temporal variables into the frequency domain: a very short delay time ∆t is transformed into a broad variation of frequency ∆f, easier to measure.
The principle of FMCW radar consists to mix the emitted signal following a linear modulation waveform, with the received signal delayed after reflecting on the targets present within the view of the antenna [17]. Let us consider a sawtooth modulation at frequency Fm over a range ∆F and a
distribution of i stationary targets at respective distances Ri in
the antenna beam. When the echo signal is heterodyned with a
Author-produced version of OCOSS 2010, Ocean & Coastal Observation:
portion of the transmitted signal, a beat signal Sb will be produced [15], [18]: cos 2 2 i b e ri m i i R S k V V F F t c π = ∆ + Φ
∑
. (1) Ve is the amplitude of emitted signal, Vri and Φi respectivelythe amplitude of received signal and a phase term depending on target i, c the light velocity and k a mixer coefficient. When more than one target is present within the view of the radar, the mixer output will contain a sum ΣFbi of frequency
components, each of them corresponding to a particular target i:
2
bi m i
F = ∆F F R c. (2) The range Ri to each target may be determined by
measuring the individual frequency components by the mean of a Fourier transform. At each angle of sight a power spectrum is computed. Contrary to laser measurement which gives the nearest echo received in the beam, the aperture of the radar beam allows multi-targets detection in the same angle-of-sight. An example of radar power spectrum is presented in Fig. 1. We will notice that moving targets which introduce a Doppler frequency shift are not considered in this paper.
A so-called “panoramic radar image” covering 360° in the horizontal plane is carried out using a PPI (Plan Position Indicator) representation, which displays range of targets versus angle. Considering the combined effect of antenna rotation and vehicle motion (translation and rotation), one would observe intra-scan distortions on the final 360° image. To achieve a vehicle motion correction, two proprioceptive sensors are used to estimate the displacement of the vehicle and to take into account these distortions: an odometer to measure the longitudinal displacement of the vehicle and a gyrometer to measure the rotation of the vehicle.
Once the vehicle motion has been corrected, an anti-speckle filter is added. The speckle effect is a random amplitude modulation which exists in any radar image construction. Speckle noise reduction can be achieved either by spatial filtering or multi-look filtering [24], [25]. We chose the latter approach: n independent images of the scene are incoherently combined (by space-domain averaging) to produce a single
final image.
During the Aydat Lake experiment, no odometric sensor is available to estimate the displacement of the radar (odometric information are used during the Vehicle Motion Correction and the Anti-Speckle Filter steps). Data from a kinematic GPS system (with a centimetric precision) could be employed, but we try to avoid the use of such a system for different reasons: - we want to build a radar imager independent of any
localization system,
- the cost of a kinematic GPS system is very high,
- if no differential GPS correction signal is available, it is necessary to install its own GPS ground station and the cost of the GPS system is doubled,
- considering the GPS satellite constellation, the terrain topography, the presence of high vegetation or various obstacles, etc., GPS signals can be intermittently available or completely unavailable.
So a direct estimation process of the vehicle displacement was developed: it allows estimating of the movement of the vehicle within initial radar images (before vehicle motion and anti-speckle corrections).
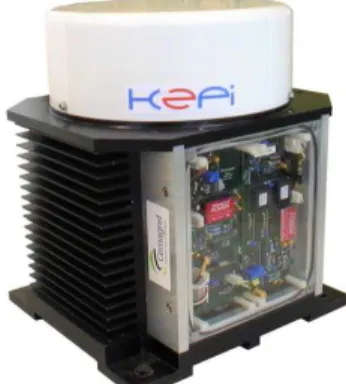
The radar is monostatic, i.e. a common antenna is used for both transmitting and receiving. The rotating antenna achieves a complete 360° scan around the vehicle in one second, and a radar acquisition is realized each degree. The sensor includes microwave components, electronic devices for emission and reception, data acquisition and signal processing units. A general view of the K2PI radar is shown in Fig. 2.
Data acquisition and signal processing units are based on a Pentium M-2 GHz PC/104 processor card. Computed data are transmitted for visualization and further treatment using an Ethernet link. Main characteristics of the radar are described in Table 1.
III. MAP CONSTRUCTION: THE R-SLAMALGORITHM
In the robotics domain, the simultaneous localization and mapping (SLAM) problem asks if it is possible for a mobile robot to be placed at an unknown location in an unknown environment and for the robot to build a consistent map of this environment, while simultaneously determining its location within this map. This problem has been intensively treated, particularly for autonomous navigation problems. In our
Figure 1. Example of radar power spectrum. The frequency peaks indicate the presence of two targets (A and B) in front of the antenna.
application, we have been interested by the SLAM methodology to build a representation of the environment, using a succession of panoramic radar images. One interest of this approach is that this construction is “sensor-based” and avoids the use of an absolute positioning system like GPS.
The majority of SLAM formulations are based on the ability of landmarks locations in the environment, assuming that these locations are time invariant. Whatever the sensor used, the most difficult problem for this approach is beacon validation and data association [19]. It means that a major difficulty is (i) to confirm that the detected beacon is a valid beacon, and (ii) to associate it with a known beacon in the computed map. The data association process is an essential problem in SLAM algorithm. It has been addressed by looking for stable beacons in the environment, or using a combination of sensors (multisensorial approach) [20].
But non-ambiguous target detection and identification based on radar signal interpretation are still open problems [21]. This is particularly true in outdoor and natural environment, where landmarks which are detected by the radar cannot be modeled as simple geometric primitives. Power/range spectra contain a large amount of information mixed with various sources of noise, so detection and tracking of particular landmarks are not simple problems [14]. The detection of landmarks in power/range spectra can be treated through constant false-alarm rate (CFAR) techniques that estimate the level of noise and the setting of a threshold [22]. But in very poor structured environment, the clutter, which is traditionally considered as noise in radar applications, must be taken into account because it can be the only available information (clutter traditionally refers to natural echoes such as ground, sea, precipitation -rain, snow or hail-, sand storms, animals -especially birds- or insects, etc). In such situations, a detection approach based on threshold selection will fail. It is for that reason we developed a particular R-SLAM algorithm which does not treat the landmarks individually, but considers the entire radar scan. A radar image is constituted by a scan over 360° around the vehicle and is considered as an occupancy grid (matrix of cells), which divides the area of interest in regular cells. Each cell is related to a small area (20 cm × 20 cm), the occupation level of which is given by the power of the reflected signal. The global grid is updated for each 360° scan, using a data merging process. The first scan is directed at 0° referring to the initial direction of the vehicle.
The absolute orientation in reference to magnetic north may be obtained by the addition of a compass.
The R-SLAM process includes two main steps:
- map matching between the current radar scan and the constructed map, in order to estimate the inter-scan displacement,
- global map updating to integrate the current radar scan through a data merging process.
A. Map Matching
Classical feature extraction and matching imply to recognize the same feature repeatedly during the map construction. Then it is necessary to detect persistent and reliable features in the scan. But because of limited angle and distance resolutions, radar scans can not offer the same resolution than optic images or laser scans. Another problem is that target's reflected power depends on the orientation of the target, so the reflected signal will be different according to the angle of observation: such a property is particularly disadvantageous in performing long-term tracking of individual landmarks.
Considering the particularities of radar data, the best adapted method here is scan-matching, which performs a 3D cross correlation (two translations and one rotation), between the current image and the constructed map. The maximum of the correlation matrix gives the estimate of the radar displacement and rotation between two scans.
B. Global Map Updating
Once the inter-scan displacement and rotation estimated, the observation from the current radar scan has to be integrated in the global radar map.
The radar data interpretation requires a representation tool that facilitates the study of sensor-scene interaction. In that sense occupancy grids are powerful and flexible representation tools that capture the relevant scene aspects for radar-data interpretation [23]. Occupancy grid represents environment by fine-grained, metric grids of variables that reflect its occupancy. Each cell of the occupancy grid contains a number that represents accumulated evidence of occupancy or emptiness in the space. In the R-SLAM process, the number contained in the cell is proportional to the microwave power of the reflected signal. This reflected power is proportional to the radar cross section (RCS) of the target. For most common types of targets such as buildings, vegetation and terrain, the radar cross section does not necessarily bear a simple relationship to the physical area, except that the larger the target size, the larger the cross section is likely to be. As the radar moves, a data merging process is applied in order to estimate the value of the cell according to the successive values of the reflected radar signal.
This data merging process faces an ambivalent situation: - the necessity to take into account the new information from
the current radar image,
- the necessity to preserve the information previously stored in the global map.
TABLE I
CHARACTERISTICS OF THE K2PIFMCWRADAR
Carrier frequency F0 24 GHz
Transmitter power Pt 20 dBm
Antenna gain G 20 dB Range 3-100 m Angular resolution (horizontal) 4° Distance resolution 1m Distance precision 0.02 m Size (length-width-height) 27-24-30 cm Weight 10 kg
The principle retained is to consider that the probability for a target to appear in the map is proportional to the number of times it has been observed at the same place.
IV. RESULTS
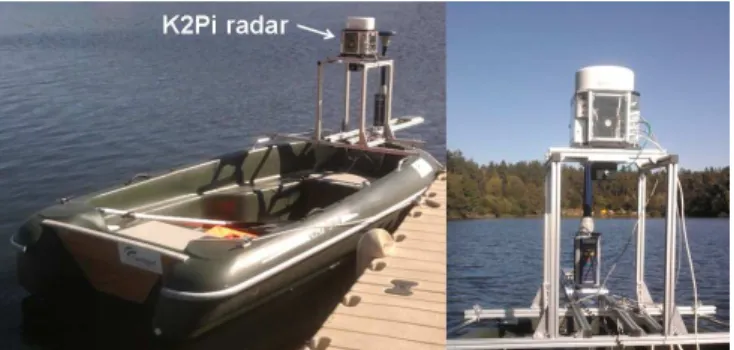
A preliminary experimentation has been done on the Aydat Lake near Clermont-Ferrand, France (latitude 45°39’51” N, longitude 2°59’09” E, elevation 840 m). The radar is positioned at the front of an experimental boat from the Cemagref Institute (see Fig. 3). The radar antenna is 1.5 m above the water surface. Radar data are acquired and stored in real time during the experiment. The R-SLAM algorithm has been implemented in Matlab language on a Quadri-Core 2.5 GHz Pentium PC with an off-line process. It takes 3 seconds to compute a radar image and to update the radar map. Simultaneously with radar data acquisitions, GPS data are recorded in order to have a localization reference.
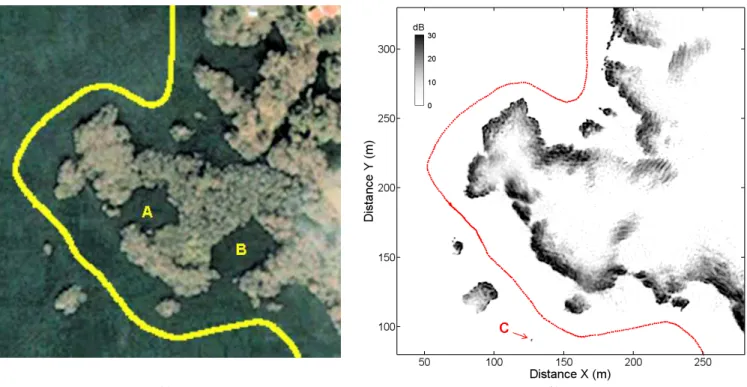
An aerial view of the lake (from Google Maps, date: April 24th, 2004) is presented in Fig. 4(a). One can observe that a part of the lake is hidden by clouds. The covered distance is about 4 km, with a mean velocity of 1.2 m/s. Yellow dots indicate the successive GPS positions. A total of 3176 panoramic radar images was stored and processed to work out the global map and trajectory (red dots) presented in Fig. 4(b). This trajectory is directly estimated with radar data, without using GPS sensor.
A detail of the experiment is also presented in Fig. 5.
V. CONCLUSION
For outdoor environment perception, microwave radar is a sensor which presents a considerable potential, overcoming the limitations of vision-based sensors. In order to construct consistent maps of the environment, the R-SLAM algorithm presented in this paper exploits all the richness of radar signal, avoiding the detection of particular landmarks. The algorithm builds simultaneously a map of the environment and a localization of the vehicle within the map, without using a global positioning system. The range of radar, combined with the R-SLAM algorithm performances, makes it possible to deal with extended and low structured environments.
REFERENCES
[1] A.L. Wilson, R.L. Dehaan, R.J. Watts, K.J. Page, K.H. Bowmer and A. Curtis, “Managing flow for geomorphic form: erosion and accretion of river benches,” Proceedings of the 5th Australian Stream Management
Conference, Australia, 2007.
[2] S. Saravanan and N. Chandrasekar, “Monthly and seasonal variation in Figure 3. General view of the K2Pi radar.
(a) (b)
Figure 4. Riverbank mapping on the Aydat Lake. (a) Aerial image from Google Maps. Yellow dots show GPS trajectory. Mark A indicates a lack of GPS information (GPS signal unavailable). A part of the trajectory (mark B) is hidden by clouds. (b) Radar cartography. The grayscale level indicates the relative amplitude of the backscattering signal. The red dots indicate the estimated boat trajectory. A total of 3176 radar images was treated to work out the map and
beach profile along the coast of Tiruchendur and Kanyakumari, Tamilnadu, India,” Journal of Iberian Geology, vol. 36(1), pp. 39-54, 2010.
[3] T. Hague, J. A. Marchant, and N. D. Tillett, “Ground based sensing systems for autonomous agricultural vehicles,” Computers and Electronics in Agriculture, vol. 25, pp. 11-28, 2000.
[4] T. Hellström, “Autonomous Navigation for Forest Machines,” Pre-Study Report, Departement of Computing Science, Umea University, Sweden, 2002.
[5] M. Hallikainen, J. Hyyppä, J. Haapanen, T. Tares, P. Ahola, J. Pulliainen and M. Toikka, “A Helicopter-Borne Eight-Channel Ranging Scatterometer for Remote Sensing: Part I: System Description,” IEEE Transactions on Geoscience and Remote Sensing, vol. 31, no. 1, pp. 161-169, 1993.
[6] G. Brooker, “A W-band airborne interrupted FMCW imaging radar,” Proceedings of the SPIE, vol. 5081, pp. 11-22, 2003.
[7] G. Brooker, S. Scheding, R. Hennessy, and M. Bishop, “Using Millimetre Wave Radar in Underground Mines,” Proceedings of the 2004 CRC Mining Research and Effective Technology Transfer Conference, Australia, 2004.
[8] G. Brooker, “Millimetre Wave Radar for Tracking and Imaging applications,” 1st International Conference on Sensing technology, New
Zealand, 2005.
[9] S. Scheding, G. Brooker, M. V.Bishop, and A. Maclean, “Terrain imaging and perception using millimetre wave radar,” Proceedings of the 2002 Australasian Conference on Robotics and Automation, Australia, 2002.
[10] A. Foessel, J. Bares, and W. Whittaker, “Three dimensional map building with mmw radar,” Proceedings of the 3rd International Conference on Field and Service Robotics, Finland, 2001.
[11] S. Clark, and H. Durran-Whyte, “The design of a high performance mmw radar system for autonomous land vehicle navigation,” Proceedings of the International Conference on Field and Service Robotics, pp 292–299, 1997.
[12] G. Dissanayake, P. Newman, H. F. Durrant-Whyte, S. Clark, and M. Csobra, “A solution to the simultaneous localisation and map building (SLAM) problem,” IEEE Transactions on Robotics and Automation, vol. 17, no 3, pp. 229-241, 2001.
[13] A. Foessel, “Radar Sensor Model for Three-Dimensional Map Building,” Proceedings SPIE, Mobile Robots XV and Telemanipulator and Telepresence Technologies VII, vol. 4195, 2000.
[14] E. Jose, and M. Adams, “Millimetre Wave RADAR Spectra Simulation and Interpretation for Outdoor SLAM,” IEEE International Conference on Robotics & Automation, New Orleans, USA, 2004.
[15] M. O. Monod, “Frequency modulated radar: a new sensor for natural environment and mobile robotics,” Ph.D. Thesis, Paris VI University, France, 1995.
[16] G. Collette, and R. Labrousse, “Un altimètre radioélectrique à modulation de fréquence,” l'Onde Electrique, vol. 37, no. 363, 1957. [17] M. I. Skolnik, “Introduction to radar systems,” In Electrical Engineering
Series, McGraw-Hill International Editions, 1980.
[18] R. Rouveure., M. O. Monod, and P. Faure, “Multiple targets detection with a FMCW radar dedicated to mobile robotics,” RADAR 2004 International Conference on Radar Systems, 3p, 2004.
[19] K. L. Ho, and P. Newman, “Detecting Loop Closure with Scene Sequences,” International Journal of Computer Vision, vol. 74, issue 3, pp. 261-286, 2007.
[20] S. Zhang, L. Xie, and Martin Adams, “An Efficient Data Association Approach to Simultaneous Localization and Map Building,” IEEE International Conference on Robotics & Automation, New Orleans, USA, 2004.
[21] Z. Chen, J. Samarabandu, and R. Rodrigo, “Recent advances in simultaneous localization and map-building using computer vision,” Advanced Robotics, vol. 21, issue 3, pp. 233-265, 2007.
[22] H. Rohling, “Radar CFAR thresholding in clutter and multiple target situations,” IEEE transactions on aerospace and electronic systems, vol. 19, no. 4, pp. 608-621, 1983.
[23] M. Martin and H. Moravec, “Robot Evidence Grids,” Technical Report CMU-RI-TR-96-06, Robotics Institute, Carnegie Mellon University, Pittsburgh, 1996.
[24] Lee, J.S., Jurkevich, I., Dawaele, P., Wambacq, P., Oosterlinck, A.: Speckle filtering of synthetic aperture radar images: A review. Remote Sensing Reviews, Vol. 8 (1994) 313-340
[25] Guoqing, L., Shunji, H., Hong, X., Torre1, A., Rubertone, F.: Study on speckle reduction in multi-look polarimetric SAR image. Journal of Electronics, Vol. 16(1) (1999).
(a) (b)
Figure 5. Detail of the experiment on the Aydat Lake. (a) Aerial image from Google Maps. Yellow dots show GPS trajectory. (b) Radar cartography. The red dots indicate the estimated boat trajectory. Marks A and B indicate zones of the lake which do not appear in the radar map because of dense vegetation. Mark C in the