The Effect of Market Transparency on
Corporate Disclosure
by
Georg Rickmann
S.M. Management Research, MIT Sloan, 2020 MSc. Finance, Warwick Business School, 2013 BSc. Business Administration, University of Göttingen, 2012
SUBMITTED TO THE SLOAN SCHOOL OF MANAGEMENT IN PARTIAL FULFILLMENT OF THE REQUIREMENTS FOR THE DEGREE OF
DOCTOR OF PHILOSOPHY IN MANAGEMENT at the
MASSACHUSETTS INSTITUTE OF TECHNOLOGY SEPTEMBER 2020
©2020 Massachusetts Institute of Technology. All rights reserved.
Signature of Author:__________________________________________________________ Department of Management
August 6, 2020 Certified by: ________________________________________________________________
Eric So Sarofim Family Career Development Associate Professor Associate Professor, Accounting Certified by: ________________________________________________________________
Rodrigo Verdi Nanyang Technological University Professor of Accounting Professor, Accounting Accepted by: _______________________________________________________________
Catherine Tucker Sloan Distinguished Professor of Management Professor, Marketing Faculty Chair, MIT Sloan PhD Program
The Effect of Market Transparency on Corporate Disclosure
by
Georg A. Rickmann
Submitted to the Sloan School of Management on August 6, 2020, in Partial Fulfillment of the Requirements for the Degree of Doctor of Philosophy in Management
Abstract:
Market prices and trading in financial markets are important information signals that reveal firm-specific information to the public. I study how the observability of such prices and trading (hereafter, “market transparency”) affects firms’ disclosure incentives. I exploit the staggered introduction of TRACE, which made bond prices and transactions publicly observable, and show that firms provide more guidance when their bonds’ prices and trading become observable. This effect is stronger for firms with informationally sensitive bonds and firms without exchange-listed bonds prior to TRACE. Also, firms become particularly more likely to disclose bad news, consistent with the notion that investors’ access to market information limits managers’ incentives to withhold information. I corroborate my results using (1) a small controlled experiment, in which prices and trading are revealed for a randomized set of bonds, and (2) threshold rules used by the regulator. Taken together, my results suggest that observable market outcomes inform investors not only directly, by aggregating and revealing investors’ information and beliefs, but also indirectly by increasing corporate disclosure.
Thesis Supervisor: Eric So
Title: Sarofim Family Career Development Associate Professor, Associate Professor of Accounting
Thesis Supervisor: Rodrigo Verdi
1 Introduction
I study how the observability of market prices and trading (hereafter “market transparency”) affects firms’ incentives to disclose information. My study is motivated by the idea that market prices and trading are important information signals. They aggregate and summarize investors’ private information and, if observable, reveal this information to the broad public (e.g., Kyle, 1985; Glosten and Milgrom, 1985). In transparent markets, in which prices and trading are broadly observable, investors can learn from market outcomes about changes in firm value, firm risk, or the probability of underlying value-relevant events (e.g., not-yet-announced M&A decisions or changes in firms’ investment strategies). Ultimately, investors have better access to firm-specific information in transparent markets, which changes how they interpret and react to managers’ disclosure decisions. How managers, in turn, alter their disclosure behavior is the focus of this paper.
Economic theory suggests that access to information alters market participants’ interpretation of both disclosures and non-disclosures, and therefore plays a key role in managers’ disclosure decisions (Verrecchia, 2001; Dye, 2001; Beyer, Cohen, Lys and Walther, 2010). However, whether increased access to market information increases or decreases managers’ incentives to disclose their information is theoretically ambiguous. On the one hand, increased access to market information can lead to increased disclosure for at least two reasons. First, observable trading and returns help investors assess whether a material event occurred, which spurs increased demand for apparently informed managers to disclose their material information.1
Second, observable price and transaction data are central inputs to securities litigation. They help investors assess investment losses, attribute these losses to particular revelations, and coordinate
1 This argument is a natural extension of models such as Dye (1985) or Jung and Kwon (1988), in which uncertainty
class action lawsuits.2 Thus, the costs of withholding or delaying information are likely higher in
transparent markets, resulting in greater disclosure of material information (Skinner, 1994, 1997). On the other hand, investors’ access to market prices/trading may reduce managers’ incentives to disclose information. For example, market data reduce information asymmetries about firm value, which can reduce investors’ demand for disclosure and the equilibrium disclosure level (e.g., Verrecchia, 1983, 1990; Diamond and Verrecchia, 1991).3 Ultimately, the
net effect of these channels is an empirical question, which I explore in this paper.
A major challenge when testing predictions about the effect of market transparency on disclosure is finding a setting that elicits exogenous variation in market transparency. I overcome this challenge by studying the introduction of the Trade Reporting and Compliance Engine (TRACE), which generates plausibly exogenous variation in bond market transparency. In essence, TRACE makes previously unobservable trading and the resulting prices observable to market participants. Corporate bonds are generally traded over the counter (OTC), and prior to TRACE, transaction information such as realized prices and volumes was largely private information exclusive to the transacting parties. TRACE fundamentally changed this exclusivity by requiring dealers to report their transactions (e.g., price, trade size, and timing), which are then disseminated to the public. Since TRACE’s full implementation, investors have almost-real-time access to more than 99% of the total activity in US corporate bonds (FINRA, 2007).
2 Also, observable market data help plaintiffs demonstrate that the firm’s bond market is sufficiently efficient to apply
the fraud-on-the-market principle. The fraud-on-the market principle lifts the requirement that plaintiffs demonstrate direct reliance on a particular disclosure or non-disclosure (because investors indirectly relied on it through prices).
3 The expression “demand for disclosure” can be confusing because there is no market for disclosure, in which
disclosure is sold for money and the price sets demand equal to supply. In many accounting theories, equilibrium is achieved in the security market, and “demand,” or “pressure,” for disclosure formalizes as a price discount investors rationally impose in the absence of disclosure (e.g., Verrecchia, 1983; Dye, 1985; Jung and Kwon, 1988, Verrecchia, 1990).
In addition to generating large-sample variation in the observability of prices and trading, the introduction of TRACE offers three main empirical advantages. First, TRACE dissemination was introduced in four main phases (in 2002, 2003, 2004, and 2005). This staggering allows me to compare firms whose bonds become observable with control firms whose bond observability does not change at that time. Also, I can restrict this comparison to public firms with public debt, reducing selection concerns stemming from differential reporting requirements or the endogenous decisions to issue bonds or to become/stay public. Second, the National Association of Securities Dealers (NASD) conducted a small randomized controlled experiment, in which prices and trading of 120 randomly selected bonds were revealed through TRACE. I use this experiment to corroborate my large-sample inferences. Finally, I also exploit the threshold rules regulators used to assign bonds to phases and how they translate to the firm level. I describe the TRACE introduction in more detail in Section 2.
Using the introduction of TRACE as an empirical setting, I test three predictions. First, I test whether and how much TRACE alters managers’ disclosure. Second, I test whether TRACE has a larger effect in situations in which the bond market outcomes contain more incremental information. Finally, I test the prediction that, to the extent managers prefer to withhold bad news, TRACE has a larger effect on bad news disclosures by reducing managers’ incentives to withhold information.
In my main analysis, I study firms’ voluntary disclosure mainly in terms of their use of guidance forecasts. Guidance forecasts reflect firms’ projections of key financial statement parameters – including earnings, sales, and capital expenditures – and are an important source of information for investors.4 My sample consists of 13,206 firm-quarters between July 2001 (one
accounting-year before the first phase introduction) and February 2006 (one accounting-year after the last phase introduction). I define a firm-quarter as having observable bond pricing/trading (i.e., as being “treated”) if the firm has a bond that has started dissemination through TRACE.
My main finding is that firms increase their disclosure in response to increased market transparency. Using difference-in-differences regressions that exploit the staggered nature of the TRACE introduction, I estimate that firms provide 0.30 more forecasts per quarter when their debt trading/prices become observable, which corresponds to a 19% increase relative to the unconditional mean of the quarterly forecast frequency. This increase in the disclosure frequency is attributable to firms forecasting (i) more topics (e.g., CapEx in addition to earnings), (ii) more horizons (e.g., multiple fiscal years), and (iii) on more dates. The absolute return reactions to the disclosures increase, suggesting that managers provide not only more disclosure but also more informative disclosure. Moreover, the increased information disclosure appears not to be limited to management forecasts: using the disclosure quality measure by Chen, Miao and Shevlin (2015), I find firms significantly improve the quality of their financial statements following the introduction of TRACE.5 Overall, these results are consistent with theory predicting that
improving investors’ access to market information limits managers’ incentives to withhold information.
To sharpen my inferences, I study the timing of the disclosure effect. I find that disclosure remains flat before the TRACE introduction, jumps as prices and trading become observable, and remains high thereafter. Because a firm’s market transparency increases discontinuously around
based information to investors.
its phase introduction date, this pattern suggests that the increase in disclosure is attributable to TRACE rather than to confounding effects.
Moreover, I examine the phase introductions separately and I estimate for each of the four introductions that firms provide increased disclosure after their prices/trading become observable through TRACE (significant for all phases but the first). This consistency further suggests that the disclosure increase is attributable to the introduction of TRACE rather than to confounding factors. My second prediction is that TRACE has a larger effect on disclosure when the revealed price and trading data likely contain more information. I find that TRACE has a substantially smaller effect on firms with exchange-listed bonds, which is intuitive because investors could observe price quotes prior to TRACE. I also find that TRACE has a larger effect on firms with high credit risk, which is also intuitive because the informational sensitivity of debt increases with the firm’s credit risk (Merton, 1974). These results are consistent with the idea that the increased disclosure is driven by the revealed information content of prices and trading.
My third prediction is that the increased disclosure more likely reflects bad news because TRACE reduces managers' incentives to withhold news. Consistent with this prediction, I find a significant increase in the forecast frequency of bad, but not good, news, where I use the announcement return to classify the content of announcements. Similarly, I also find that the average return reaction to the guidance announcements becomes more negative as firms’ prices/trading become observable.
A potential disadvantage of the staggered TRACE introduction is that firms were not randomized into treatment groups. Instead, assignment to a TRACE phase was based on bonds’ ratings and issue sizes, with earlier phases tending to contain larger and better-rated bonds (see Section 2 for a detailed description). Firms in different treatment groups thus differ in their
associated characteristics, most notably their (public) debt amounts and creditworthiness, which raises the concern that disclosures from the treated and control firms might change differently around the TRACE introduction dates due to confounding factors rather than the TRACE introduction itself.
To address these concerns about confounding effects, I corroborate my results using a small randomized controlled experiment in which NASD randomly chose 120 BBB-rated bonds and started to make their transactions available through TRACE. Using this experiment, I find corroborating evidence that firms increase their management forecast frequency in response to their debt prices/trading becoming observable, again particularly for bad news disclosure.
I also exploit that the threshold rules used to assign bonds’ treatment sometimes lead to discrepancies in the treatment of otherwise-similar firms. For example, a firm receives treatment in Phase 1 if it has one investment-grade bond with an issue size of $1.2 billion, but not if it has
two investment-grade bonds with issue sizes of $600 million each. This discrepancy in the
treatment group assignment allows me to hold constant the total issue size of a firm’s investment grade bonds, which is the firm-level equivalent of the variable used to assign bonds’ treatment. I exploit similar cutoff rules for Phases 2 and 3A. Holding explicitly constant the total issue-size-rating combination used to assign treatment to bonds, I corroborate the result that market transparency increases disclosure. The treatment effect estimates based on (i) this threshold-based analysis, (ii) the randomized experiment, and (iii) the staggered main introduction are similar in magnitude, ranging from 0.30 to 0.36 forecasts per quarter.
Finally, I examine potential channels through which TRACE spurred firms’ disclosure. I find evidence for two non-exclusive informational channels: observable market data plausibly increase disclosure by (i) increasing the litigation costs associated with withholding information
and (ii) reducing uncertainty about whether firms have material information about material events. I also test and find evidence against the alternative that disclosure increases because TRACE increases firms’ bond issuance and related public disclosure.
My article makes two contributions. First, my results help evaluate the consequences of the introduction of TRACE, an important regulatory change aimed to increase price transparency in the corporate bond market. My findings highlight externalities of market transparency and have practical implications for regulators concerned with the transparency of financial markets. Understanding the consequences of mandated market transparency is important, in part, because of increased regulatory efforts with regard to market transparency.6 My results suggest that
increased market transparency improves investors’ access to corporate information not only
directly, by revealing the information contained in prices/trading, but also indirectly by increasing
corporate disclosure. My findings are thus relevant for regulators who are concerned with investors’ access to information, and who regard both market transparency and disclosure as key drivers for long-term growth (e.g., the SEC does so).7
Second, my article extends the literature on managers’ disclosure incentives by studying how withholding incentives are mitigated by investors’ access to market prices and trading information. Prior literature already suggests that managers have incentives to withhold information (e.g., Kothari et al., 2009), and my results suggest that when investors can learn from prices and trading, managers reveal more information, and the additional disclosure tends to contain bad news.
6 The increased regulatory efforts are reflected in recent successfully implemented regulations that follow TRACE’s
example, such as the introduction of real-time public reporting for all swap transactions (e.g., credit default swaps and industry swaps) in 2012 and the introduction of MiFID II/R in Europe in 2018.
7 To quote Arthur Levitt, then Chairman of the SEC, “Transparency, disclosure and accountability aren’t just
catchwords. They are the essential ingredients to confidence. And without it, markets can neither sustain long-term growth nor adapt to a rapidly changing environment.” His speech can be found at
My article is special in that I focus on the observability of prices and trading, which reveal changes in the market’s aggregate information (the “wisdom of the crowds”). The importance of these information constructs is evidenced by their ubiquitous use to learn about different aspects of the firms (e.g., academics ubiquitously use returns in their tests to learn about different aspects or changes in firms). However, despite their importance as information constructs, evidence on the consequences of observable market prices and trading is limited, arguably due to the difficulty of observing even remotely-exogenous variation in the observability of prices/trading. My paper contributes to filling this gap by studying the impact of observable market returns and transactions on managers’ disclosure incentives.8 My study is unique in that my setting plausibly allows me to
isolate the effect of the observability of bond prices and transactions. This allows me to focus on the informational aspect of prices and trading, and also to draw plausibly causal inferences about the direction and strength of the studied effects.
Taken together, my study extends the emerging literature on how external market forces shape managers’ disclosure incentives (e.g., Sletten, 2012; Balakrishnan, Billings, Kelly and Ljungqvist, 2014; Hu, 2017; Kim, Shroff, Vyas and Wittenberg-Moerman, 2018) and also the literature relating investors’ uncertainty and management forecasts (e.g., Waymire, 1985 and Bozanic et al., 2018). Section 3.3 contains discussions of these papers.
2 Description of the TRACE Introduction
The Transaction Reporting and Compliance Engine (TRACE) was introduced between 2002 and 2005 to increase price transparency in the corporate debt market (FINRA, 2018). Before
8 To the best of my knowledge, my paper is the first to study is the first to study the impact of the observability of
market returns/trading on corporate disclosure. Conceptually, the closest paper I am aware of is Hu (2016), which studies a market-wide change in 2007 in the frequency/delay at which exchanges report open short-interest (from once per month to twice per month). See Section 3.3 for a differentiation from Hu (2016).
TRACE’s introduction, corporate bond markets were opaque with low levels of pre- and post-trade transparency. Corporate bonds are traded primarily over the counter, and prior to TRACE, transaction parties were not required to make their trading or the realized market prices public. Realized market outcomes were generally private information of the transaction parties and not broadly shared. Pre-trade quotations were available only to market professionals, most often by telephone (Bessembinder and Maxwell, 2008). In addition, institutions could consult a vendor providing estimated prices (so-called “matrix prices”) (Asquith, Covert and Pathak, 2013). To quote Arthur Levitt, then Chairman of the SEC, “the sad truth is that investors in the corporate bond market do not enjoy the same access to information as a car buyer or a homebuyer or, dare I say, a fruit buyer.”9
The introduction of TRACE substantially increased transparency in the corporate bond market. For each transaction in TRACE-eligible securities, dealers are required to report to TRACE the bond identifier, date and time of the transaction, the trade size, trade price and yield, and whether the dealer bought or sold the bond.10,11 TRACE then releases to the public the price
and yield, the trade size, and the date and time of execution.12 After full implementation, investors
could access information on 100% of OTC activity, which represents more than 99% of the total activity in US corporate bonds (FINRA, 2007). Investors could access the data free of charge on the NASD website or through third-party vendors, such as Bloomberg, Reuters, or MarketAxess. According to a Wall Street Journal Article, TRACE was seen as “a major step forward in the
9 His speech can be found at https://www.sec.gov/news/speech/speecharchive/1998/spch218.htm.
10 A “TRACE-eligible security” is a debt security that is US-dollar denominated and is issued by a US or foreign
private issuer, and registered under the Securities Act; or issued pursuant to Section 4(2) of the Securities Act and purchased or sold pursuant to Securities Act Rule 144A. See FINRA Rule 6710 for a more information.
11 Dealers are required to report their trades to FINRA in a timely fashion. Starting from 2002, dealers were required
to report their trades to TRACE within 75 minutes. This window was reduced to 45 minutes (on October 1, 2003), 30 minutes (October 1, 2004), 15 minutes (July 1, 2005), and finally to immediate reporting (January 9, 2006).
evolution of the corporate bond market, along the lines of the stock-market tickers in the early 20th century.” 13
The timeline for the introduction of TRACE starts in 1998, when the SEC reviewed the transparency of US debt markets. After this review, the SEC asked NASD, a predecessor organization to the Financial Industry Regulatory Authority (FINRA), to take three steps to address the lack of bond market transparency: (i) adopt rules requiring dealers to report their transactions and develop systems that receive and distribute the transaction prices on an immediate basis; (ii) create a database of transactions in corporate bonds, which would enable regulators to proactively supervise the corporate debt market; and (iii) in conjunction with the development of a database, create a surveillance program to better detect fraud in order to foster investor confidence and the fairness of these markets. In January 2001, the SEC approved the TRACE rules, and in July 2002, NASD formally introduced TRACE.
Starting from July 1, 2002, dealers had to report their transactions to TRACE; however, the
dissemination (i.e., observability) of this information to the public was introduced in four main
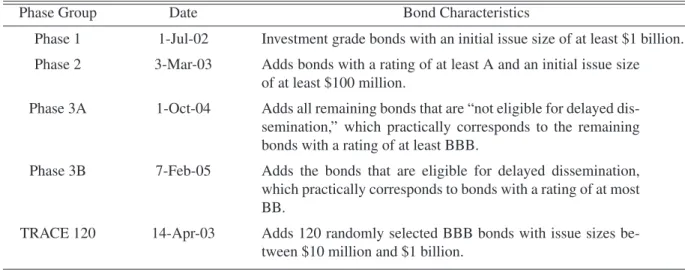
“phases.” (in 2002, 2003, 2004, and 2005). Figure 1 and Table 1 summarize the phases’ introduction dates and the requirements for bonds to be included in a phase. Phase 1 started on July 1, 2002, and included investment-grade bonds with an initial issue size of at least $1 billion.14
Phase 2 began on March 3, 2003, expanding dissemination to the next-largest bonds (initial issue size $100 million) with a rating of at least A. In addition, NASD conducted a randomized controlled experiment, selecting 120 BBB bonds with issue sizes between $10 million and $1
13 In Major Shift, NASD Expands Corporate Bond-Price Reports.
https://www.wsj.com/articles/SB1046714678626958720?mod=searchresults&page=1&pos=1.
14 In addition to the Phase 1 bonds, 50 non-investment-grade bonds that previously had information released under the
Fixed Income Pricing System (FIPS) were transferred to TRACE. I do not use these “TRACE 50” bonds for my treatment group assignment because the list changed frequently and information about some bonds was available for only a short while. According to FINRA employees, the list changed on a quarterly basis.
billion and started to disseminate these bonds’ information on April 14, 2003, as part of Phase 2. In Section 6, I describe this experiment in more detail and use it to corroborate the inferences from my main tests.
Phase 3 expanded TRACE to cover almost all bonds and was introduced in two parts. Phase 3A was introduced on October 1, 2004, and expanded the TRACE system to bonds that are “not eligible for delayed dissemination.” Phase 3B was introduced on February 7, 2005, for bonds that are “eligible for delayed dissemination.” Practically speaking, bonds eligible for “delayed dissemination” are junk bonds.15 I refer the readers to Asquith et al. (2013) and Bessembinder and
Maxwell (2008) for excellent, more extensive descriptions of the TRACE introduction.
3 Bond Informativeness and Hypothesis Development
3.1 Informativeness of Bond Prices and Trading
My study builds on the idea that the observability of bond market trading and prices adds to the firm's information environment. Informed investors reveal their private information through trading (Grossman and Stiglitz, 1980; Kyle, 1985; Glosten and Milgrom, 1985), and TRACE makes this trading and the resulting prices observable. As a consequence, not only do the transaction parties learn about the private information underlying the transactions, but so does the broader public. Ultimately, investors “share” their otherwise private information in transparent markets.
The corporate bond market is dominated by large, sophisticated institutions with excellent access to information (e.g., Bessembinder, Kahle and Maxwell, 2009; Even-Tov, 2017). These
15 Bonds with a rating of BB or worse were eligible for delayed dissemination: If a BB-rated [B-or-worse-rated] bond
trades less than once per day on average, transactions are made available after two [four] business days. In addition, dissemination was delayed for newly issued bonds with a rating of BBB or below: for BBB-rated [BB-or-worse-rated] bonds, transactions within the first two [ten] days after pricing were released on the third [eleventh] day. On January 9, 2006, TRACE stopped the delayed dissemination.
institutions spend significant resources on information acquisition, which their trades then reflect. Back and Crotty (2015) find that price discovery in bond markets spills over to equity markets, and vice versa.16 Other articles document informed trading and price adjustments prior to
economic news events, such as acquisition announcements, earnings announcements, or class action lawsuits (Wei and Zhou, 2016; Kedia and Zhou, 2014; Billings and Klein, 2011).
Security prices reflect information about the issuing firm. Because a security’s value is driven by changes in firm value and risk, it thus reflects changes in (i) firm value and (i) firm risk (Merton, 1974).17 Moreover, because the changes of firm values and risk are driven by underlying
economic actions and events, security returns reflect (iii) the presence/probability of such actions/events.
The information content of observable bond prices/trading is incremental to that of equity prices/trading, and vice versa. Observing both signals, equity and debt returns, allows investors to learn incrementally about changes in firm value, firm risk, and the probability of underlying value-relevant events. The arguably most important conceptual reason for this is that equity and debt have different payoff profiles as a function of firm value/performance and thus reflect the same underlying information set (or event) differently. A notable implication of this differential reflection of information is that the debt signal reveals additional information about the firm even
if the equity signal were “perfect” in the sense that (i) equity is perfectly efficient, (ii) equity
contains no noise, and (iii) all information debt investors incorporate into debt prices is also incorporated into equity prices.
16Back and Crotty (2015) extend the Kyle (1985) model to allow for cross-market spillovers (from bond order flow
to equity prices, and vice versa). They infer that price discovery occurs in both the bond and equity markets, and that it is not dominated by either market with respect to the information conveyed by order flows.
17 More generally, a security’s value depends on the risk-neutral distribution of a firm’s payoff. In the Merton model,
To better illustrate this point, consider the example of Klein and Zur (2011) who use debt returns in addition to equity returns to learn how hedge fund activism affects firms. They find that hedge fund activism increases equity value but decreases debt value, consistent with wealth transfers from debt to equityholders. Observing the debt signal in addition to the equity signal allowed them to better learn about at least three aspects of the firm. First, because the firm consists of equity and debt, observing both equity and debt returns allows for better assessment of the firm returns (i.e., of how the “size of the pie” changes). Second, observing equity and debt returns suggests how the “allocation of the pie” changes, and thereby how firm risk changes (or expectations of other wealth shifting events). Finally, changes of firm value and risk reflect value-relevant actions and events and are thus informative about the presence/probability of such actions and events. For example, in Klein and Zur (2011) the return profile suggests wealth shifting events/actions. When the authors test for such events, they indeed find subsequent increases in firm risk, dividend payouts, and debt issuance.
There are at least three more reasons why the information content of bonds is not subsumed by that of equity, and vice versa. First, subsets of equity and bond investors are specialized and trade on their private information only in either the equity or debt market. Therefore, equity and bond prices incorporate different pieces of private information, and observing both “signals” is more informative than observing only one. Consistent with this argument, Back and Crotty (2015) find that price discovery occurs in both the bond and equity markets, and Badoer and Demiroglu (2019) provide evidence that equity prices appear to incorporate more information from debt markets after TRACE and thus react less negatively to downgrades.18 Second, equity and bond
prices are not perfectly efficient and may thus incorporate events incorrectly. For example,
Tov (2017) and Bittlingmayer and Moser (2014) use bond returns to predict mispricing in stocks, meaning bonds contain information that should be, but is not, contained in equity prices. Finally, both equity and bond prices are noisy, and access to both signals thus leads to more precise posteriors (e.g., Holmstrom, 1979).
3.2 Hypothesis Development
Managers often have incentives to withhold information from investors. Economic theory suggests that investors’ access to alternative information is a key determinant of managers’ disclosure decisions, because it determines how investors interpret and react to disclosure (e.g., Grossman, 1981; Dye, 1985; Skinner, 1997; and Verrecchia, 1983). For example, the unraveling result by Grossman (1981) shows that if investors know with certainty whether managers possess value-relevant information, then informed managers fully reveal their information.19 In contrast,
if investors are uncertain about managers’ information endowments, managers withhold sufficiently unfavorable news (Dye, 1985; Jung & Kwon, 1988).
There are at least three non-exclusive reasons for increased market transparency to lead to increased disclosure. First, the litigation and reputational costs associated with withholding information likely increase when prices and trading become observable. Observable transaction prices and volumes are central inputs to securities litigation and assist potential plaintiffs in (i) assessing whether managers had information, (ii) quantifying investment losses stemming from their reliance on firms' disclosures and non-disclosures, (iii) tying declines in investors’ wealth to a particular disclosure or revelation, and (iv) coordinating class actions (Park, 2014). Also, observable market data help plaintiffs demonstrate that the firm’s bond market is sufficiently efficient to apply the fraud-on-the-market principle. The fraud-on-the market principle lifts the
requirement that plaintiffs demonstrate direct reliance on a particular disclosure or non-disclosure (because investors indirectly relied on it through efficient prices) and facilitates the certification of a class (Park, 2014). In total, TRACE likely increases the threat of litigation, particularly from bond investors, such that the expected litigation costs associated with withholding information are higher, which increases managers’ incentives to reveal their information (Skinner, 1994, 1997).20
Second, abnormal trading and returns suggest whether something material occurred in the firm and thus whether managers have material information. For example, prior literature documents abnormal trading and price swings before major, not-yet-announced corporate news (e.g., Kedia and Zhou, 2014; Wei and Zhou, 2016). Investors demand clarification/disclosure accordingly, such that informed managers ultimately tend to face increased demand for disclosure and are more likely to disclose. This argument can be seen as a natural extension of Dye (1985) and Jung & Kwon (1988), who show that uncertainty about the manager’s information endowment limits disclosure.21 Note that in the Dye and Jung & Kwon models, investors’ “demand” for
disclosure formalizes as a price discount investors apply in the absence of disclosure.
Finally, increased market transparency might increase disclosure by reducing the proprietary information cost associated with it. To the degree that third parties (competitors, regulators, labor) extract proprietary information from prices and trading that they would otherwise extract from disclosures, the proprietary information costs of disclosure decrease, and firms reveal more information (e.g., Verrecchia, 1983).
20 The threat of bondholder litigation is economically meaningful. Park (2014) finds that 8% of all settlements between
2001 and 2005 include bondholder recoveries.
21For illustration, suppose the market signals fully reveal whether managers have value-relevant information. In that
case, the conditions of the unraveling result are satisfied whenever managers are informed, and these managers thus fully reveal their information.
There are also arguments why increased market transparency can lead to reduced disclosure. For example, increased market transparency reduces information asymmetries about firm value between the manager and investors, which can reduce investors’ demand for information and equilibrium disclosure (e.g., Verrecchia, 1983, 1990).22 Also, broad access to
market data likely reduces information asymmetry among investors, which may limit the extent to which disclosure incrementally reduces adverse selection and the cost of capital, and thereby reduce managers’ disclosure incentives (Diamond and Verrecchia, 1991).
In sum, my main hypothesis is that market prices/returns and trading, by revealing information to market participants, change managers’ equilibrium incentives to disclose information. However, it is ex-ante not obvious whether managers disclosure incentives will increase or decrease. Second, I predict a larger effect in situations in which the revealed market prices and trading contain more new information. Third, to the extent that managers prefer to withhold bad news, I predict that TRACE particularly affects bad news disclosure.
3.3 Relevance of Corporate Disclosures for Debt and Equity Investors
Generally, corporations’ most important disclosures reveal predominantly information about the firm (e.g., about the firm’s earnings, sales, or capex). Prior literature often links such corporate disclosure to equity prices, which makes sense because equity value is driven by news about the firm.23 However, this relevance for equity investors should not be misinterpreted as
implying irrelevance for debt investors. In fact, Merton (1974) shows that the value of debt is driven by (i) firm value and (ii) firm risk. This implies that debt prices are driven by news about
22 In Verrecchia (1983, 1990) increased market transparency reduces disclosure to the degree that the information
asymmetries about firm/equity value decrease relative to the cost of disclosure.
23 Exceptional papers linking such disclosures to debt prices include Easton, Monahan, and Vasvari (2011), Shivakumar, Urcan, Vasvari and Zhang (2011), and Lok and Richardson (2011).
the firm. Ultimately, Corporate disclosures (e.g., about the firm’s earnings/performance, growth, or strategy) are therefore of crucial importance to debtholders, by the same logic that makes them important to equityholders.
3.4 Other Related Literature
The introduction of TRACE has been studied primarily by the market microstructure literature. This literature suggests that transaction costs decrease for bonds that become observable through TRACE (e.g., Bessembinder, Maxwell and Venkataraman, 2006; Goldstein, Hotchkiss and Sirri, 2007). At the same time, however, the literature generally finds no increase in trading activity. For example, Goldstein et al. (2007) find no effect on trading volume, and Asquith et al. (2019) find that trading activity does not increase, and by one measure decreases. In my sample, I test how TRACE dissemination affects firms’ average turnover of bonds and find no significant effect.
Apart from the aforementioned research, Sletten (2012), Balakrishnan et al. (2014), Zuo (2016), Hu (2017), and Kim et al. (2018) are likely the papers most closely related to mine. Of these papers, only Kim et al. (2018) study a debt market setting. The paper provides evidence that the initiation of CDS trading increases corporate disclosure; however, the paper’s focus is on CDS insurance itself, not the observability of prices and trading.24
Sletten (2012) studies the disclosure reaction to stock price drops. In contrast to my paper, (i) her focus is on ex-post disclosure as a function of ex-post price drops and (ii) prices appear to have no informational role but are assumed to move independently of value. Zuo (2016) shows
24 CDS trading represents primarily an economic action: the transfer of cash flow rights, which leads to the empty
creditor problem and reduces monitoring by debtholders. In contrast, TRACE dissemination represents the
observability of economic events/actions (or of their absence): for both treatment and control firms, bond trading takes
that stock returns tend to be more positively associated with managers’ subsequent earnings revisions when there is more informed trading, which he interprets as managers revising their earnings expectations more after observing more informative stock prices. Zuo (2016) differs from my paper because he studies neither market transparency nor the amount of information disclosure. In Balakrishnan et al. (2014) studies how managers’ disclosure affects liquidity. The study is related because it involves studying managers response to reduced retail analyst coverage (due to brokerage closures/mergers), and finds that this reduction leads to an increase in earnings-related management forecasts. The authors interpret their results as managers aiming to reduce information asymmetries between retail investors and institutional investors. Another closely-related paper is Hu (2017), which studies how an increase in the frequency at which exchanges release daily open short interest, from once per month (only mid-month) to twice (mid-month and end-of-month) affects the relative disclosure probabilities around the mid- and end-of-month dates. My paper differs from Hu’s because I study the effect of making otherwise-unobservable realized bond prices and trading observable, while Hu studies the latency/frequency at which exchanges release open short interest. Also, I focus on the total amount of management forecasts, while Hu’s evidence on the probability of end-of-month disclosure relative to the probability of mid-month disclosure speaks best to the strategic timing of disclosures around predictable public information releases.
My study is also related to the literature on the relation between mandatory and voluntary disclosure are related (e.g., Li and Yang, 2016; Noh, So and Weber, 2019). The high-level question in this literature is how mandating firms to disclose more information via one disclosure form (e.g., through financial statements or 8-K filings) alters their voluntary disclosure via an alternative disclosure form (e.g., management forecasts). The literature provides mixed evidence on whether
voluntary and mandatory disclosure are substitutes or complements: for example, Li and Yang (2016) estimate that firms provide more earnings forecasts after switching to IFRS, while Noh et al. (2019) estimate that firms provide fewer management forecasts after being required to disclose more information through 8-Ks.
My study is related to this literature because, at the highest level, the firm’s own (mandatory) disclosure also reveals information about the firm. However, I believe that market prices and trading differ fundamentally from mandatory disclosure in important ways. First, market returns are formed outside of the firm and beyond the manager’s direct control. Instead, they reflect changes in investors’ aggregate information and beliefs (“wisdom of the crowds”). Investors with value-relevant information reveal this information “truthfully” because they make profits [losses] from trading in the right [wrong] direction.
Second, mandatory disclosure and market returns map differently into managers’ voluntary disclosure incentives. For example, if a manager has already disclosed a piece of information through an IFRS financial statement or an 8-K financial statement, then she has no obligation (or even reason) to disclose this information again. Correspondingly, investors’ demand/pressure for disclosure is different (e.g., there is no threat of litigation entailed by not disclosing the information again).
Finally, the nature of the revealed information differs. Market returns and trading reflect new forward-looking information, whereas financial statements reflect largely backward-looking information, much of which is already incorporated in market prices (e.g., Kothari, 2001). Relatedly, market returns reflect a broader set of information but do so less specifically. For example, stark price swings or abnormal trading may suggest something material is happening in the firm, but not what exactly happens, which spurs different demand/pressure for disclosure.
Overall, I believe that one cannot generalize from the mandated disclosure literature to my research question. This is in particular the case because the literature provides conflicting evidence on whether mandatory disclosure leads to increased or decreased voluntary disclosure.
My study also builds on previous studies relating disclosure to uncertainty (e.g., Waymire (1985) and Bozanic et al. (2018)). Also quote studies finding increase. My study builds on this literature in at least two ways. First, my study focuses explicitly on differences in the information about the firm as opposed to differences in the firm’s fundamentals. Most measures of investor uncertainty measure (e.g., volatility of the firm’s earnings process) capture particularly differences in the firm’s fundamentals. Second, as pointed out in Healy (2001), interpreting the findings in studies that rely on simple associations is difficult because of significant endogeneity and measurement error problems. My study plausibly overcomes this challenge by studying plausibly exogenous variation in the observability of the market signal.
4 Sample
I use data from the following sources. FINRA gave me lists of the bonds introduced in each phase and also the 120 randomly chosen treatment bonds used in the FINRA 120 experiment. I obtain data on bond issue characteristics (such as issue size, maturity, or rating information) from the Mergent FISD database, data on bond transactions from the TRACE Enhanced database, data on management forecasts from IBES, data on firms’ accounting fundamentals from Compustat, and data on stock prices and returns from the CRSP Security Files.
Following prior literature, I use the intersection of CRSP and Compustat as the firm universe and “standard” corporate bonds in the intersection of TRACE and FISD as the bond universe.25 I
25 “Standard bonds” exclude non-USD bonds, Yankee bonds, Rule 144A bonds (which were also not subject to
TRACE), convertible bonds, pay-in-kind bonds, secured or asset-backed bonds, perpetual bonds, variable-coupon bonds, and bonds with an offering amount below $1 million.
match bonds to firms using a matching algorithm that relies on bonds’ cusips, issuer names in bond prospectuses, and S&P RatingsXpress and CRSP tables on WRDS. I keep the firm quarters of all firms associated with at least one bond in FINRA's phase lists. Thus, my difference-in-differences design compares only firms with public bonds, mitigating selection concerns stemming from the decision to issue bonds. I exclude firms with an SIC code between 6000 and 6999 (i.e., financial institutions and REITs). Finally, I limit the sample period to July 2001 (one year before the first phase introduction) through February 2006 (one year after the last phase introduction).
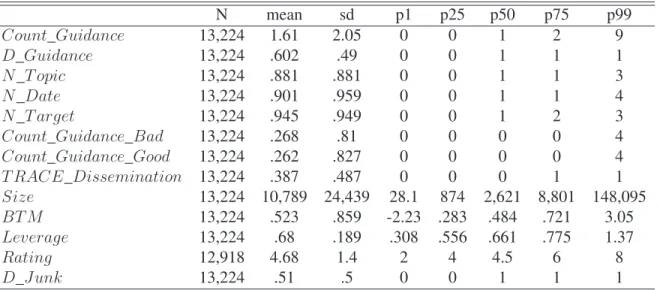
The final sample consists of 13,142 firm-quarter observations between July 2001 and February 2006, with 849 unique firms. Panel A of Table 2 displays descriptive statistics for the final sample, and Panel B shows the variable means by the TRACE phase group. The sample firms are relatively large with an average market capitalization of $10.77 billion. Firms in earlier phases tend to be larger, likely because large firms tend to have larger and more secure bond issues. The average guidance frequency is 1.59 forecasts per quarter for the pooled sample and ranges from 1.15 forecasts for Phase 3B firms to 2.18 forecasts per quarter for Phase 2 firms.
The conceptual treatment variable is the observability of market trading/prices of a firm's debt. I use FINRA’s lists of bonds introduced in each phase to code my empirical treatment variable, TRACE_Dissemination, a dummy variable that equals one if at least one of the firm’s bonds has started TRACE dissemination and zero otherwise.
5 Research Design and Main Results
My goal is to estimate the treatment effect of market transparency (i.e., of the observability of bond prices and trading) on corporate disclosure. This section contains my main tests, which exploit the staggered implementation of TRACE in a generalized difference-in-differences framework. Doing so offers multiple advantages from an empirical design perspective. First,
TRACE made virtually all trading in corporate bonds observable, thereby affecting the large population of firms with public bonds. This broad impact allows me to run large-sample tests with a high degree of statistical power. Second, firms’ bond trading became observable at different times (in 2002, 2003, 2004, and 2005), allowing me to compare firms whose bonds become observable with those of firms for whom bond observability does not change simultaneously. Importantly, I can restrict this comparison to public firms with public bonds, alleviating concerns about selection bias stemming from the endogenous decision to become/stay public or to issue bonds. Finally, having multiple introduction dates is beneficial because potential confounding effects that survive the comparison with the control group likely average out over the phases and thus have less impact on the treatment effect estimator.
5.1 Effect of Market Transparency on Disclosure
My main regression model is outlined in equation (1) and uses a generalized difference-in-differences approach (e.g., Bertrand and Mullainathan, 2003). This regression model accounts for the fact that the multiple TRACE phases are introduced in a staggered fashion. The firm fixed effects control for fixed differences between treated and non-treated firms and the time fixed effects control for aggregate fluctuations over time. The regression ultimately uses variation around the TRACE introduction dates and employs all firms whose bond observability does not change around a given introduction date as control firms, including firms that already have observable bonds from an earlier TRACE phase or will have observable bonds at a later point in time.
The outcome variable, Count_Guidance, is the count of management forecasts in the fiscal quarter.26 TRACE_Dissemination is a dummy variable that equals one if the firm has a bond for
which TRACE dissemination has begun. The coefficient on TRACE_Dissemination estimates the treatment effect of TRACE on the disclosure frequency. The control variables include the lagged log-market capitalization, lagged book-to-market, lagged leverage, and firm- and fiscal-year-quarter fixed effects. These variables control for the effects of firm size, growth opportunities, and capital structure on firms’ disclosure. My results are robust to including various other control variables, including different proxies for firm size, credit risk, firm performance, or time trends for each phase group.27 Table A1 in the appendix contains the variable definitions. I cluster standard
errors at the firm and fiscal-year-quarter levels.
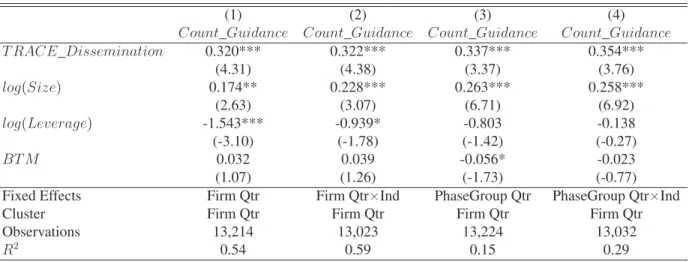
Panel A of Table 3 contains the first main result of my paper. Specifically, Column 1 contains my main specification from estimating equation (1), which uses firm and year-quarter fixed effects. The treatment effect estimate is significantly positive, suggesting that disclosure increases in response to the TRACE-induced increase in market transparency. The coefficient magnitude suggests that firms provide 0.3 more management forecasts per quarter as their bond trading becomes observable, which corresponds to an 18.8% increase in the forecast frequency relative to the sample mean of 1.6. This result can be seen as my paper’s main finding: firms increase their discretionary disclosure in response to increased market transparency.
26 Some articles use log(1+Count_Guidance) as the disclosure variable. My results are robust to using this
transformation as well. However, using the raw Count_Guidance measure allows me to better assess the economic magnitude of my estimates. Using the “logged” measure, assessing the economic magnitude is difficult. The usual “percentage-change” interpretation of logged variables is approximately right if (i) the values in Count_Guidance were large and (ii) the changes in Count_Guidance were relatively small. However, these conditions are not satisfied by Count_Guidance, so a percentage interpretation might be inadequate.
27 Including these different control variable combinations does not alter my inferences, neither qualitative nor with
regard to magnitude. I decide to include relatively few control variables in my model, trading off the potential biases from omitting relevant variables vs. those from including “bad controls” (see Angrist and Pischke, 2009).
The remaining columns in Table 3 employ different fixed effect structures. For example, to mitigate concerns that firms in different phase groups are subject to different industry-specific dynamics in disclosure, I employ industry-times-year-quarter fixed effects. I estimate a disclosure increase of 0.299 forecasts per quarter (in column 2), which is almost the same as the estimate from my main specification. In columns 3 and 4, I use less restrictive fixed effects combinations, with fixed effects for the phase groups rather than for individual firms. Across all specifications, the estimates are similar in size, ranging from 0.3 to 0.33 forecasts per quarter.
Panel B contains additional estimates of equation using a wide range of control variable combinations and also time trend variables for each phase group. For example, I control for return performance, return volatility, return skewness, trading volume, credit rating, analyst forecast dispersion and the number of analysts following. Note that I face a tradeoff here. On the one hand, including more time-varying control variables can potentially reduce selection bias. On the other hand, including more control variables can introduce “bad control” bias into the coefficients, even if they improve the prediction of disclosure (see Angrist and Pischke, 2008). This is particularly the case for variables that are affected by directly by TRACE or by the disclosure (the outcome variable). I find that the treatment effect estimator remains remarkably stable across the columns, which is reassuring because it suggests that the bias from either excluding or including the particular variable is limited.
I also include linear time trends for each phase group to mitigate the concern that the different phase groups drift differently around the phase introductions for reasons other than TRACE.28 The
28 An unwanted side effect is that the time trend variables may also capture part of the treatment effect, to the degree
inclusion of these time trend variables has limited impact on my treatment effect estimates suggesting that my treatment effect estimator is not driven by differential long-term trends.
In Panel C of Table 3, I focus on the decision about whether or not to disclose, i.e., on the extensive margin of disclosure.29 The dependent variable is D_Guidance, a dummy indicating
whether the firm made at least one management forecast in the quarter. Across all columns, I estimate that TRACE increases firms’ probability to disclose by 2.5% to 3.2%. For comparison, the probability of providing guidance is 60.1% in my sample.
In Table A3, I use an alternative difference-in-differences approach. I use windows around each phase introduction (-1 year, +1 year) and then stack these samples into a combined sample. The estimated effect of TRACE price/trading observability on disclosure is 0.33 and thus close to that from the generalized difference-in-differences regressions. Table A3 also reports the regression coefficients for each phase. I estimate a positive effect of TRACE price observability on disclosure, although this effect is insignificant for the first phase. I find it reassuring that the estimated effect is consistently positive for each phase. Admittedly, however, the individual-phase estimates are noisier and also offer more scope for bias from simultaneous events than the pooled estimates in Table 3.30
5.2 Parallel Trends and Confounding Effects
29 Note that Count_Guidance can also be seen as capturing the extensive margin in the sense that multiple disclosures
reflect multiple decisions on the extensive margin, e.g., the decisions to forecast CapEx or to forecast an additional horizon.
30 I cannot rule out that simultaneously to a given TRACE introduction, some event takes place that increases
disclosure more for the treatment group than the control group. I find it unlikely, however, that such events take place around each phase introduction, and each time such that treatment firms’ disclosure increases relative to control firms. Thus, using multiple phase introduction dates in the same regression mitigates the potential impact of such biasing factors (because their potential impact cancels out to some degree).
Like most regulation that involves multiple “treatment groups,” NASD did not assign firms into treatment groups in a purely randomized fashion. Instead, the assignment occured at the bond level based on credit ratings and issue sizes. Figure 2 illustrates the threshold rules used to assign
bonds into different treatment groups and highlights that bonds in different phase groups differ
systematically in their issue sizes and credit ratings. As a consequence, firms in different phase groups tend to differ along associated dimensions, such as their amount of public debt, firm size, and credit risk. These systematic differences are not a problem per se, but they raise the concern that firms in different treatment groups might, even in the absence of TRACE, have experienced different changes in disclosure around their respective TRACE introduction dates.
I address potential concerns about parallel trends in two broad ways. First, in this subsection, I examine the timing of the disclosure increase relative to the TRACE introduction dates and provide evidence that the parallel trends assumption is satisfied in my sample. My second broad way of addressing concerns about parallel trends is to focus directly on the source of possible differences between the treatment and control groups: the non-random assignment of bonds into treatment groups. In Section 6, I exploit a randomized controlled experiment, in which NASD started to release the transaction information for a small number of randomly selected bonds. In a similar spirit, in Section 7, I exploit cutoff rules used by NASD that sometimes lead to discrepancies in the treatment group assignment of otherwise similar firms.
In this subsection, I examine the timing of changes in firms’ disclosure relative to the TRACE introduction dates. The intuition underlying this examination is that market transparency increases discontinuously around a firm’s phase introduction date, while confounding effects likely do not. Thus, if the observability of trading and prices affects disclosure, I expect a discontinuous increase in disclosure around the TRACE introduction dates. This intuition is similar
to that underlying an RDD test in which the treatment-assigning variable is the time relative to the TRACE introduction dates. Moreover, by uncovering how a firm’s pre-period disclosure evolved (relative to the control group), the examination suggests whether the parallel trends assumption is plausible.
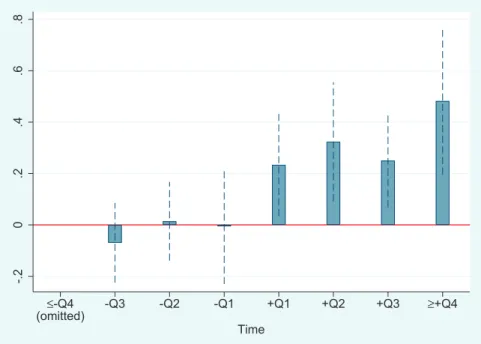
𝐶𝑜𝑢𝑛𝑡_𝐺𝑢𝑖𝑑𝑎𝑛𝑐𝑒 𝛾 𝑄𝑡𝑟𝑃𝑟𝑒3 𝛾 𝑄𝑡𝑟𝑃𝑟𝑒2 𝛾 𝑄𝑡𝑟𝑃𝑟𝑒1 𝛽 𝑄𝑡𝑟𝑃𝑜𝑠𝑡1 𝛽 𝑄𝑡𝑟𝑃𝑜𝑠𝑡2 𝛽 𝑄𝑡𝑟𝑃𝑜𝑠𝑡3 𝛽 𝑄𝑡𝑟𝑃𝑜𝑠𝑡4_𝑝𝑙𝑢𝑠 𝛼 𝛼 𝛾 𝐶𝑜𝑛𝑡𝑟𝑜𝑙𝑠, 𝜀 2
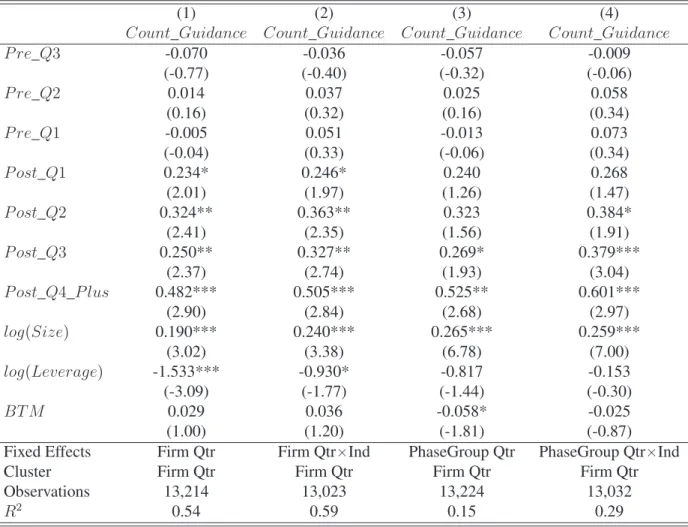
Equation (2) estimates the treatment effect of the TRACE introductions on disclosure in the surrounding quarters. The period ending in the fourth quarter before the TRACE introduction is omitted and thus serves as the benchmark against which the change in disclosure is measured. Table 4 contains the estimates, and Figure 3 plots the estimates from my main specification. Consistent with parallel trends, the estimated treatment effects are close to zero and insignificant for each quarter before a firm’s TRACE introduction and significant and positive for each quarter
after it. In other words, disclosure jumps precisely when a firm’s prices and trading become
observable, but not before, suggesting that disclosure increases because of the information’s availability in TRACE, rather than confounding factors. Moreover, consistent with the idea that TRACE reveals more information over time, disclosure appears to increase slightly over the post-period.
5.3 Effect on Three Dimensions of Managerial Forecast Frequency
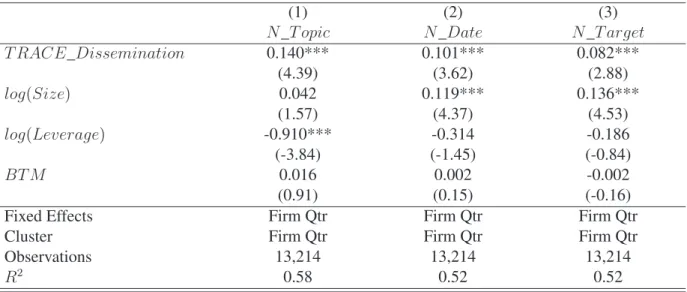
To shed further light on the nature of the documented disclosure increase, I provide more granular evidence on how firms change their disclosure. Specifically, I ask three related questions. Do managers forecast (i) more “topics” (e.g., CapEx in addition to Earnings), (ii) more horizons (e.g., the fiscal year 2005 in addition to 2004), and (iii) more frequently (e.g., on February 1 in addition to March 1)? To capture these dimensions, I code the variables (i) N_Topic as the count
of distinct forecasted topics, 31 (ii) N_Target as the count of distinct forecasted target months, and
(iii) N_Date as the count of distinct dates when a forecast is made.
Table 5 contains my estimates. I find that firms significantly increase their disclosure frequency along all three disclosure dimensions. This finding suggests that firms disclose not only more frequently the same variables, they also disclose about a broader set of variables (e.g., about additional topics and periods).
5.4 Cross-Sectional Variation in the Informativeness of Bond Prices and Trading
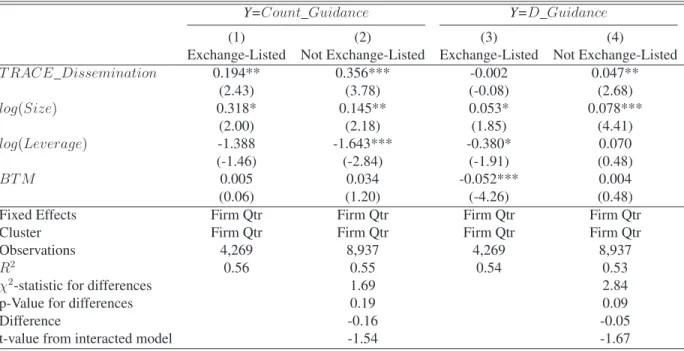
If the increase in disclosure is driven by the dissemination of price and transaction information, then I predict a stronger effect in situations in which the disseminated prices and trading tend to contain more incremental information. I test this prediction in two ways. First, I test whether the TRACE introduction has a weaker effect on firms with exchange-listed bonds.32
Exchange-listed bonds generally have observable binding quotes and thus had a relatively higher degree of price transparency even before TRACE. TRACE is thus likely to reveal less incremental information. I partition the sample based on whether a firm has exchange-listed bonds and estimate the effect of TRACE in each sample. Table 6 contains the results. The increase in disclosure is half as strong for firms with exchange-listed bonds as for firms without them (0.16 vs. 0.33), which is consistent with the idea that the revealed information content of market trading and prices is what leads to the documented increase in disclosure.
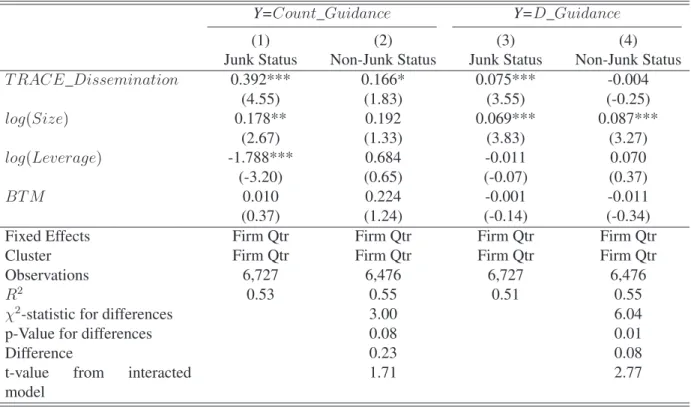
My second test relies on Merton’s (1974) insight that the information sensitivity of debt increases with the firm’s credit risk. At one extreme, for firms with risk-less debt, debt values do not change with news about the firm and are thus uninformative. At the other extreme, for
31 Possible topics are ‘Earnings’, ‘Sales’, ‘CapEx’, and ‘Other’.
32 I obtain data on whether a bond is listed on the NYSE from Mergent FISD. Mergent generally codes this information
to-default firms, debt values are very sensitive to information about firm value and are thus more reflective of this information. I partition the sample into investment-grade and junk-bond firms and estimate the effect of TRACE in each sample. Table 7 contains the estimation results. The estimated increase in disclosure is more than twice as large for the junk-bond firms as it is for the investment-grade firms (0.36 vs. 0.14), further supporting the notion that the increase in disclosure is driven by the revealed information content of prices and trading.
5.5 Effect on Bad vs. Good News Disclosure
Accounting theory generally predicts that managers have greater incentives to withhold bad news than good news. If the increase in disclosure is attributable to less withholding of bad news, then I expect that the disclosed information content will become more negative, on average. I test this prediction in two ways. First, I classify disclosures as negative or positive and test whether TRACE predominantly affects the amount of negative disclosures. Second, I test whether the average announcement return becomes more negative after TRACE’s introduction to draw inferences about the average information content of the disclosures.
My first test classifies management forecasts into positive and negative based on whether the market’s reaction to the forecast is positive or negative (using the 3-day market-adjusted return). Stock returns correspond to the theoretical information construct in accounting theory and capture a forecast’s unexpected value implications. Two further advantages of using stock returns to classify forecasts are that (i) I can classify management forecasts about sales or CapEx, for which an unexpectedly high forecasted values are not necessarily good news, and (ii) I can circumvent problems associated with measuring the manager’s expectation revealed through the forecast and the market’s expectation at the time of the forecast.33 However, using returns to
33 An alternative to using returns to classify announcements is to focus only on earnings forecasts, for which a
classify management forecasts requires the stock return to correspond well to the revealed information in the management forecast, i.e., the announcement returns should not be confounded by simultaneous events, such as earnings announcements. For this reason, I focus on unbundled forecasts. Panel A of Table 8 shows the estimation results. The frequency of management forecasts increases significantly for bad, but not for good, news announcements, consistent with the idea that the additional disclosures represent otherwise-withheld bad news.
In Panel C, I classify earnings forecasts into good and bad news relative to the analyst consensus. I focus on earnings forecasts because higher-than-expected earnings imply a positive market surprise, and thus, I can classify an announcement by comparing (i) the manager’s revealed expectation and (ii) the market’s expectation before the forecast. For each forecast, I proxy (i) for the market’s expectation using the analyst consensus and (ii) for the manager’s revealed expectation using the forecast itself. For range forecasts, which make up most management forecasts, measuring the revealed expectation of a given forecast is not straightforward. For example, Ciconte et al. (2014) demonstrate that the range midpoint is a bad proxy for the manager’s revealed expectation, even on average, and suggest that the lower bound of the range better reflects the manager’s revealed expectation. I thus use the lower-bound as my first proxy of the manager’s expectation, but also use the range midpoint as an alternative measure.
Panel C contains the estimation results. I estimate that TRACE increases the number of bad-news disclosure but not of good-bad-news disclosures when I use the classification based on Ciconte et al. Using the alternative measure that is based on managers’ midpoint forecasts, the estimated
correctly measure for each forecast (i) what the manager’s revealed earnings expectation was and (ii) what the market’s expectation at the time of the forecast was. One could assume the midpoint of the manager’s range forecast equals the manager’s revealed earnings expectation; however, Ciconte et al. (2014) demonstrate that the range midpoint is a bad proxy for the manager’s revealed expectation, even on average. Likewise, one could assume that past analyst forecasts equal the market’s expectation at the time of the forecast, but the analyst forecast might be stale and also biased, with the bias depending on the forecast horizon (e.g., Kothari et al., 2016).
effect is positive on both bad- and good-news disclosure, and that the effect is 35% stronger on the disclosure of bad news. These results overall suggest that TRACE increases particularly the disclosure of bad news, consistent with the idea that managers, on average, reveal more bad news following the introduction of TRACE.
5.6 Signed and Unsigned Market Reactions to Management Forecasts
My results thus far suggest that firms provide significantly more disclosures in response to their prices and trading becoming observable. However, this does not necessarily mean that the average disclosure becomes more informative because (i) part of the value-relevant information may already have been revealed through the observable prices and trading or through previous additional disclosures. To shed more light on the value-relevance of individual disclosures, I test how TRACE affects the average market reaction to the management forecasts.
In particular, I test how TRACE affects the reaction strength to unbundled management forecasts (conditional on a forecast being made). I use the absolute value of the 3-day market-adjusted return around the announcement to proxy for the strength of the price reaction to a management forecast. Using the panel of unbundled announcements, I estimate the difference-in-differences regression
𝑎𝑏𝑠 𝑅𝑒𝑡 𝛽 ⋅ 𝑇𝑅𝐴𝐶𝐸_𝐷𝑖𝑠𝑠𝑒𝑚𝑖𝑛𝑎𝑡𝑖𝑜𝑛 𝛼 𝛼 𝜖 ? where the subscript 𝑓 refers to a forecast.
Panel A of Table A7 contains the regression results. The absolute return reactions increase significantly for firms whose prices/trading become observable through TRACE relative to control firms whose price/trading observability does not change simultaneously. This suggests that managers reveal more new information to the market, such that investors gain access not only to more information disclosures but also to more value-relevant corporate disclosures. The estimated
effect of 0.7% is economically meaningful (for comparison, the sample mean of the absolute return reactions is 4.9%).
I also confirm the result that managers tend to reveal more negative information following the introduction of TRACE. In Panel B, I test how TRACE affects the signed return reaction to management forecasts (proxied by the 3-day market-adjusted return). I estimate a significantly negative effect of TRACE on the announcement returns, consistent with the idea that the forecasts, on average, reveal more negative information. The effect is economically meaningful with a magnitude of about 1%, suggesting that TRACE increases managers’ incentives to reveal their negative information in a timely manner.
6 Exploiting Variation from TRACE Controlled Experiment
NASD conducted a small controlled experiment, introducing 120 randomly selected BBB-rated bonds to TRACE on April 14, 2003. I use this experiment to address the concern that in my main sample treatment is not randomized and the parallel trends assumption is thus not implied. The experiment was conducted together with three finance researchers to estimate the effect of price transparency on liquidity (on volume and estimated bid-ask spreads) and is published in Goldstein et al. (2007).34
6.1 Replication of the Sample
FINRA kindly provided me with the list of the 120 treated bonds, so I know which bonds received treatment and which did not. To replicate the pool of bonds that could have received treatment (hereafter, the “base sample”), I follow the experiment description in Goldstein et al.
34Goldstein et al. (2007) find (i) no effect on trading volume and (ii) a reduction in estimated “spreads” for their
subsample of actively traded bonds. The results are consistent with investors learning from the broader bond pricing data and being able to negotiate better terms with dealers.