THE DYNAMIC SCHEDULING OF AIRCRAFT IN THE NEAR TERMINAL AREA
by
Roger G. Dear
Flight Transportation Laboratory Massachusetts Institute of Technology
Cambridge, Massachusetts 02139
FTL Report R76-9 September, 1976
2
Abstract
Aircraft arrive in a random fashion into a terminal area seeking to land at a given runway. The aircraft are differentiated by their landing velocities. All aircraft are required to maintain a prespecified minimum horizontal separation distance and also fly on a common final approach. As a consequence, the minimum interarrival time separation is interactive, i.e., a function of the landing velocities of the preceding and following aircraft as well as the separation minimum and final approach length.
The controller's decision-making problem in sequencing the aircraft, termed dynamic scheduling, is formulated in this dynamic environment. It is observed that the first-come, first-serve discipline is inefficient and the system properties employing optimality objectives of maximum throughput and minimum delay are investigated. The solutions must be updated with each new arrival and, as a result, the solutions employing these optimality objectives are shown to have undesirable properties, including 1) a priority structure with the potential for indefinite delay; 2) non-implementable updating assignments; 3) computationally intractable solutions in real time.
As a consequence of this analysis, a decision methodology termed Constrained Position Shifting (CPS) is proposed to eliminate these
undesirable properties. CPS prohibits an aircraft from being shifted more than a given number of positions from its first-come, first-serve position.
The CPS methodology is then shown via simulation to be practical, efficient and extremely flexible, with the following properties:
1. increases the runway throughput rate
2. treats individual aircraft equitably
3. treats aircraft velocity classes equitably 4. particularly successful during peak periods
5. well within the capabilities of today's computers.
The simulation is designed to compare identical arrival streams under various strategies. The simulation-aided analysis is then extended to include "heavy" jets (with aircraft dependent separation minima) and also mixed operations (arrivals and departures). Even
greater improvements in terminal area levels of service are demonstrated for these extensions.
Acknowledgement
The author would first like to thank his thesis committee, Professors Robert Simpson, Alvin Drake and Amedeo Odoni, for their assistance in the generation of this dissertation.
Professor Robert Simpson of the Department of Aeronautics and Astronautics has been extremely helpful in bridging the gap between the real world Air Traffic Control environment and the academic ivory tower.
Professor Alvin Drake of the Department of Electrical Engineering and Computer Science has also served as my academic advisor in my final years of graduate study. His insight and friendly advice have been
invaluable, as has his guidance during the years I served as a teaching assistant for his Probabilistic Systems Analysis course. I would also
like to apologize to him for my numerous last minute appeals for his time, which he invariably donated.
My deepest gratitude is reserved for Professor Amedeo Odoni of the Department of Aeronautics and Astronautics. Professor Odoni's confidence and support throughout my entire graduate school career is a primary reason for my success. Professor Odoni acted as my thesis supervisor for both my S.M. and Ph.D. theses. His constant accessibility and insightful conents have been invaluable. Furthermore, his friendship and concern for me as a person are particularly appreciated in today's somewhat cold and callous world.
Other thanks are due to Linda Woodbury for her extremely competent job of typing this thesis, and to John McKenzie of MIT's Research
Laboratory of Electronics for providing access to the Laboratory's PDP-l computer, where the initial simulation development was accomplished.
Finally, I would like to express my sincerest thanks to my very special friends and family for their never faltering moral support and encouragement throughout my academic career, especially during these past two arduous years. I share my success with them.
Table of Contents
page
Chapter I: Introduction 15
1.1 The Dynamic Scheduling Problem 15
1.2 Constrained Position Shifting (CPS) -- The Proposed 20 Solution Methodology
1.3 Constrained Position Shifting -- Sample Simulation Results 22
1.4 Outline of the Remaining Chapters 33
Chapter II: The Terminal Area Model 39
2.1 Introduction 39
2.2 The Model 40
2.2.1 Terminal Area Assumptions 40
2.2.2 Terminal Area Characteristics 41
2.2.3 System Objectives 44
2.3 Review of Related Research 45
Chapter III: The Dynamic Scheduling of Arrivals 49
3.1 Introduction 49
3.2 Interarrival Dynamics 51
3.2.1 Definitions 51
3.2.2 Minimum Interarrival Time Separation 52
3.2.3 The Interarrival Separation Matrix 55
3.2.4 Example 3.1 -- Comparison of Landing Sequences 57
3.3 Sequencing Considerations 59
3.4 Dynamic Scheduling 61
3.4.1 Introduction 61
3.4.2 Optimality and Measures of Effectiveness 63
3.4.2.1 Introduction 63
3.4.2.2 Delay Related Measures 64
3.4.2.3 A Measure of Runway Utilization 65
3.4.2.3.1 Runway Service Time at a Free Runway 66
3.4.2.3.2 Busy Runway Service Time 67
Chapter III (continued) page
3.4.2.4 Saturation Capacity 71
3.4.2.5 Example 3.2 73
3.4.3 Dynamic Scheduling-Mathematical Formulation 75 3.4.4 Example 3.3 -- Comparison of Optimality Measures 78 3.4.5 Example 3.3 (continued) -- Dynamic Considerations 83 3.4.6 Dynamic Scheduling -- The Analytic Methodology 88 3.5 Minimizing Block(N) -- Or How to Land Aircraft As Soon
As Possible 91
3.5.1 Introduction 91
3.5.2 The Single Busy Period ASAP Problem 92
3.5.2.1 Introduction 92
3.5.2.2 Assumptions and Definitions 94
3.5.2.3 Example 3.4 -- Subsequence Definition 96
3.5.2.4 The Unconstrained ASAP Problem 97
3.5.2.5 A Measure for Monotonic Subsequences 100
3.5.2.6 Example 3.5 103
3.5.2.7 The Constrained ASAP Problem -- Motivation 105
3.5.2.7.1 Introduction 105
3.5.2.7.2 The Constrained ASAP Problem -- An Important Result 107
3.5.2.7.3 Example 3.6 109
3.5.2.8 The Constrained ASAP Solution 112
3.5.2.8.1 Subsequence Requirements 112
3.5.2.8.2 The Constrained ASAP Solution Form 114
3.5.2.8.3 Conclusions 119
3.5.2.9 Example 3.7 120
3.6 Minimizing Total Delay 122
3.6.1 Introduction 122
3.6.2 The N Aircraft Scheduling Problem -- Minimize Delay(N) 122 3.6.3 An Equivalent Minimum Delay Objective 124
3.6.4 Minimum Delay Solution -- Initial Constraint = MAX 126 3.6.5 Minimizing Delay(N) -- The General Solution 132
Chapter III (continued) page
3.7 Constrained Position Shifting (CPS) 141
3.7.1 CPS -- Introduction and Motivation 141 3.7.2 CPS Methodology -- Fundamental Principle 142
3.7.3 CPS Methodology -- Objectives 146
3.7.4 CPS Methodology -- Additional Constraints 147
3.7.5 CPS Methodology -- Conclusions 148
Chapter IV: The Dynamic Scheduling of Arrivals
--Simulation and Results 150
4.1 Introduction 150
4.2 The Simulation 151
4.2.1 Purpose of the Simulation 151
4.2.2 The Simulation -- General Overview 153
4.2.3 The Simulation -- Inputs 156
4.2.4 The Simulation-Output Statistics 160
4.2.4.1 Introduction 160
4.2.4.2 Aircraft Related Statistics 162
4.2.4.3 Runway Related Statistics 164
4.2.5 Decision Logic 170
4.3 Simulation Results 177
4.3.1 Introduction 177
4.3.2 Outline of Output 180
4.3.3 Simulation Results -- FCFSRW -- Eleven Classes 182
4.3.3.1 Introduction 182
4.3.3.2 Landing Velocity Distribution 184
4.3.3.3 Saturation Capacity 187
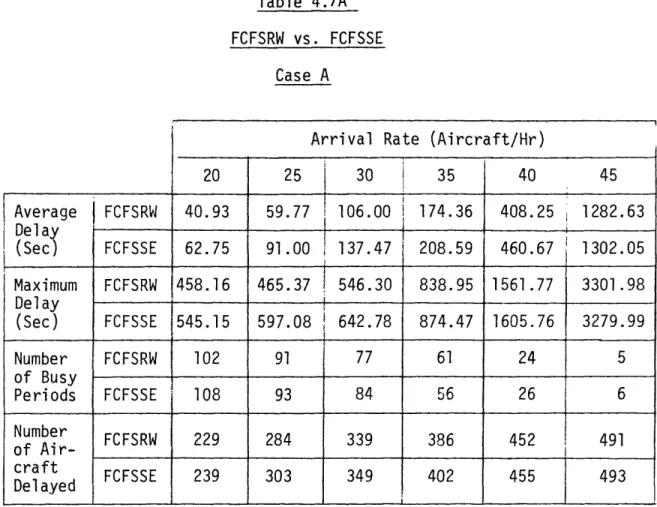
4.3.3.4 First-Come,, First-Serve at the Runway (FCFSRW) 189 4.3.4 Simulation Results -- FCFSRW vs. FCFSSE 198
4.3.5 Simulation Results -- FCFSRW vs. CPS 203
4.3.6 A Comparison of CPS Strategies 222
4.3.7 CPS-Sensitivity to Lead Time 239
page Chapter V: The Dynamic Scheduling of Aircraft-Extensions 258
5.1 Introduction 258
5.2 Simulation Results -- Heavy Jets Included 262
5.3 Simulation Results -- Departures Included 279 Chapter VI: Conclusions and Directions for Further Research 303
6.1 Introduction 303
6.2 Conclusions 304
6.2.1 Analytic Review 304
6.2.2 Simulation Result Summary 307
6.2.3 Implementation Considerations 310
6.3 Directions for Further Research 314
Table of Tables Table Table 1.1 - 1.2-Table 1.3 -Table 1.4 -Table 1.5 -Table 1.6 -Table 1.7 -pages 24 Sample Simulation Results, FCFSRW vs. CPS
Sample Simulation Results--Position Shifts from First-Come, First-Serve
Sample Simulation Results, FCFSRW vs. CPS--Average Delay by Velocity Class
Sample Simulation Results, FCFSRW vs. CPS--Maximum Delay by Velocity Class
Sample Simulation Results, FCFSRW vs. CPS--Average Position Shifts from FCFSRW by Velocity
Class
Sample Simulation Results, FCFSRW vs. CPS--12% Heavy Jets
Sample Simulation Results, FCFSRW vs. CPS--50% Departures Table 3.1 -Table Table Table 3.2 3.3 3.4 Table 3.5 -Table Table Table Table Table Table Table Table Table Table Table Table 3.6 3.7 -3.8 -3.9 -3.10 3.11 3.12 3.13 3.14 3.15 3.16 3.17
Minimum Interarrival Time Separation (Seconds) at the Runway
A Comparison of Landing Sequences Example 3.3--Arrival Data
Example 3.3--First-Come, First-Served at System Entrance
Example 3.3--First-Come, First-Served at the Runway
Example 3.3--Minimum Total Delay, Del(5) Example 3.3--Minimum Total Cost, Cost(5)
Example 3.3--Minimum Runway Blockage, Block(5) Comparison of the Five Strategies of Example 3.3 - Example 3.3--Dynamic Updates
- Initial Constraint Subsequence Requirements
- Example 3.6--ASAP Solutions
- Single Boundary Constraint Subsequence Requirements
- Two Boundary Constraint Subsequence Requirements - The ASAP Solution Requirements
- Constrained ASAP Solution Form
- Constrained ASAP Solution (Minimum p-measure and Subsequence Endpoints) 56 58 79 79 80 80 81 81 82 86 106 110 112 113 115 116 117
Table Table Table 3.18 3.19 3.20 Table 3.21
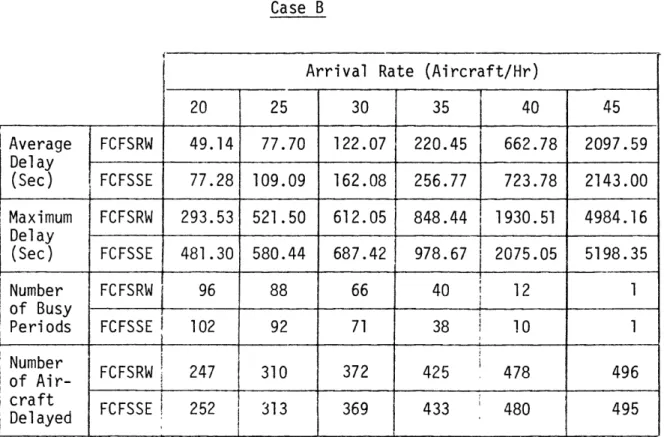
-Example 3.8--Cases A and B Example 3.8--Case C
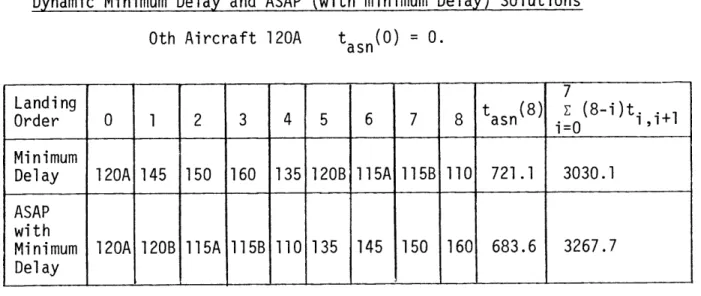
Example 3.8--Dynamic Minimum Delay and ASAP (with minimum Delay) Solutions
Example 3.8--Cases D and E Tabl e Table Table Table Table Table Table Table Table Table Table Table Table Table 4.1 4.2 4.3 4.4 4.5 4.6 4.7 4.8 4.9 4.10 4.11 4.12 4.13 4.14 Table 4.15 Table 4.16 Table Table Table 4.17 4.18 4.19 Table 4.20 Table 4.21 Table 4.22 - Simulation Inputs
- Minimum Ladning Time Separation Between Successively Arriving Aircraft--Eleven Classes
- Average Saturation Throughput - FCFSRW--Summary
- FCFSRW--Average Delay by Class - FCFSRW--Maximum Delay by Class - FCFSRW vs.FCFSSE
- FCFSRW vs. CPS--Average Delay - FCFSRW vs. CPS--Maximum Delay
- FCFSRW vs. CPS--Number of Busy Periods (and Aircraft Delayed)
- FCFSRW vs. CPS--Shifts from FCFSRW
- Comparison of CPS Strategies--Average Delay - Comparison of CPS Strategies--Maximum Delay - Comparison of CPS Strategies by Velocity
Class--Average Delay
- Comparison of CPS Strategies by Velocity Class--Maximum Delay
- Comparison of CPS Strategies by Velocity Class--Average Position Shifts from FCFSRW - CPS-Sensitivity to Lead Time--Average Delay
- CPS-Sensitivity to Lead Time--Maximum Delay - CPS-Sensitivity to Lead Time--Number of Busy
Periods (and Aircraft Delayed)
- Sensitivity to Landing Velocity Distribution--FCFSRW Summary
- Sensitivity to Landing Velocity Distribution--FCFSRW Average Delay by Class
- Sensitivity to Landing Velocity Distribution--FCFSRW Maximum Delay by Class
pages 135 136 137 139 158 183 188 190-191 193-194 196-197 199-202 204-205 211-213 214-215 218-221 223 224 227-230 231-234 235-238 240 241 242 247 248 249
Table 4.23 Table 4.24 -Table 4.25
-- Sensitivity to Landing Velocity FCFSRW vs. CPS
Distribution--Sensitivity to Landing Velocity Distribution FCFSRW vs. CPS--Maximum Delay
Sensitivity to Landing Velocity Distribution FCFSRW vs. CPS--Number of Busy Periods(and Aircraft Delayed)
Table 4.26 - Sensitivity to Landing Velocity Distribution FCFSRW vs. CPS--Shifts from FCFSRW
Table 5.1 -Minimum Time Separation (Sec) at the Runway Arrivals and Departures
Table 5.2 - Landing Velocity Distribution and Saturation Throughput, Heavy Jets Included--500 Aircraft, Eleven Classes
Table 5.3 - FCFSRW--Summary, Heavy Jets Included
Table 5.4 - FCFSRW vs. CPS, Heavy Jets Included--Average Delay
Table 5.5 - FCFSRW vs. CPS, Heavy Jets Included--Maximum Delay
Table 5.6 Table 5.7 Table 5.8 Table 5.9
- FCFSRW vs. CPS, Heavy Jets Included--Number of
Busy Periods (and Aircraft Delayed)
- FCFSRW vs. CPS, Heavy Jets Included--Shifts from FCFSRW
- Number of Arrivals by Velocity Class and Departure by SID Route
- FCFSRW--Departures Only
Table 5.10- FCFSRW vs. CPS, Departures Only--Three Routes, Average Delay
Table 5.11 - FCFSRW vs. CPS, Departures Only--Three Routes, Maximum Delay
Table 5.12 - FCFSRW vs. CPS, Departures Only--Three Routes, Number of Busy Periods (and Aircraft Delayed) Table 5.13- FCFSRW vs. CPS--Shifts from FCFSRW,
Departures Only--Three Routes Table 5.14- FCFSRW--Summary, 25% Departures Table 5.15 - FCFSRW--Summary, 50% Departures Table 5.16 - FCFSRW--Summary, 75% Departures
Table 5.17- FCFSRW vs. CPS--Arrivals and Departures, Average Delay pages 251 254 255 256-257 260 264 265-267 268 269 270 275-278 281 284 285 285 286 287 288 289 289 291
13
pages Table 5.18- FCFSRW vs. CPS--Arrivals and Departures,
Maximum Delay 292
Table 5.19- FCFSRW vs. CPS--Arrivals and Departures,
Number of Busy Periods (and Aircraft Delayed) 293 Table 5.20 - FCFSRW vs. CPS--Average Delay (Sec) Comparison
Arrivals vs. Departures 295
Table 5.21 - FCFSRW vs. CPS--Arrival-Departure Comparison by
Class, 25% Departures 297-280
Table 5.22 - FCFSRW vs. CPS--Arrival-Departure Comparison by
Class, 50% Departures 299-300
Table 5.23 - FCFSRW vs. CPS--Arrival-Departure Comparison by
Table of Figures Figure Figure Figure Figure Figure Figure Figure Figure Figure 3.1 3.2 3.3 3.4 3.5 3.6 3.7 4.1 4.2 Figure 4.3 Figure 4.4 Figure Figure Figure Figure Figure 4.5 4.6 4.7 4.8 4.9 Figure 4.10 Figure 5.1
--Minimum Interarrival Separation-Overtaking Case - Minimum Interarrival Separation-Opening Case - Free Runway Service Time
- Busy Runway Service Time - Subsequence Definition - Example 3.4--Subsequences -I 0 and fl' Sequences
- Standard Probability Distributions
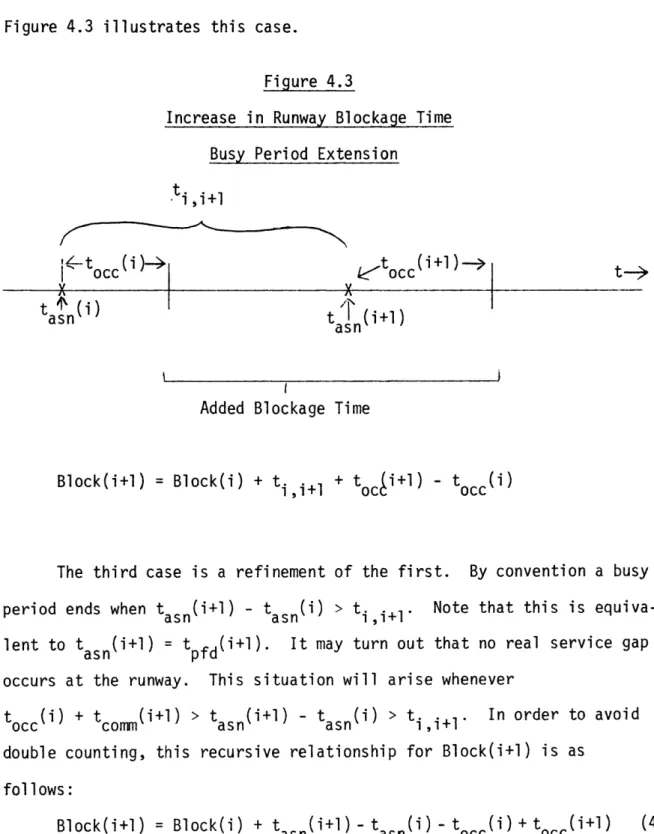
- Increase in Runway Blockage Time--Independent Arrivals
- Increase in Runway Blockage Time--Busy Period Extension
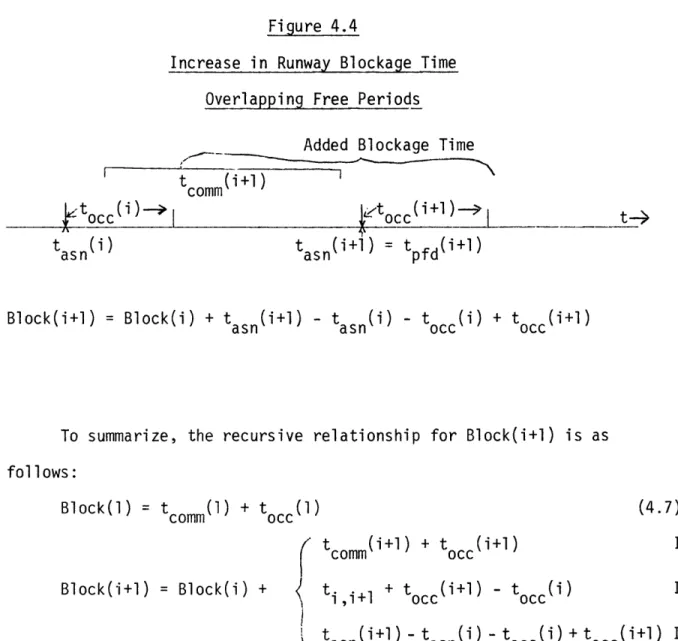
- Increase in Runway Blockage Time--Overlapping Free Periods
- Decision Logic Flow Chart - Simulation Flow Chart
- Landing Velocity Distribution--Eleven Classes
- FCFSRW vs. CPS--Percent Reduction in Average Delay
- Sensitivity to Landing Velocity Distribution--Six Classes and Three Classes
-Sensitivity to Landing Velocity Distribution--Percent Reduction in Average Delay
FCFSRW vs. CPS--Percent Reduction in Average Delay Heavy Jets Included
pages 54 54 67 68 97 103 127 159 166 167 168 174 176 185-186 207-210 244-245 252-253 271-274
Chapter I Introduction 1.1 The Dynamic Scheduling Problem
It is generally acknowledged that the control of aircraft in the high density terminal area is one of the most difficult tasks confronting the modern-day air traffic controllers. For it is in this environment that overall system efficiency becomes nearly as important as safety, especially during peak periods when the demand for the facilities
approaches, or even exceeds, the system's service capabilities. In this regard, the utilization of the terminal area runway(s) is the primary bottleneck in system efficiency. This is a natural consequence of the geometry of the terminal area, where arriving aircraft are merged from a three-dimensional space to essentially a single point (the runway
threshold). The problem is particularly acute when, for safety con-siderations, the controller must insure that all aircraft maintain a pre-specified minimum co-altitudinal separation distance. The research presented herein is addressed to this problem, namely the investigation of procedures for safe and efficient terminal area aircraft operations that implicitly uphold the minimum airborne separation standards. The research is primarily concerned with the sequencing and scheduling of aircraft in this dynamic environment. As a consequence, the decision-making process is termed dynamic scheduling.
If all aircraft had identical landing velocities and characteristics, there would be no need for this research. To elucidate, the minimum
airborne separation requirement translates to a minimum interarrival time separation at the runway which is a function of the landing velocities and of the relative weight of both the preceding and
following aircraft. In general, this time separation will be minimized if the following aircraft is at least as fast as the preceding one. If all aircraft had identical landing velocities, the minimum inter-arrival time separation will be constant and the come, first-serve procedure which is now in use is as good as any other. Aircraft, however, do not have identical landing velocities. As a consequence, certain arrival sequences will be particularly inefficient (for
instance, having very slow aircraft alternate landings with very fast ones). Thus, a sequencing procedure such as first-come, first-serve, which is subject to all the randomness of the arrival process, will,
from the standpoint of runway utilization, be clearly undesirable. This is not a new realization. For instance, in a 1964 paper [261 by S. Ratcliffe of the Royal Radar Establishment, the author writes,
"Terminal area ATC must provide each aircraft with access to a network of different facilities. If these each treat their customers on a 'first-come, first-served' basis,
congestion arises which could be avoided by more comprehensive planning. In a large busy terminal area it is at present necessary to decentralize the control process to avoid overloading the human controllers and it is then hard to avoid using first-come, first-served. This undesirable trend can be reversed if we hand over part of the decision-making process to an electronic computer."
The underlying philosophy of this research is in agreement with Ratcliffe's conclusions. Simply stated, it is felt that, by utilizing
today's computer power and instrumentation sophistication, the controller workload can be reduced and system performnace improved through the use of computer-assisted decision-making, without affecting the controller's autonomy.
Whether this objective can be accomplished to the satisfaction of all terminal area users is a major issue. Earlier research attempts at runway optimization revealed inherent undesirable performance charac-teristics. One such attempt is described in the MITRE Corporation's "Genealogy of Terminal ATC Automation" [14], in which a procedure termed Speed Class Sequencing is proposed. Essentially, the speed class sequencing concept seeks to optimize runway utilization by
"building up long landing strings of aircraft such that each aircraft has a speed equal to or greater than the preceding aircraft. Whenever it is necessary to break the string (because no aircraft with an equal or greater speed is available), a new string is initiated. The new sequence can be started in one of the following ways: 1. Start with the aircraft with the earliest estimated
time of arrival at the runway.
2. Start with the slowest type of aircraft that is available." It was concluded, however, that speed class sequencing
"leads to large and inequitable delays for individual aircraft and types of aircraft. The delays can be larger than the advantages gained from the increased landing rate. There also appears to be a discrimination against slow aircraft."
The authors then propose a procedure of Limited Speed Class Sequencing to partially overcome these disadvantages by batching air-craft into groups and speed class sequencing airair-craft within the group.
There are fallacies, however, in the speed class sequencing concept. For instance, the analysis of Section 3.5 will reveal that,
in particular circumstances, runway utilization will be optimized by sequencing aircraft such that slower aircraft follow faster aircraft, which is precisely the opposite of the speed class sequencing concept. There are other, perhaps counter-intuitive, results related to the
sequencing of aircraft at the runway. For instance, Chapter III also reveals that the sequence which maximizes the aircraft throughput rate is not the same as the sequence which minimizes the total delay
to the aircraft.
The issue of efficient scheduling is further complicated by the uniqueness of the problem at each point in time. For instance,
Straeter, Park, and Hogge, in "Application of Optimization Techniques to Near Terminal Area Sequencing and Flow Control," [31], state
"the choice of landing order and the determination of delays necessary to carry out that landing order safely can be made only be consideration of all planes
currently in the system."
Since, in general, the number of aircraft will be large, (20 or more), this fact raises the serious question of whether the "optimal" solution is obtainable in real time. If exhaustive enumeration techniques are employed, the combinatorics rapidly become overwhelming, even for the fastest computer (for instance, 5!=120, 10!=3,628,800, and 15!=1,307, 15!=1,307,674,368,000). Although techniques other than exhaustive enumeration are possible, the prospect for success in a real time environment is slim. For instance, R.S. Pardee offers in [22] a
dynamic programming approach where, for 15 aircraft "only" 3.7 x 10⁶ comparisons are needed. Also, a 14 aircraft scheduling problem was estimated to require approximately 180 seconds.
This brings up another crucial aspect of the scheduling problem. Since all aircraft currently in the system must be considered in scheduling optimization, the solution must be updated whenever another aircraft enters the system. This naturally increases the computational load.
There is a second, and extremely important aspect of the solution updating process. To be specific, the required transitions between the old and new solutions must be implementable. In other words, since aircraft are not point masses to be shifted about indiscrimi-nantly in the airspace, solution updates which require wholesale shifting from the current schedule must be avoided. Also, to be
avoided are solution updates which continually shift particular aircraft towards the end of the sequence.
1.2 Constrained Position Shifting (CPS) -- The Proposed Solution Methodology
The question now arises as to whether it is possible to utilize a decision-making process to improve system performance over first-come, first-serve which does not exhibit the undesirable characteristics discussed above. This research addresses itself to this question and answers it affirmatively with the introduction of a decision method-ology termed Constrained Position Shifting (CPS). In addition to
defining the CPS methodology, the research demonstrates its capabilities through an extensive computer simulation designed specifically to
compare the CPS system performance to that associated with the first-come, first-serve discipline. To summarize the results, CPS is observed to have the following characteristics and capabilities:
1) Increases the runway throughput rate
2) Treats individual aircraft equitably
3) Treats aircraft velocity classes equitably 4) Particularly successful during peak periods
5) Well within the capabilities of today's computers 6) The solution updating avoids "global" resequencing to
assist in implementation.
7) Flexible decision logic with the capability to accept time-varying objective functions and to handle emergency situations
8) Simple, practical, concept with the capability of assisting the controller's decision-making without usurping his autonomy.
Constrained Position Shifting is a decision methodology and not a one specific strategy. The CPS methodology is based on a fundamental underlying principle which, simply stated, involves the specification of a parameter which limits the maximum number of position shifts
(forward or rearward) that any aircraft will receive with respect to its first-come, first-serve position. As a consequence, the decision process is one of "local" rather than "global" optimization. Further-more, there is an inherent flexibility in the choice of objective functions within this "local" optimization which contributes to the methodology's success. The next section will present some simulation results for which the primary objective was taken as the maximization of runway throughput, with a secondary objective of minimizing the total aircraft delay.
1.3 Constrained Position Shifting -- Sample Simulation Results This section presents some sample simulation results from Chapters IV and V comparing the performance of CPS with a maximum position shift value of 4 with the first-come, first-serve discipline
(with respect to arrival at the runway), denoted as FCFSRW. The results from Chapter IV are for a single-runway, servicing arrivals only, with a common final approach of 5 nm and a constant minimum hori-zontal separation of 3 nm. Chapter V extends this single-runway,
arrivals-only situation to include heavy jets (with the associated increase in the minimum separation distance necessitated by the effect of wake vortices), and also departures. Complete results are presented in Chapters IV and V.
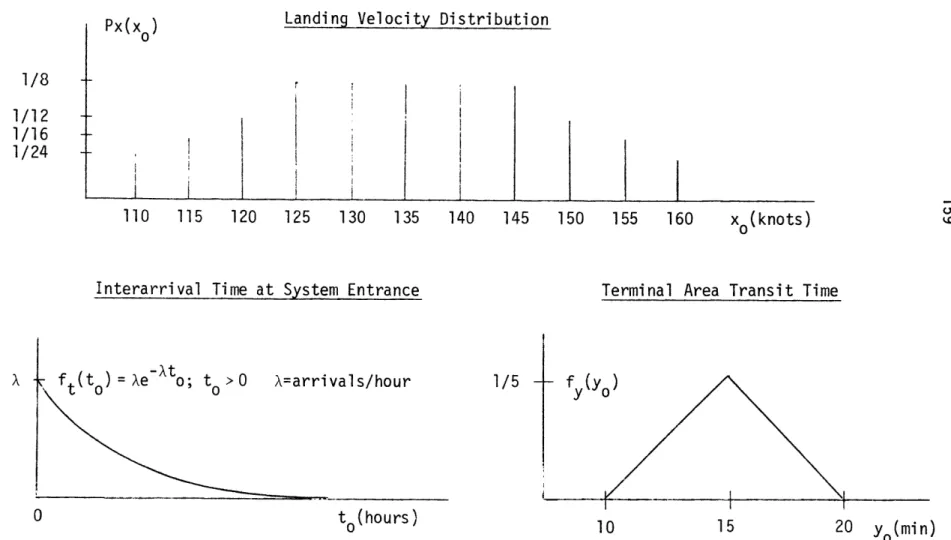
The Chapter IV simulation results presented here are for six runs of 500 aircraft from eleven velocity classes (in 5 knot intervals from
110 knots to 160 knots) with a class mix resulting in a come, first-serve saturation capacity of almost 41 aircraft per hour. The six runs have identical aircraft characteristics with the exception of the
aircraft interarrival time at system entrance (assumed to be exponential with average arrival rate,
X).
The average arrival rate increases from20 to 45 aircraft/hour in increments of five aircraft/hour.
Table 1.1 presents a summary of the six runs including the average and maximum delay as well as busy periods statistics counting the
and 40/hr runs are of primary interest, since the research is most concerned with the high-density terminal areas, especially during peak periods. The 45/hr run provides insights into the system
performance during periods of extreme congestion. The lower arrival rates (20, 25 and 30 aircraft/hr) are of lesser interest, since congestion is less acute, and consequently, so is the margin of possible improvement. Note, in Table 1.1, that the decrease in
average delay using CPS does not result in a large increase in maximum delay. In fact, the maximum delay is also decreased for the 40/hr and 45/hr runs.
24
Table 1.1
Sample Simulation Results
First-Come, First-Serve at the Runway (FCFSRW) vs.
Constrained Position Shifting (CPS) Maximum Number of Position Shifts = 4
500 Aircraft, 11 Classes
Arrival Rate (Aircraft/Hr)
20 40 Average FCFSRW 35.47 54.67 97.73 182.64 381.04 1688.62 Delay (Sec) CPS 34.23 50.75 86.63 152.64 299.74 956.72 Maximum FCFSRW 279.85 355.19 754.12 1057.90 1626.48 3751.84 Delay (Sec) CPS 437.65 515.23 896.37 1082.57 1584.06 2577.72 Number FCFSRW 102 91 77 61 24 5 of Busy Periods CPS 105 97 84 67 38 10 oumb r FCFSRW 229 284 339 386 452 491 craft CPS 225 271 327 375 432 485 Delayed _ _ _ _ _ _ _ _ _ _ _ _ _ _ _ _ _ -_ _ _ _
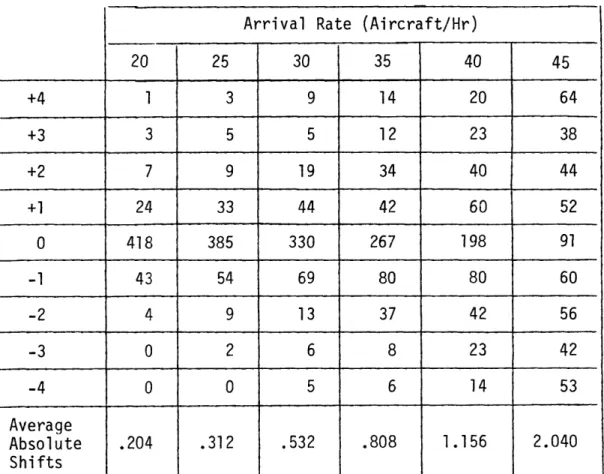
Table 1.2 presents the distribution of the position shifts from the first-come, first-serve base for the six runs. Note that the amount of shifting increases as the arrival rate increases and also that these shifts are not particularly extreme, even for the high arrival rate runs.
Table 1.2
Sample Simulation Results
Position Shifts from First-Come, First-Serve Maximum Number of Position Shifts = 4
500 Aircraft, 11 Classes
Arrival Rate (Aircraft/Hr)
20 25 30 35 40 45 +4 1 3 9 14 20 64 +3 3 5 5 12 23 38 +2 7 9 19 34 40 44 +1 24 33 44 42 60 52 0 418 385 330 267 198 91 -1 43 54 69 80 80 60 -2 4 9 13 37 42 56 -3 0 2 6 8 23 42 -4 0 0 5 6 14 53 Average Absolute .204 .312 .532 .808 1.156 2.040 Shifts
Tables 1.3, 1.4 and 1.5 break down the average and maximum delay statistics as well as the average position shifts from first-come, first-serve into the eleven velocity classes. The 35/hr, 40/hr and 45/hr runs are included. Although one must refrain from drawing
long-term statistical conclusions from one 500 aircraft run, it appears that CPS does not inherently bias particular aircraft classes.
Table 1.3 -- Sample Simulation Results
First-Come, First-Serve at the Runway (FCFSRW) vs.
Constrained Position Shifting (CPS) Maximum Number of Position Shifts = 4
Average Delay by Velocity Class -- 500 Aircraft
Arrival Rate 35/hr 40/hr 45/hr Land. # FCFSRW CPS FCFSRW CPS FCFSRW CPS Vel. FCSW _/c CS FFSW CS FFR P 110 20 265.4 232.5 469.1 469.3 1370.8 837.8 115 32 238.8 229.6 478.0 448.9 1840.3 1155.6 120 51 199.9 167.5 385.6 336.2 1753.9 1080.5 125 61 155.9 123.9 345.5 256.4 1660.8 1025.7 130 45 150.9 143.4 387.8 287.8 1742.0 1034.1 135 73 139.7 133.6 317.0 222.9 1544.3 832.2 140 58 218.8 163.1 411.2 313.3 1819.9 961.8 145 74 173.2 169.4 360.9 250.7 1694.4 865.7 150 48 218.3 186.9 409.6 349.9 1674.7 949.2 155 16 150.8 99.1 422.0 276.5 1700.8 860.1 160 22 149.1 173.5 342.9 280.3 1675.3 931.5
Table 1.4
Sample Simulation Results
First-Come, First-Serve at the Runway (FCFSRW) vs.
Constrained Position Shifting (CPS) Maximum Number of Position Shifts = 4
500 Aircraft
Comparison by Velocity Class Maximum Delay (Sec)
Arrival Rate 35/hr 40/hr 45/hr Land. a FCFSRW CPS FCFSRW CPS FCFSRW CPS Vel. a/c __ _ _ __ _ _ _ _ _ _ _ __ _ _ __ _ _ _ 110 20 797.3 789.8 1442.4 1433.6 3570.1 2429.6 115 32 1057.9 1082.6 1427.9 1459.9 3472.6 2248.5 120 51 967.7 981.8 1591.5 1451.9 3722.5 2312.8 125 61 887.7 1060.5 1443.9 1511.4 3630.4 2538.1 130 45 835.7 663.0 1478.3 1257.6 3E56.7 2339.2 135 73 1036.6 1061.2 1439.0 1471.0 3398.3 2284.8 140 58 949.0 942.9 1465.2 1385.7 3515.4 2448.6 145 74 800.4 562.8 1483.7 1249.3 3665.0 2035.2 150 48 1022.0 944.7 1474.3 1579.7 3548.5 2568.9 155 16 448.3 412.7 1149.5 983.1 3468.1 2170.0 160 22 984.3 943.2 1626.5 1584.1 3751.8 2577.7
28
Table 1.5
Sample Simulation Results
First-Come, First-Serve at the Runway (FCFSRW) vs.
Constrained Position Shifting (CPS) Maximum Number of Position Shifts = 4
500 Aircraft
Comparison by Velocity Class Average Position Shifts from FCFSRW
Arrival Rate Land. # Vel. a/c 35/hr 40/hr 45/hr 110 20 .100 .950 .150 115 32 .437 .656 1.312 120 51 0.000 .216 .863 125 61 -.016 -.066 .754 130 45 .244 .022 .556 135 73 .151 -.178 -.370 140 58 -.293 -.224 -.810 145 74 -.446 -.419 -.892 150 48 .042 .125 .021 155 16 -.250 -.375 -1.375 160 22 .682 .409 .045 Average Absolute .808 1.156 2.040 Shifts
Table 1.6 presents the same summary statistics as Table 1.1
for a Chapter V case which includes 12% heavy jets. Heavy jets require a larger minimum horizontal separation distance for additional safety. The assumed separations are 5 nm for conventional aircraft following heavy jets; 4 nm for heavy jets following heavy jets; and 3 nm for all aircraft following conventional aircraft. Because of the increased separation minimum, the saturation capacity is reduced approximately three aircraft per hour to 38/hour. Note that the system response
30
Table 1.6
Sample Simulation Results
First-Come, First-Serve at the Runway (FCFSRW) vs.
Constrained Position Shifting (CPS) Maximum Number of Position Shifts = 4
500 Aircraft, 12% Heavy Jets 11 Classes
Arrival Rate (Aircraft/Hr)
Average FCFSRW 60.61 108.48 166.47 356.52 1400.98 Delay (Sec) CPS 53.08 90.60 150.24 274.07 550.06 Maximum FCFSRW 500.98 699.38 963.14 1257.72 2457.36 Delay (Sec) CPS 585.90 863.83 1044.65 1421.68 1729.65 Number FCFSRW 93 82 58 33 2 of Busy Periods CPS 97 87 64 43 16 oum r FCFSRW 263 336 401 448 495 ceated CPS 257 323 391 430 477
As a final example, Table 1.7 summarizes the FCFSRW-CPS results with mixed operations (i.e., departures and arrivals), with an average departure rate equal to the average arrival rate. Three standard
departure routes (SIDs) are assumed, with a minimum departure-departure interval of 60 seconds for departures on different routes and 120
seconds for departures on the same route. The saturation throughput in this example is approximately 45.5 operations/hr.
Note that the CPS improvement in system performance over FCFSRW is even more significant when departures and arrivals are mixed. This improvement is due, in part, to the ability of the CPS methodology to insert departures between arrivals whenever advantageous.
Table 1.7
Sample Simulation Results
First-Come, First-Serve at the Runway (FCFSRW) vs.
Constrained Position Shifting (CPS) Maximum Number of Position Shifts = 4
500 Aircraft, 50% Departures 11 Classes - 3 Departure Routes
Arrival Rate (Aircraft/Hr)
Average FCFSRW 43.72 68.67 129.68 321.78 963.43 Delay (Sec) CPS 36.77 52.71 74.84 120.86 318.93 Maximum FCFSRW 326.71 366.21 648.82 972.26 2117.69 Delay (Sec) CPS 352.43 451.78 533.14 867.07 1190.27 Number FCFSRW 100 81 53 24 3 of Busy Periods CPS 114 97 77 56 24 oumbAr FCFSRW 283 342 398 460 495 craft CPS 263 318 362 408 459 D e aeDe lay e d__________________ ______________ _____________________ _____________________ ______________________________________________
1.4 Outline of the Remaining Chapters
This section outlines the remaining chapters of this dissertation, presenting an overview to the analytic investigation of the dynamic scheduling problem and to the subsequent demonstration, via simulation, of the Constrained Position Shift methodology. To begin, Chapter II, The Terminal Area Model, presents a description of the adopted terminal area model, focusing on the system assumptions, characteristics and constraints. A survey of research related to the dynamic scheduling problem will follow this model description. Basically, the model assumes that the Air
Traffic Control (ATC) system has capabilities consistent with the proposed up-graded third generation to be employed in the next decade. Further, the model is limited to operations on a single runway. The extension of Constrained Position Shifting to multiple runways and/or multiple airports is a logical direction for further research once an
intimate understanding of the single runway situation has been achieved. Chapter III, The Dynamic Scheduling of Arrivals, contains the analytic investigation into the dynamic scheduling problem. Initially, the dis-cussion focuses on the interarrival dynamics, i.e., the ramifications
of terminal area constraints on the minimum interarrival time between successively arriving aircraft. This minimum interarrival time is shown to be a function of the landing velocities of the preceding and following aircraft, the runway occupancy time of the preceding aircraft, the minimum horizontal separation distance between the aircraft and the length of the common final approach. The dynamic scheduling problem
is of interest as a direct consequence of the interactive nature of the minimum interarrival time separation, because if this separation did not depend on both the preceding and following aircraft characteristics,
any sequence would be as good as any other in terms of runway utilization. The discussion next presents a formal statement of the dynamic
scheduling problem, in the process defining two important optimality objectives, those of minimizing delay and maximizing throughput. An example is then presented which demonstrates that the solution to the dynamic scheduling problem is in general totally different for these two optimality objectives (and others as well).
Because of the randomness associated with the aircraft arrival process, the general solution to the dynamic scheduling problem is essentially unique. There is, however, an important sub-class to the general problem which possesses an analytic solution. This sub-class may be conceptualized by a holding stack of N aircraft, any one of which is a candidate for the first assignment. This problem will occur in practice during periods of extreme congestion. For the holding stack problem, the objective of maximizing throughput is observed to be equivalent to that of scheduling the last assigned aircraft to land as soon as possible (abbreviated ASAP). The ASAP problem is then viewed as a two-boundary problem, with initial and/or final constraints
corresponding to particular Oth and N+lst aircraft. The analytic solution to this ASAP problem is then obtained with none, one, and two-boundary
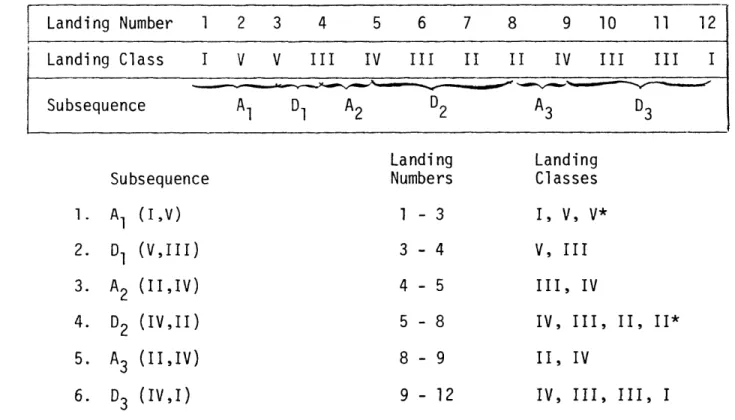
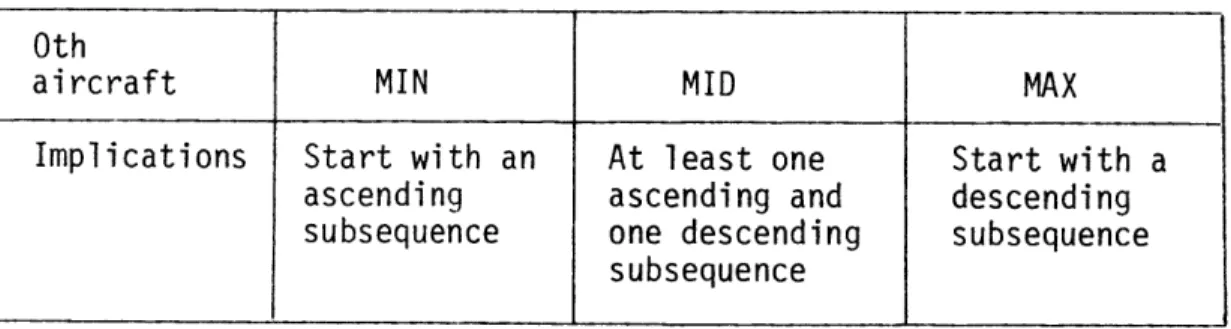
constraints. To summarize the solution characteristics, the general ASAP solution will be non-unique and depend only upon the rank order of the landing velocities, and not their actual magnitudes. It will be observed that the speed class sequencing concept does not maximize throughput. The solution will, however, be limited to a specific form which permits no more than two reversals in the "direction" (ascending
or descending) of the landing velocities. For instance, sequencing aircraft with landing velocities of 120, 135 and 150 knots in the order
135; 120; 150 is an example of a reversal in direction from descending (135 then 120) to ascending (120 then 150).
The N aircraft holding stack problem is also investigated employing the minimum delay objective. The subsequent analysis reveals that in general, the minimum delay solution is unique and dependent on the actual magnitude of the aircraft landing velocities. One particular
initial constraint problem is solved analytically. The solution turns out to be exactly the opposite of the speed class sequencing strategy.
In other words, the solution requires the aircraft to land in descending order rather than ascending order (as in speed class sequencing).
The analysis in Chapter III continues with an investigation into the general dynamic scheduling problem solution characteristics. The investigation reveals that "optimal" solutions contain inherent dis-advantages in the dynamic, real-world environment. Four of these undesirable characteristics are listed below.
1) Difficulty in "optimal" solution determination
2) Solution require instantaneous shifting in aircraft schedules which cannot be physically realized
3) Solution causes large disparity in service characteristics with particular classes receiving substantially poorer treatment 4) Inefficient peak period response possible.
Finally, Chapter III introduces the Constrained Position Shifting methodology, which is specifically designed to eliminate the undesirable characteristics listed above. As discussed in Section 1.2, the CPS
methodology establishes an upper bound on the maximum number of positions any aircraft will be shifted from its first-come, first-serve position.
The description focuses on the inherent flexibility within the CPS framework. To be specific, additional constraints may be placed on those sequences which satisfy the maximum position shift criteria to assist in implementation. These may include sequencing identical aircraft classes in a relative first-come, first-serve manner, and also delivering all final assignments at a given lead time, say ten minutes, prior to touchdown. Furthermore, the decision criteria to differentiate between feasible permutations may be any well defined function, even a time-varying one. In this manner, the system might, for example,
emphasize maximum throughput during peak periods and minimum cost during periods of less congestion.
Chapter IV, The Dynamic Scheduling of Arrivals, Simulation and Results, introduces the simulation which is designed to examine and
com-pare the system performance of various CPS strategies to first-come, first-serve. (Note that first-come, first-serve is actually a CPS strategy with the maximum number of shifts equal to 0.) Chapter IV has two parts. The first is a description of the simulation, that is, its purpose, capabilities and logic. The presentation and subsequent analysis of the single runway, arrivals-only results will follow.
Because of the great importance placed upon a comparative approach, the simulation has been designed to enable reproducibility. In other words, any particular system parameters, say the arrival rate or the
decision criteria may be adjusted, while keeping all other characteristics unchanged, including those that are randomly generated. This
repro-ducibility permits a systematic sensitivity analysis and also provides the system designer with the capability to answer important "what if" questions. Run time simulation inputs include the final approach length, the minimum horizontal separation, landing velocity distribution,
average arrival rate, number of aircraft to be generated, and the maximum number of position shifts (denoted as MPS).
Given this MPS value, the simulation simultaneously determines and compares all CPS strategies with maximum number of position shifts less than or equal to MPS. Currently, the simulation requires the ranking of three decision objectives at run time. These objectives correspond to 1) maximizing throughput, 2) minimizing total delay, and 3) minimizing the maximum delay. The secondary objective will break ties (if any) between feasible permutations with identical primary
objective values, while the third objective will be employed for further tie-breaking if necessary.
Chapter V, The Dynamic Scheduling of Aircraft-Extensions, treats two important extensions to the simulation, namely the inclusion of heavy jets and departures. Both extensions affect the minimum
time separation between successive operations. The heavy jets have an increased separation requirement, to diminish the dangerous effects of wake vortices. Departures naturally have different restrictions on runway and airspace operations.
Finally, Chapter VI, Conclusions and Directions for Further Research, summarizes the results and discusses such issues as the implementation of CPS and its extension to multiple runways and airports. It will be ob-served that the CPS methodology itself offers a simple, practical and flexible methodology for computer-assisted decision-making, although considerable research is required before safe and efficient terminal area service will be provided for the high-density terminal area of the future.
Chapter II
The Terminal Area Model 2.1 Introduction
This chapter presents a model of air traffic operations in the terminal area which includes the relevant system assumptions, charac-teristics, and constraints. The model attempts to be as realistic as possible without becoming so complex as to hinder the analytic investi-gation. Since the exact configuration of the ATC system for the 1980's
and later is still uncertain, the system model is chosen to be as flexible as possible, so as to be adaptable to a wide variety of configurations.
The initial research simplifies the usually complex terminal area by considering an area with a single airport with one runway accepting arrivals only. The analysis of this simplified situation is to be used as a building block in the general terminal area solution. Chapter V will extend the model to include departures as well. The postulated
assumptions, characteristics and constraints of the terminal area model are not restricted to the one-runway, arrivals-only case so that the extension of the research to the multiple airport, multiple runway, arrivals and departures case is natural, although considerably more complex.
In addition to the description of the terminal area model, this chapter will include a survey of the literature related to the research at hand.
2.2 The Model
2.2.1 Terminal Area Assumptions
There are three fundamental assumptions regarding the functional capabilities of the terminal area users. They are:
Assumption 1 -- All terminal area aircraft are capable of prompt and accurate communication with the ground-based control system; and the control system employs computers as decision-making aids.
Assumption 2 -- All terminal area aircraft have sufficient on-board instrumentation to provide accurate navigation.
Assumption 3 -- All system participants are cooperative.
These assumptions are purposely vague, due to the uncertainly of the exact configuration of the ATC system for the 1980's and beyond. As a consequence, emphasis has been placed on the functions performed and not on the specific instrumentation employed to satisfy these assumptions.
Assumptions 1 and 2 are nevertheless consistent with the current and anticipated state of the aviation industry and the intents of the Federal Aviation Administration (FAA). Prompt and accurate transmission of information under the up-graded third generation regime can be expected from the proposed Discrete Address Beacon System (DABS) when used in conjunction with the Advanced Radar Tracking System (ARTS). The requirement for accurate navigational capability may be satisfied by assuming all aircraft are equipped with (at least) two-dimensional
Area Navigation (RNAV). Only two-dimensional RNAV is needed if Assumption 1 holds, because the controller can issue altitude and
heading commands which essentially provide four-dimensional navigation. It would seem, initially, that Assumption 3 is not a controversial one. It postulates that pilots will communicate their desires and intentions to the terminal area controller and also that all control commands will be followed. However, if the commands are either too
numerous, unsafe, or difficult to follow, total cooperation and communi-cation will be a major problem. Only when the full system configuration
is specified will it be possible to evaluate such parameters as
frequency of commands and degree of difficulty for command implementation. So as not to hinder this research, it will be assumed that all commands generated by the controller are safe and implementable. The problem of
implementation will not be ignored, rather it will be postponed until the characteristics of the problem solutions are better understood. Chapter VI will discuss this issue further.
2.2.2 Terminal Area Characteristics
The terminal area characteristics differ from the assumptions in that the characteristics are merely representative of the future system configuration, whereas the assumptions are crucial to the basic analysis.
In other words, modification of any of the characteristics will not alter the basic research philosophy. For instance, the terminal area size or the length of the common final approach may vary without
affecting the underlying research methodology. Flexibility is stressed here, so that the conclusions can be applicable in the context of a wide range of possible system configurations. These characteristics are:
Characteristic 1 -- The Terminal Area
The terminal area is a loosely defined, cylindrically-shaped region with a radius of approximately 50 nautical miles centered about major
airports. The altitude limit may be of the order of 10,000 feet. The terminal area is actually limited by the range of the radar and communi-cation coverage. More than one major airport as well as any number of minor airports may be within the same terminal area.
Each runway is assumed to be equipped with a landing system requiring a common final approach of F nautical miles. As will be seen in
Section 3.2, the value of F affects the overall system efficiency. Characteristic 2 -- Aircraft Characteristics
All aircraft types are assumed to exist in the terminal area provided, of course, that they are suitably equipped to satisfy Assumptions 1 and 2. Landing velocities are assumed to fall within a natural range,
(Vland (min), Vland(max)), while the terminal area entrance velocities are assumed to be within a different natural range, (Vent (min), V ent(max)), consistent with aircraft capabilities and ATC procedures. Representative values might be Vland (min)= 80 knots, V land(max)=180 knots, V ent=110 knots, Vent(max) = 300 knots. The aircraft are further assumed to fly the final approach at a constant velocity (equal to the landing velocity).
Characteristic 3 -- Pilot Objectives
It is assumed that pilots desire to either a) land in the terminal area; b) depart from the terminal area; or c) fly through the terminal area. In other words, no pleasure flying is permitted. This charac-teristic provides the motivation for the functional outlook of this research as discussed in Section 2.2.3.
Characteristic 4 -- Terminal Area Constraints
There exist two basic constraints on the operation of aircraft in the terminal area. The motivation for both constraints is safety. Together, they define the minimum time separation between successively
landing aircraft on a given runway, which is derived in Section 3.2. These constraints are:
1. No two arriving aircraft are permitted on the same runway at the same time.
2. Coaltitudinal aircraft under ground control must maintain a specified horizontal separation distance. Currently, this separation equals 5 nm for conventional aircraft following "heavy" jets (in excess of 300,000 lbs), 4 nm for heavy jets following heavy jets and 3 nm for
all aircraft following conventional aircraft. Light aircraft (less than 12,000 lbs) require an additional separation, but they are not assumed in the aircraft mix at the major airports.
2.2.3 System Objectives
What is the purpose of terminal area air traffic control? Whom does it serve? How are decisions made? These questions must be answered in a general sense. Essentially, a terminal area air traffic
control system should provide safe and efficient service for its users. But since it is impossible to please all users all the time, the
system objective should probably be to provide as many users as much satisfaction as possible. Now, what constitutes user satisfaction? Does the user wish to minimize his delay, costs, overall comfort, or some other objective? The attitude taken in this research stems from the functional outlook of the system characteristics, specifically, all users are assumed to be in the system for a purpose: to land, depart, or fly through the terminal area. Thus, the system objective is the safe and expeditious fulfillment of each user's purpose.
2.3 Review of Related Research
This section presents a review of the research related to the dynamic scheduling problem. On the whole, there has not been much research which is directly related to this topic, primarily due to the requirement for a ground-based computer to be employed in the efficient sequencing and scheduling of aircraft, which is a capability that will not be widely available for perhaps another decade. Actually, Blumstein [3] in 1960 was the first to point out the importance of the common final approach in the determination of runway capacity. Other runway capacity related studies include that of Odoni [21] and Hockaday and Kanafani [13].
Runway capacity under saturation conditions (i.e., where aircraft are always available to land) is shown to be dependent on the aircraft mix and the sequencing strategy employed. Although upper bounds on the runway utilization rate have been obtained for various strategies in
[13], the saturation condition assumption does not address the dynamic scheduling problem where aircraft randomly enter the terminal and the controller must decide on the order in which to sequence the arrivals.
The bulk of the research which attacks the problem of randomly arriving aircraft tends to de-emphasize the importance of the runway in
their formulation. This typically occurs for one of two reasons. Either no velocity mix is assumed or else a first-come, first-serve discipline is assumed.
Porter, [25], Athans and Porter, [1], Sarris, [27], and Athans and Sarris [20], investigate methods for the automatic control of aircraft arriving in a random fashion from the en-route centers to
the near terminal area. Porter, [25], and Athans and Porter, [1], employ a linear, optimal, feedback control system that merges aircraft from several feeder guideways into a single string on final approach. A velocity mix is not assumed. The major contribution of this work is
the analytic investigation of delay maneuvers other than placing
aircraft in holding stacks. Sarris, [27], and Athans and Sarris, [28], attack the same control problem assuming a velocity mix. However, the minimum time separation between successively landing aircraft is not taken as a function of aircraft landing velocity and no attention is devoted to efficient sequencing strategies.
Tobias, [33], assumes a terminal area having fixed multiple approach paths with intersecting nodes. He presents a general scheduling algorithm such that the aircraft are conflict-free at each node. For this problem, a first-come, first-served strategy is assumed and the computational load appears to be excessive.
Schmidt and Swaim, [29], address the problem of the curved approach path and landing sequence specifications for a group of aircraft desiring
to land in a terminal area. The multiple-aircraft landing problem is
formulated as a set of disconnected optimal trajectories and the performance criterion for the system is the sum of flight durations plus the integrated weighted accelerations of the aircraft. However, as with Sarris [27], the minimum time separation between successively landing aircraft is not
taken to be a function of aircraft landing velocities and sequencing strategies are not investigated.
There have been a few reports which do consider the sequencing problem in the dynamic environment. As discussed in Chapter I, the MITRE Corporation report [14] investigates the merits of speed class sequencing, with negative conclusions. The primary drawback was noted to be the priority structure of the strategy, which tended to create huge delays for particular aircraft and aircraft classes.
The work of Pardee [22] is of interest. He defined an interesting dynamic programming formulation of the scheduling problem, which is equivalent to the dynamic scheduling formulation in Chapter III.
However, his analysis of the problem is on a "global" scale, and as a consequence, the computational requirements became prohibitive and the detrimental priority structure still exists (as will be shown in Chapter
III).
The formulation of the National Bureau of Standards report [19] is also of interest, and many of the observations are quite similar to those developed in this thesis. This report, however, also restricts itself to "global" solutions and does not investigate the detrimental priority structure.
Forys, et al., [10], also consider a scheduling problem similar to that of this research. The major difference between the two problems is the time-scale. Forys et al. assume the existence of a book schedule which is a set of known arrival times for air carriers. Delays are
taken as deviations from the book schedule rather than deviations from the preferred landing times (that are calculated when aircraft enter the terminal area). This de-emphasizes the dynamic nature of the terminal area. Furthermore, scheduling is done only for aircraft contained in the book schedule. Consequently, the efficiency of all terminal area operations is not the research objective.
Perhaps the research that is most closely related to this report is that of Straeter, Park and Hogge, [23], [24] and [31]. Three
aircraft classes fly on nominal approach routes and a weighted minimum delay solution is obtained. A simulation demonstrates the improvement in system performance. Their research differs from this thesis in a number of respects. First, the base discipline is come, first-serve at the outer marker instead of at the runway, and the separation matrix is incorrectly determined. Also, the solution is of the "global" nature, which, as previously stated, will result in priority and computa-tional problems. These effects, however, are not that extreme in this highly structured, three aircraft class problem.
Finally, one elementary, practical approach at computer-assisted sequencing has recently come to this author's attention. The efforts are described by Bonny [4] of the Royal Radar Establishment in which a computer is employed to assist in the approach sequencing task at London's Heathrow Airport. It is felt that this type of experimental work is heading in the right direction, especially with regard to
Chapter III
The Dynamic Scheduling of Arrivals
3.1 Introduction
This chapter contains the mathematical analysis of the dynamic scheduling problem. To begin, Section 3.2 investigates the minimum
interarrival time separation at the runway between successively arriving aircraft as a function of the landing velocities of the preceding and following aircraft, the horizontal separation minimum between the aircraft and the final approach length. The subsequent analysis in Chapter III will assume that the horizontal separation minimum is constant, an assumption which results in a well-structured interarrival time separation matrix. Section 3.3 then discusses some of the sequencing considerations that confront the controller. Specifically, a distinction will be drawn between two "natural" first-come, first-serve disciplines, i.e., with respect to time of system entrance and time of arrival at the runway. Next, Section 3.4 presents a formulation of the dynamic
scheduling problem, emphasizing the difference between the static and dynamic solutions and also noting the sensitivity of the solution to the particular objective function adopted. This section also defines the N aircraft holding stack problem with initial and/or final constraints whose analysis for decision objectives of maximum throughput and minimum delay provide the primary insights into the general dynamic scheduling solution characteristics. Section 3.5 is devoted to the problem solution with the maximum throughput objective, whereas Section 3.6 attacks the
50
minimum delay problem. The solution characteristics uncovered in these two sections will be shown to be undesirable primarily for reasons of computational difficulty and inequitable service characteristics. Finally, Section 3.7 introduces the proposed solution methodology,
termed Constrained Position Shifting (CPS). CPS is motivated by the desire to eliminate the undesirable solution characteristics uncovered in Sections 3.5 and 3.6.