HAL Id: insu-01253286
https://hal-insu.archives-ouvertes.fr/insu-01253286
Submitted on 6 Sep 2020
HAL is a multi-disciplinary open access
archive for the deposit and dissemination of
sci-entific research documents, whether they are
pub-lished or not. The documents may come from
teaching and research institutions in France or
abroad, or from public or private research centers.
L’archive ouverte pluridisciplinaire HAL, est
destinée au dépôt et à la diffusion de documents
scientifiques de niveau recherche, publiés ou non,
émanant des établissements d’enseignement et de
recherche français ou étrangers, des laboratoires
publics ou privés.
radiation by Voyager 1/UVS in 1993-2003
Olga Katushkina, Eric Quémerais, V. V. Izmodenov, D. B. Alexashov, Bill R.
Sandel
To cite this version:
Olga Katushkina, Eric Quémerais, V. V. Izmodenov, D. B. Alexashov, Bill R. Sandel. Remote
diag-nostic of the hydrogen wall through measurements of the backscattered solar Lyman alpha radiation by
Voyager 1/UVS in 1993-2003. Journal of Geophysical Research Space Physics, American Geophysical
Union/Wiley, 2016, 121 (1), pp.93-102. �10.1002/2015JA022062�. �insu-01253286�
Journal of Geophysical Research: Space Physics
Remote diagnostic of the hydrogen wall through
measurements of the backscattered solar
Lyman alpha radiation by Voyager
1/UVS in 1993–2003
O. A. Katushkina1,2, E. Quémerais2, V. V. Izmodenov1,3,4, D. B. Alexashov1,4, and B. R. Sandel5
1Space Research Institute of Russian Academy of Sciences, Moscow, Russia,2LATMOS, Université Versailles Saint-Quentin, Guyancourt, France,3Department of Mechanics and Mathematics, Lomonosov Moscow State University, Moscow, Russia, 4Institute for Problems in Mechanics, Moscow, Russia,5Lunar and Planetary Laboratory, University of Arizona, Tucson, Arizona, USA
Abstract
We perform a new analysis of the Lyman alpha data obtained by Voyager 1 during the spatial scans in 1993–2003 while Voyager 1 was at 53–88 AU from the Sun. These data are the important source of information on the hydrogen distribution in the outer heliosphere. A sophisticated global kinetic-MHD model of the heliospheric interface and a radiative transfer model are used for the analysis. It is shown for the first time that the ratio of the Lyman alpha intensities detected in the downwind and upwind lines of sight in the outer heliosphere is sensitive to the configuration (peak value and location) of the hydrogen wall. The hydrogen wall is a source of Doppler-shifted backscattered Lyman alpha photons, so it can be seen from inside the heliosphere. Therefore, Voyager 1/ultraviolet spectrometer (UVS) Lyman alpha data can be used for remote sensing of the hydrogen wall. We show that our current global model of the outer heliosphere, which is consistent with many other measurements including Lyman alpha data from both Voyager 1 and 2 in 1980–1993, provides a systematically larger downwind to upwind intensity ratio compared with the UVS data in 1993–2003. In order to decrease the ratio, a higher and/or closer hydrogen wall is needed.1. Introduction
The Sun moves through the surrounding partially ionized local interstellar medium (LISM). Interstellar hydrogen (H) atoms penetrate deeply into the heliosphere due to their large mean free path with respect to a charge exchange with protons. In the heliosphere H atoms scatter the solar Lyman alpha radiation (wavelength at the line center is𝜆0= 1215.6 Å). Measurements of the interplanetary Lyman alpha glow in the
end of 1960s provided a first experimental evidence of the interstellar wind phenomenon [Thomas and Krassa, 1971; Bertaux and Blamont, 1971]. The intensity and spectral characteristics of the backscattered radiation are determined by the spatial and velocity distributions of interstellar hydrogen in the heliosphere. This distri-bution in turn depends on the properties and structure of the heliospheric interface (region of interaction between the solar wind (SW) and interstellar medium), because charge exchange with protons in this region modifies the original interstellar H distribution. The significance of charge exchange in the outer heliosphere was mentioned by Wallis [1975] for the first time. Primary interstellar H atoms are filtered in the heliospheric interface [see, e.g., Izmodenov et al., 1999; Izmodenov, 2007], and new secondary interstellar atoms are created by charge exchange. Therefore, measurements of backscattered solar Lyman alpha radiation in the helio-sphere can be used as a remote sensing diagnostic of the interstellar H distribution as well as the properties of the heliospheric boundary [see, e.g., Bertaux et al., 1985; Hall et al., 1993; Clarke et al., 1998; Costa et al., 1999;
Gangopadhyay et al., 2006; Vincent et al., 2014].
Backscattered Lyman alpha radiation has been measured in the heliosphere since the beginning of the space age (see, e.g., for review Quémerais [2006]). Nowadays, Lyman alpha is measured by many instruments at the Earth orbit, e.g., SOHO/Solar Wind ANisotropy [Bertaux et al., 1995] and Hubble Space Telescope/Space Telescope Imaging Spectrograph [Woodgate et al., 1998]; closer to the Sun, e.g., around Mercury by Mercury Atmospheric and Surface Composition Spectrometer on board MErcury Surface, Space ENvironment, GEochemistry, and Ranging [McClintock and Lankton, 2007]; and in the outer heliosphere— Cassini/Ultraviolet Imaging Spectrograph [Esposito et al., 2004], New Horizons/Alice [Gladstone et al., 2013], and Voyager 1/
RESEARCH ARTICLE
10.1002/2015JA022062
Key Points:
• We have studied the Lyman alpha intensities measured by Voyager 1/UVS from 1993 to 2003 • These data are sensitive to the peak
value and position of the H wall • It is shown that larger and closer
H wall is needed to explain the data
Correspondence to:
O. A. Katushkina, okat@iki.rssi.ru
Citation:
Katushkina, O. A., E. Quémerais, V. V. Izmodenov, D. B. Alexashov, and B. R. Sandel (2016), Remote diagnostic of the hydrogen wall through measurements of the backscattered solar Lyman alpha radiation by Voyager 1/UVS in 1993–2003, J. Geophys. Res. Space Physics, 121, 93–102, doi:10.1002/2015JA022062.
Received 21 OCT 2015 Accepted 1 JAN 2016
Accepted article online 8 JAN 2016 Published online 30 JAN 2016
©2016. American Geophysical Union. All Rights Reserved.
ultraviolet spectrometer (UVS) [Broadfoot et al., 1977]. These data are described and analyzed by many authors [e.g., Bertaux et al., 1997; Quémerais et al., 2008; Clarke et al., 1998; Vincent et al., 2014; Quémerais et al., 2014;
Pryor et al., 2008; Gladstone et al., 2013; Lallement et al., 2011].
The most interesting feature of interstellar H distribution in the heliospheric interface is the hydrogen wall. The hydrogen wall is a region of an increased number density of secondary interstellar H atoms around the heliopause (contact discontinuity separating the solar wind plasma from the charged component of the interstellar plasma). This phenomenon was predicted theoretically for the first time by Baranov et al. [1991] and then it was discovered experimentally by Linsky and Wood [1996] in measurements of the Lyman alpha absorption spectra toward alpha Centauri. The configuration of the H wall (its position, height, and width) depends both on parameters of the local interstellar medium (e.g., number densities of H atoms and protons) and plasma properties in the heliospheric interface (efficiency of charge exchange near the heliopause). Theoretically, the H wall should be a visible source of backscattered Lyman alpha radiation for an observer looking close to the upwind direction and located far enough (further than 40–50 AU) from the Sun, where emission from the H wall becomes not negligible compared with the heliospheric emission. Inside the H wall secondary H atoms have a small projection of velocity on the upwind direction, because they are created via charge exchange with protons from the decelerated interstellar plasma. Such atoms can scatter only Lyman alpha photons with a wavelength close to the line center𝜆0. Therefore, wavelength of backscattered photons coming from the H wall is also close to𝜆0. But inside the heliosphere typical interstellar, H atoms have bulk velocity ∼15–30 km/s along the downwind direction, and hence, these atoms cannot absorb Lyman alpha photons backscattered from the H wall with wavelength𝜆0. Therefore, such photons can survive in the
helio-sphere and reach the observer. Thus, measurements of Lyman alpha intensities in the outer heliohelio-sphere for lines of sight (LOS) crossing the heliopause can provide information about the H wall.
One of the most important space missions for the investigation of the heliospheric boundary is Voyager 1/2 launched in 1977. Both Voyager 1 and 2 are equipped with ultraviolet spectrometers—UVSs [Broadfoot et al., 1977], but the UVS on board Voyager 2 was switched off in 1998, while UVS on board Voyager 1 still operates. Voyager 1 and 2 are the most distant currently active spacecraft from the Sun, and their measurements of backscattered Lyman alpha glow in the outer heliosphere should be an effective tool for remote sensing of the H wall. This is a particularly important topic now because Voyager 1 approaches the heliospheric boundary and whether it crossed the heliopause or not is extensively discussed [Stone et al., 2013; Gurnett et al., 2013;
Burlaga and Ness, 2014; Fisk and Gloeckler, 2014; Gloeckler and Fisk, 2015].
Previously, the Voyager 1 and 2/UVS data were analyzed in various works [Hall et al., 1993; Quémerais et al., 1995, 1996a, 2003, 2010; Ben-Jaffel et al., 2000; Pryor et al., 2008; Fayock et al., 2013, 2015]. However, none of these works were devoted to studying the entire interval of the scanning observations of Voyager 1/UVS, which were performed from 1993 to 2003. Lallement et al. [2011] have considered all scan data, but they were focused on detection of the galactic background and did not analyze details of the heliospheric emission. In this work we analyze the heliospheric scans data by using our numerical models of the hydrogen distribution and radiative transfer in the heliosphere. It is shown that the ratio of Lyman alpha intensities measured at the lines of sight in the “tail” and “nose” parts of the heliosphere is sensitive to location and height of the hydrogen wall.
2. Lyman Alpha Intensities Measured by Voyager 1/UVS From 1993 to 2003
Here we consider 10 years (from 1993 to 2003) of Lyman alpha measurements by Voyager 1/UVS performed at 53–88 AU from the Sun. During this period specific scans of the sky from the tail to nose parts of the helio-sphere were performed (these data are described in detail by Quémerais et al. [2003, 2009]). Originally, these observations were dedicated to searching for any inhomogeneous features in the hydrogen distribution in the outer heliosphere. Quémerais et al. [1995, 1996a] reported that these data show an excess of intensity (10–15 R) in the upwind direction compared with the radiative transfer model results for both uniform hydro-gen distribution in the outer heliosphere taken from the hot model [see, e.g., Fahr, 1971] and nonuniform distribution with the H wall taken from Baranov-Malama model of the heliospheric interface [Baranov and
Malama, 1993]. Two possible explanations of this excess were discussed: it is caused either by emission from
the H wall or by the galactic Lyman alpha background. Quémerais et al. [2010] obtained quite large additional intensity in the upwind direction (even larger than in the data) by using full 3-D radiative transfer calcula-tions based on results of kinetic-MHD model of the heliospheric interface [Izmodenov et al., 2009]. Therefore,
Journal of Geophysical Research: Space Physics
10.1002/2015JA022062
Figure 1. Full-sky map of the Lyman alpha intensities as seen by Voyager 1 in 1993.3 located at 53 AU from the Sun.
White crosses show position of the scan plane of Voyager 1/UVS observations in 1993–2003. Positions of the Sun and upwind directions are shown by arrows. Two pointsP1andP2show two considered directions (see text).
they reported that Voyager data show an emission from the H wall. However, it was later found that this addi-tional intensity in the model arose from a numerical problem in the radiative transfer code. Lallement et al. [2011] have performed an accurate analysis of the data and showed that there is a correlation between excess Lyman alpha intensities in the nose part of the heliosphere and galactic H-alpha emission. They concluded that some portion of the Voyager 1 and 2/UVS Lyman alpha signal near the galactic plane arises from the galac-tic background estimated at several Rayleighs. It was the first discovery of the galacgalac-tic Lyman alpha emission in the heliosphere. Thus, previous analyses of the Voyager 1/UVS scans (1993–2003) did not show any clear evidence of the backscattered emission from the H wall, because it was combined with the galactic Lyman alpha component.
The Voyager 1/UVS Lyman alpha brightness measurements used in our work were obtained in the same manner as described in Quémerais et al. [1995]. At the current position of the Voyager 1 spacecraft, the Lyman alpha line is the only heliospheric emission that can still be observed. The instrument is a grating spectrom-eter with a band pass covering 50 nm to 160 nm with a resolution element (sampling) of about 1 nm per pixel. Lyman alpha counts are spread over nine channels (9 nm resolution). During processing all known background contributions are removed following the scheme developed by J. B. Holberg and R. Watkins (Voyager Ultraviolet Spectrometer Guest Observer and Data Analysis Handbook, Version 1.1, unpublished data, 1992). Radioactive thermal generator and cosmic rays and instrumental dark counts are removed using dark plate observations. Stellar contributions including the physical background from beyond the heliosphere are removed by subtracting the background on both sides of the Lyman alpha line. The remaining spectra only show counts at the position of the H Lyman alpha line which demonstrates that all background con-tamination has been removed. The background removal is taken into account when measurement errors are calculated by error propagations.
In this work we excluded from the analysis those lines of sight which contain a galactic component according to results of Lallement et al. [2011]. From 1993 to 2003 Voyager 1/UVS performed scans over the sky in four different planes. We consider here only the first scan family (“A” in notations of Lallement et al. [2011]), because it is close to the upwind-downwind direction and covers the longest period of time.
Figure 1 shows an example of the full-sky map in Lyman alpha intensity obtained in the model for an observer located at 53 AU from the Sun at the nose part of the heliosphere (ecliptic latitude 33.7∘ and longitude 246∘; this observer’s position corresponds to Voyager 1 location during the first scan in 1993; the upwind direction marked in Figure 1 corresponds to interstellar helium flow direction obtained by Witte [2004]). The maximum of intensity close to the downwind direction corresponds to the position of the Sun (bright source of Lyman alpha photons). In the opposite direction there is a minimum of intensity (in the nose part of the heliosphere close to the upwind). The position of the Voyager 1 scan plane is shown by crosses in Figure 1. The scans started close to the maximum of intensity in the downwind direction and roughly followed a great circle passing through the upwind direction.
Figure 2 presents an example of Voyager 1/UVS data during one scan at the end of 1994. The scan angle𝛼 is counted from the point nearest the Sun, i.e., the intensity is maximum for𝛼 = 0∘ and minimum for 𝛼 = 129∘ in accordance with the intensity map shown in Figure 1. The last portion of the scan (for𝛼 ≥ 168∘) includes
Figure 2. Example of the Voyager 1/UVS scan data obtained in 1994.9: count rate with statistical uncertainties as a
function of scan angle𝛼. Two chosen directionsP1(𝛼 = 22∘) andP2(𝛼 = 129∘) are also shown. The grey area for
𝛼 ≥ 168∘corresponds to the part of the data that can be partially influenced by galactic emission [see Lallement et al., 2011]. These data points are excluded from the current analysis.
galactic emission as is shown by Lallement et al. [2011]. We exclude this part of all scans from the analysis to avoid any possible misinterpretations.
The most interesting information that could be obtained from the scans is the ratio of intensities in the tail and nose parts of the heliosphere. Such a ratio is independent of the absolute calibration of the instrument as well as of the global 11 year variations of the solar Lyman alpha flux, because data for one scan are obtained during a short time period (about 10 days). Only short term (27 days) variations of the solar flux may influence the ratio [Pryor et al., 2008; Quémerais et al., 1996b]. We have chosen two directions at each scan correspond-ing to the tail and nose parts of the heliosphere (see marks P1and P2in Figures 1 and 2). The second point
(P2,𝛼 = 129∘) corresponds to the minimum of intensity, and this direction is separated by about 60∘ from the
upwind direction. The first point (P1,𝛼 = 22∘) is close to the Sun. We do not consider the closest direction
to the Sun (for𝛼 = 0∘) because hydrogen distribution in the vicinity of the Sun is strongly affected by solar radiation and ionization that is a potential source of additional uncertainties in the modeling. Lyman alpha signal for both chosen directions is not contaminated by galactic emission, because they are quite far from the galactic plane. We introduce the following notation: intensity in the direction P1is Itail, intensity in direction
P2is Inose, and their ratio is R = Itail∕Inose(hereafter, by mentioning “ratio” we mean this ratio).
3. Data Analysis: Role of the H Wall
Numerical simulations of the Voyager 1/UVS data for 40 scans in 1993–2003 are performed in the frame of the following procedure: (1) the hydrogen distribution (for primary and secondary interstellar atoms
Table 1. Model Parameters and Results
No. nH,LISMa(cm−3) n p,LISMb(cm−3) n H,r=90c(cm−3) r TS,V1 d(AU) r TS,V2 e(AU) Model 1 0.14 0.04 0.093 97.5 87.5 Model 2 0.18 0.06 0.119 83.2 77.7 Model 3 0.2 0.1 0.145 69.2 66.9
aNumber density of H atoms in the undisturbed LISM. bNumber density of protons in the undisturbed LISM.
cNumber density of H atoms at distance 90 AU from the Sun in the upwind direction. dDistance to the termination shock at Voyager 1 direction.
Journal of Geophysical Research: Space Physics
10.1002/2015JA022062
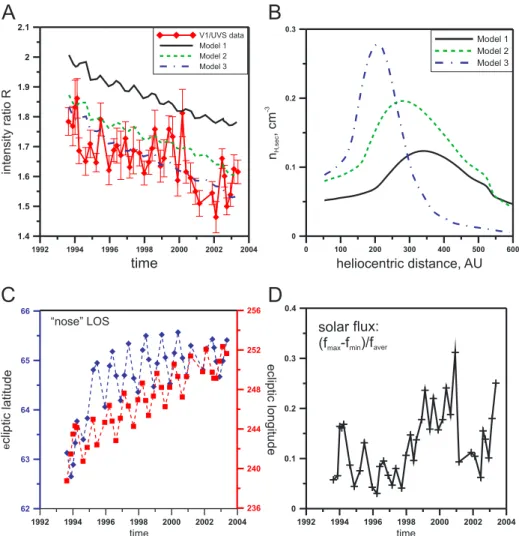
Figure 3. (a) Ratio of Lyman alpha intensitiesR = Itail∕Inoseas a function of time along Voyager 1 trajectory in
1993–2003. Measurements are compared to the results of three models (see Table 1 for model parameters). (b) Number density of the secondary interstellar atoms as a function of heliocentric distance along nose direction corresponding to
𝛼 = 129∘. This is an illustration of different H walls as a result of the three models considered. (c) Regular changes of direction (ecliptic longitude and latitude) of the nose LOS. (d) Relative variations of the solar Lyman alpha flux during 27 days: difference between maximum and minimum fluxes divided by averaged flux (data are taken from LASP database).
separately) is taken from results of the global 3-D stationary kinetic-MHD model of the SW/LISM interaction [Izmodenov and Alexashov, 2015] and (2) the solar Lyman alpha radiation backscattered by H atoms is cal-culated with the radiative transfer code developed by Quémerais [2000]. We use results of the full global heliospheric model (mentioned as Model 3 in Izmodenov and Alexashov [2015]). This model takes into account both heliospheric and interstellar magnetic fields, heliolatitudinal variations of the solar wind param-eters, and kinetic description for hydrogen atoms. Previously, Quémerais et al. [2013] have shown that the time-dependent axisymmetrical version of used heliospheric model represents the UVS data from both Voyager 1 and 2 in 1980–1993 quite well. Multiple scattering of Lyman alpha photons is included and dom-inates the intensities for the observer’s positions considered here (53–88 AU from the Sun). We take into account actual positions of the spacecraft and directions of the line of sight (LOS). Model calculations are performed with three sets of the LISM number densities of H atoms and protons (see Table 1). All these sets correspond to the LISM ionization degree ∼ 20–30% that is consistent with available astronomical constraints [Slavin and Frish, 2008].
Figure 3a presents the ratio R of the tail to nose intensities taken from measurements and results of the numerical modeling. Local variations of the ratio in the data curve are caused by two factors. First, regular changes of directions of the lines of sight (see Figure 3c) produce small modulations of the ratio seen for the model results as well. Second, larger variations of the ratio seen for the Voyager data (e.g., peaks in 1994 and 1999–2001) are connected with longitudinal anisotropy of the solar Lyman alpha flux.
Figure 4. Results of test calculations illustrate an influence of the H wall’s (a and b) height and (c and d) position. In
Figure 4a three examples of the H wall based on Model 1 results (solid curve corresponds to results of Model 1, dashed curve corresponds to the same but with the H wall artificially increased by 2 times, and dash-dotted curve corresponds to Model 1 without H wall; i.e., the hydrogen number density is assumed to be constant where the H wall would be). In Figure 4b ratios of the Lyman alpha intensities obtained with the hydrogen distributions presented in Figure 4a. In Figure 4c two examples of the H wall: the solid curve shows results of Model 3, while the dashed curve corresponds to the same model but with the H wall artificially moved away from the Sun by a factor of 1.6. In Figure 4d ratios of the Lyman alpha intensities obtained with the hydrogen distributions presented in Figure 4c.
Backscattered intensities measured by Voyager are influenced by anisotropies of the solar flux, especially for the tail direction, which is toward the Sun. Although multiple scattering effects tend to spread the origin point of the photons all over the surface of the Sun, the contribution of different areas of the Sun is not com-pletely uniform. This effect was estimated by Quémerais et al. [1996b] in the case of the hydrogen distribution obtained with the hot model. Thus, anisotropies of the solar illuminating flux still affect the tail to nose ratio. Figure 3d shows relative differences between maximum and minimum solar fluxes obtained from 27 day measurements at the Earth orbit [Woods et al., 2000; Laboratory for Atmospheric and Space Physics (LASP) database, http://lasp.colorado.edu/lisird/lya/]. It is seen that the solar flux varies by 5–30% and periods of maximum amplitude correlate with peaks of the Lyman alpha ratio R. These variations are neglected in the model, because they are rather small (variations of R are less than 15%) and do not influence the results. The first considered set of the LISM number densities (our Model 1) corresponds to the model presented in
Izmodenov and Alexashov [2015] (they called this model as “model 3”). They provided the reasons and strategy
for choosing such number densities to make model results consistent with several observational constrains. However, Figure 3a shows that Model 1 gives a systematically larger ratio of the Lyman alpha intensities compared with the Voyager 1/UVS data. Two additional calculations (Models 2 and 3) with different LISM
Journal of Geophysical Research: Space Physics
10.1002/2015JA022062
Figure 5. (a) Qualitative explanation of the effect of the H wall’s height on the Lyman alpha intensity ratio. The
termination shock (TS), heliopause (HP), and H wall are shown. An observer (V1) is looking in two directions (tail and nose), and the Lyman alpha intensity in the nose direction depends on local emissivity from the H wall, which in turn depends on the H number density in the wall. (b) Two H walls are shown. Local emissivity of backscattered Lyman alpha from the H wall depends on the local solar Lyman alpha flux, which is proportional to1∕r2. That is why a more distant H wall produces fewer backscattered photons.
parameters show that increasing the LISM hydrogen and proton number densities leads to a decrease of the ratio. Model 3 provides a quite good agreement of the ratio with Voyager 1 observations.
The most important difference in the hydrogen distributions between the three considered models is peak value (“height”) and location of the hydrogen wall. Figure 3b shows number densities of the secondary inter-stellar H atoms along the LOS corresponding to𝛼 = 129∘. It is seen that the H wall is quite different for the three models. Namely, increasing of nH,LISMand np,LISMleads to a higher and closer H wall due to increasing the charge exchange rate near the heliopause and interstellar dynamic pressure, correspondingly. It seems from results presented in Figure 3 that the ratio of Lyman alpha intensities is sensitive to the position and height of the H wall. In order to verify this statement we performed the additional test calculations.
Figure 4b presents the ratio of Lyman alpha intensities obtained in the frame of Model 1 with an artificially modified H wall (see Figure 4a). Namely, in the first case, the H wall peak was increased by a factor of 2 (dashed curve) and in the second case, the H wall was totally removed (dash-dotted curve). It is clear from the results that a larger H wall leads to a smaller Lyman alpha ratio and vice versa. This effect can be explained qualitatively by the following (for illustration see Figure 5a). Any changes of the H wall mostly influence the Lyman alpha intensity for the nose LOS crossing the H wall (Inose), and they have little influence on Itail.
Inoseis determined by local emissivity and absorption along the LOS. Local emissivity is proportional to the local number density of H atoms. This means that in the case of higher H wall (i.e., larger number density of secondary interstellar atoms) local emissivity is larger along the nose LOS, and hence, Inoseis larger and the ratio R is smaller compared with the case of a lower H wall. Thus, in order to decrease the ratio of Lyman alpha intensities we need to use hydrogen distribution with a higher H wall.
Figures 4c and 4d illustrate an effect of position of the H wall. We perform a test calculation in the frame of Model 3 with the H wall artificially moved away from the Sun by a factor of 1.6 (see Figure 4c). It is seen that in case of a more distant H wall, the Lyman alpha ratio becomes larger. A qualitative explanation of this effect is illustrated in Figure 5b. The local emissivity of backscattered radiation is proportional to the solar Lyman alpha flux at the considered point, which in turn is proportional to 1∕r2. Therefore, in the case of a more distant H
wall the local emissivity from the H wall is smaller and hence Inoseis smaller too and the ratio is larger compared
with the case of a closer H wall. Thus, another possibility to decrease the Lyman alpha intensity ratio is to move the H wall closer to the Sun.
In this paper we consider three models with different LISM hydrogen and proton number densities. However, the LISM boundary conditions are not free parameters of the model because other measurements constrain the parameters. For example, measurements of pickup ions by Ulysses/SWICS give the following estimation for the interstellar hydrogen number density at the termination shock (about 90 AU in the upwind direction):
nH,r=90= 0.087±0.022 cm−3[Bzowski et al., 2008]. Our Models 1 and 2 match this criterion, while Model 3 gives
a larger number density (see Table 1). Also crossing of the termination shock by Voyager 1 and 2 at different dis-tances (84 and 94 AU for Voyager 1 and 2) provides strong constraints for the model. Again Model 1 provides
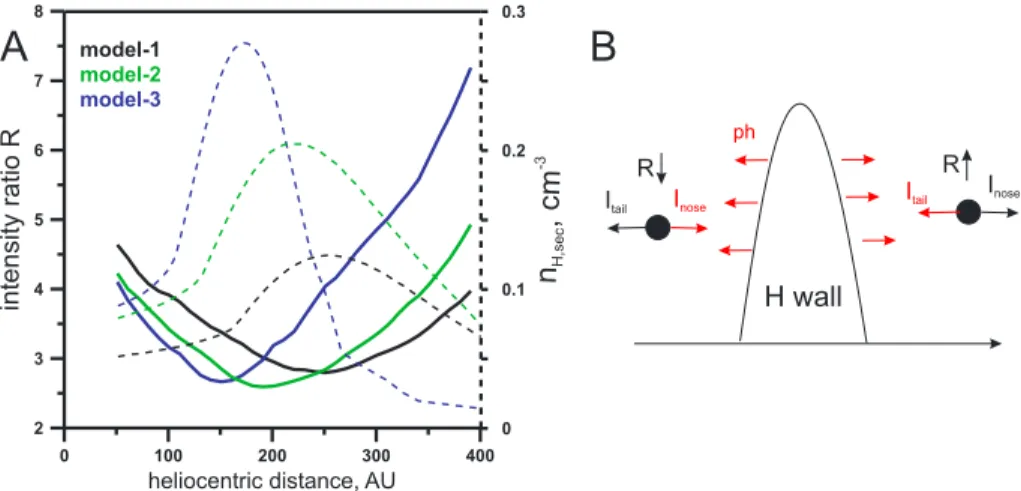
Figure 6. (a) Solid curves show the ratio of the Lyman alpha intensities calculated for the fix tail and opposite nose
directions. Observer is moving along the nose direction. Dashed curves show corresponding number densities of secondary H atoms at the H wall along the nose LOS. Results are presented for three considered heliospheric models. (b) Qualitative explanation of contribution of backscattered photons from the H wall to intensities in two directions. Before the H wallInoseis mostly contributed by the photons from the H wall and as a resultInosedecreases slower than
Itailand the ratio decreases. Behind the H wall the situation is opposite.
quite good agreement with Voyager 1 and 2 in distances to the termination shock, while in Model 3 the termination shock is much closer to the Sun, and the difference in its distances in Voyager 1 and Voyager 2 directions is less than 3 AU instead of the 10 AU observed in the data (see last two columns in Table 1). However, as was shown in this section, measurement of Lyman alpha intensities by Voyager 1/UVS in 1993–2003 provide additional restrictions for the heliospheric models. Model 1 is not consistent with these data because in this model the hydrogen number density at the H wall is too low and the H wall is too far from the Sun than is needed to explain the UVS data. On the other hand, in Model 3 the H wall is quite large and it leads to smaller Lyman alpha ratio in agreement with the UVS data.
The scanning platform of Voyager 1 was switched off in 2003, and after that measurements were performed for one direction only, tilted by 20∘from the upwind. But it is interesting to note that if scan measurements were performed at larger heliocentric distance, we would have another possibility for detection of the H wall location. Figure 6a shows the downwind to upwind ratio of Lyman alpha intensities calculated for an “ideal” case with fixed and almost opposite directions of LOSs, constant solar flux, and an observer moving radially away from the Sun in the upwind direction at large distances (50–400 AU). It is seen that the ratio decreases almost until approaching of the maximum hydrogen number density at the H wall and then it increases. This behavior can be explained by contribution of intensity from the H wall. Namely, before reaching the maximum number density Inoseis mostly contributed by the photons from the H wall. But after that photons scattered at
the maximum of the H wall mostly contribute to Itail(see Figure 6b for a schematic illustration). Thus, position,
where Lyman alpha ratio starts to increase, indicates a maximum of hydrogen number density at the H wall. This could be an important possible diagnostic of the H wall for future distant space missions.
4. Discussion and Conclusions
In this paper we have studied the tail to nose ratio of the Lyman alpha intensities measured by Voyager 1/UVS from 1993 to 2003. The main result of this study is a demonstration that the ratio is sensitive to the peak value and position of the H wall. This means that Voyager 1/UVS measurements of the Lyman alpha radiation in the outer heliosphere can be used as a remote diagnostic of the H wall. At the same time, we show that the typical global Model 1 of the heliosphere proposed by Izmodenov and Alexashov [2015], which is consistent with many observations, does not agree with the Voyager 1/UVS Lyman alpha measurements in 1993–2003 and provides a systematically larger ratio. It is also shown that the ratio can be decreased by making the H wall higher and/or closer to the Sun. In general, there are three LISM parameters which influence directly the height and position of the H wall: hydrogen number density nH,LISM, proton number density np,LISM, and interstellar magnetic field BLISM. The following possibilities exist in order to make the H wall higher and/or closer:
Journal of Geophysical Research: Space Physics
10.1002/2015JA022062
1. Increase of nH,LISMthat provides more primary H atoms and therefore more secondary atoms created bycharge exchange near the heliopause and, hence, higher H wall.
2. Increase of np,LISMthat leads to a larger interstellar dynamic pressure (and moving the heliopause closer to the Sun) and a larger charge exchange rate. Figure 3 in Izmodenov et al. [1999] illustrates dependence of the H wall on model’s parameter np,LISM. It is shown that increase of np,LISMfrom 0.04 cm−3to 0.3 cm−3leads to
the H wall being higher by a factor of 1.5 and closer to the Sun by a factor of 1.8.
3. Decrease of BLISMthat leads to more compressible interstellar plasma (due to larger fast magnetosonic Mach
number) and hence more effective charge exchange near the heliopause. Quantitative influence of the interstellar magnetic field on the H wall should be studied separately.
It should be noted that one more possibility to decrease the model ratio is the addition of some isotropic or nonisotropic Lyman alpha background (Iadd), which may exist for considered tail and nose directions. Namely,
R1= (Itail+ Iadd)∕(Inose+ Iadd) is less than R = Itail∕Inoseif the value of Iaddis comparable with the heliospheric
intensities. At this moment we do not have information about any “extragalactic” Lyman alpha background, but in principle, we cannot exclude such possibility.
Here we summarize the main results of the paper:
1. The ratio of intensities in the tail and nose directions is a tool for remote sensing of the H wall (its peak value and location). It is important to note that the ratio is not dependent on the calibration of the instrument and global 11 year modulations of the solar Lyman alpha flux, so it is a robust diagnostic. Although an accurate consideration of an instrumental and physical background is needed.
2. Voyager 1/UVS Lyman alpha data (scans from 1993 to 2003) show that larger and/or closer H wall is needed to explain the data compared with the H wall presented in the global heliospheric Model 1 proposed by
Izmodenov and Alexashov [2015].
3. Our Model 3 with increased LISM number densities of H atoms and protons provides a good agreement with the Lyman alpha data. However, it does not match the positions of the termination shock detected by Voyager 1 and 2.
4. The radial dependence of the modeled downwind to upwind Lyman alpha ratio has an inflection when the peak of hydrogen number density at the H wall is reached by an observer.
Obviously, at this moment it is impossible to find one global model consistent with all available observations. A possible solution may not be unique, and further investigations are needed in order to find a way to decrease the Lyman alpha ratio without moving of the termination shock and changes of hydrogen number density at distant heliosphere. One possible way would be to change the interstellar magnetic field that also can influence the charge exchange rate near the heliopause.
References
Baranov, V. B., and Y. G. Malama (1993), Model of the solar wind interaction with the local interstellar medium: Numerical solution of self-consistent problem, J. Geophys. Res., 98(A9), 15,157–15,163.
Baranov, V. B., M. G. Lebedev, and Y. G. Malama (1991), The influence of the interface between the heliosphere and the local interstellar medium on the penetration of the H atoms to the solar system, Astrophys. J., 375, 347–351.
Ben-Jaffel, L., O. Puyoo, and R. Ratkiewicz (2000), Far-ultraviolet echoes from the frontier between the solar wind and the local interstellar cloud, Astrophys. J., 533, 924–930.
Bertaux, J. L., and J. E. Blamont (1971), Evidence for a source of an extraterrestrial hydrogen Lyman-alpha emission, Astron. Astrophys., 11, 200–217.
Bertaux, J. L., R. Lallement, V. G. Kurt, and E. N. Mironova (1985), Characteristics of the local interstellar hydrogen determined from PROGNOZ 5 and 6 interplanetary Lyman-alpha line profile measurements with a hydrogen absorption cell, Astron. Astrophys., 150(1), 1–20.
Bertaux, J. L., et al. (1995), SWAN: A study of solar wind anisotropies on SOHO with Lyman alpha sky mapping, Sol. Phys., 162, 403–439. Bertaux, J. L., et al. (1997), First results from SWAN Lyman𝛼solar wind mapper on SOHO, Sol. Phys., 175(1), 737–770.
Broadfoot, A. L., et al. (1977), Ultraviolet spectrometer experiment for the Voyager mission, Spa. Sci. Rev., 21, 183–205.
Burlaga, L. F., and N. F. Ness (2014), Voyager 1 observations of the interstellar magnetic field and the transition from the heliosheath, Astrophys. J., 784(2), 146.
Bzowski, M., E. Möbius, S. Tarnopolski, Izmodenov V., and Gloeckler G. (2008), Density of neutral interstellar hydrogen at the termination shock from Ulysses pickup ion observations, Astron. Astrophys., 491, 7–19.
Clarke, J. T., R. Lallement, J.-L. Bertaux, H. Fahr, E. Quémerais, and H. Scherer (1998), HST/GHRS observations of the velocity structure of interplanetary hydrogen, Astrophys. J., 499, 482–488.
Costa, J., R. Lallement, E. Quémerais, J.-L. Bertaux, E. Kyrölä, and W. Schmidt (1999), Heliospheric interstellar H temperature from SOHO/SWAN H cell data, Astron. Astrophys., 349, 660–672.
Esposito, L. W., et al. (2004), The Cassini Ultraviolet Imaging Spectrograph investigation, Space Sci. Rev., 115, 299–361. Fahr, H. J. (1971), The interplanetary hydrogen cone and its solar cycle variations, Astron. Astrophys., 14, 263–274.
Acknowledgments
The data used here are from the UVS data archive at the Lunar and Planetary Laboratory, University of Arizona. These data were derived directly from Voyager telemetry information contained in UVS Experiment Data Records provided by JPL to the UVS investigation team. The data are available from the authors upon request (Eric Quemerais, eric.quemerais@latmos. ipsl.fr). O.K. acknowledges support from CNES during her postdoctoral position at LATMOS, France. O.K., V.I., and D.B. are supported by RFBR grant 14-02-00746 (in part of the analysis of Voyager data) and Program 9 of Presidium RAS (in part of studying of hydrogen distribution at the outer heliosphere). This work is done under discussions of international ISSI teams Nos. 327 and 318. Calculations of ISH distribution were performed by using the Supercomputing Center of Lomonosov Moscow State University.
Fayock, B., G. P. Zank, and J. Heerikhuisen (2013), Comparison of Pioneer 10, Voyager 1, and Voyager 2 ultraviolet observations with anti-solar Lyman-alpha backscatter simulations, Astrophys. J. Lett., 775(1), L4.
Fayock, B., G. P. Zank, J. Heerikhuisen, C. R. Gilbert, and K. Scherer (2015), Lyman-alpha radiation pressure in the heliosphere: Results from a 3D Monte Carlo radiative transfer simulation, J. Phys., 642(1), 12007.
Fisk, L. A., and G. Gloeckler (2014), On whether or not Voyager 1 has crossed the heliopause, Astrophys. J., 789(1), 41.
Gangopadhyay, P., V. V. Izmodenov, M. Gruntman, and D. L. Judge (2006), Voyager 1, Voyager 2, and Pioneer 10Ly𝛼data and their interpretation, Astrophys. J., 637, 786–790.
Gladstone, G. R., S. A. Stern, and W. R. Pryor (2013), New horizons cruise observations of Lyman-a emissions from the interplanetary medium, in Cross-Calibration of Far-UV Spectra of Solar system Objects and the Heliosphere, ISSI Sci. Rep. Ser., vol. 13, edited by E. Quémerais, M. Snow, and R. M. Bonnet, pp. 177–188, Springer, New York.
Gloeckler, G., and L. A. Fisk (2015), More evidence that Voyager 1 is still in the heliosphere, Astrophys. J. Lett., 806(2), L27.
Gurnett, D. A., W. S. Kurth, L. F. Burlaga, and N. F. Ness (2013), In situ observations of interstellar plasma with Voyager 1, Science, 341(6153), 1489–1492.
Hall, D. T., D. E. Shemansky, D. L. Judge, P. Gangopadhyay, and M. Gruntman (1993), Heliospheric hydrogen beyond 15 AU: Evidence for a termination shock, J. Geophys. Res., 98(A9), 15,185–15,192.
Izmodenov, V. V. (2007), Filtration of interstellar atoms through the heliospheric interface, Space Sci. Rev., 130, 377–387.
Izmodenov, V. V., and D. B. Alexashov (2015), Three-dimensional kinetic-MHD model of the global heliosphere with the heliopause-surface fitting, Astrophys. J. Suppl. Ser., 220(2), 32.
Izmodenov, V. V., J. Geiss, R. Lallement, G. Gloeckler, V. B. Baranov, and Yu. G. Malama (1999), Filtration of interstellar hydrogen in the two-shock heliospheric interface: Inferences on the LIC electron density, J. Geophys. Res., 104(A3), 4731–4741.
Izmodenov, V. V., Yu. G. Malama, M. S. Ruderman, S. V. Chalov, D. B. Alexashov, O. A. Katushkina, and E. A. Provornikova (2009), Kinetic-gasdynamic modeling of the heliospheric interface, Space Sci. Rev., 146, 329–351.
Lallement, R., E. Quémerais, J.-L. Bertaux, B. R. Sandel, and V. V. Izmodenov (2011), Voyager measurements of hydrogen Lyman-𝛼diffuse emission from the Milky Way, Science, 334(6063), 1665–1669.
Linsky, J. L., and B. E. Wood (1996), The alpha Centauri line of sight: D/H ratio, physical properties of local interstellar gas, and measurement of heated hydrogen (the “hydrogen wall”) near the heliopause, Astrophys. J., 463, 254–270.
McClintock, W. E., and M. R. Lankton (2007), The Mercury atmospheric and surface composition spectrometer for the MESSENGER mission, Space Sci. Rev., 131, 481–521.
Pryor, W., et al. (2008), Radiation transport of heliospheric Lyman-𝛼from combined Cassini and Voyager data sets, Astron. Astrophys., 491, 21–28.
Quémerais, E. (2000), Angle dependent partial frequency redistribution in the interplanetary medium at Lyman-𝛼, Astron. Astrophys., 358, 353–367.
Quémerais, E. (2006), The interplanetary Lyman-𝛼background, in The Physics of the Heliospheric Boundaries, ISSI Sci. Rep., vol. 5, edited by V. Izmodenov and R. Kallenbach, pp. 283–310, ESA-ESTEC, Paris.
Quémerais, E., B. R. Sandel, R. Lallemen, and J.-L. Bertaux (1995), A new source of Ly𝛼emission detected by Voyager UVS: Heliospheric or galactic origin?, Astron. Astrophys., 299, 249–257.
Quémerais, E., Y. G. Malama, B. R. Sandel, R. Lallement, J.-L. Bertaux, and V. B. Baranov (1996a), Outer heliosphere Lyman𝛼background derived from two-shock model hydrogen distributions: Application to the Voyager UVS data, Astron. Astrophys., 308, 279–289. Quémerais, E., B. R. Sandel, and G. de Toma (1996b), 26 day modulation of the sky background Ly𝛼brightness: Estimating the interplanetary
hydrogen density, Astrophys. J., 463, 349–358.
Quémerais, E., J.-L. Bertaux, R. Lallemen, B. R. Sandel, and V. V. Izmodenov (2003), Voyager 1/UVS Lyman𝛼glow data from 1993 to 2003: Hydrogen distribution in the upwind outer heliosphere, J. Geophys. Res., 108(A10), 8029, doi:10.1029/2003JA009871.
Quémerais, E., V. V. Izmodenov, D. Koutroumpa, and Y. Malama (2008), Time dependent model of the interplanetary Lyman𝛼glow: Applications to the SWAN data, Astron. Astrophys., 488, 351–359.
Quémerais, E., R. Lallemen, B. R. Sandel, and J. T. Clarke (2009), Interplanetary Lyman𝛼observations: Intensities from Voyagers and line profiles from HST/STIS, Space Sci. Rev., 143, 151–162.
Quémerais, E., R. Lallement, J.-L. Bertaux, B. R. Sandel, V. V. Izmodenov, and Y. Malama (2010), Ultraviolet glow from the hydrogen wall, Astrophys. J., 711, 1257–1262.
Quémerais, E., B. R. Sandel, V. V. Izmodenov, and G. R. Gladstone (2013), Thirty years of interplanetary background data: A global view, in Cross-Calibration of Far-UV Spectra of Solar System Objects and the Heliosphere, ISSI Sci. Rep. Ser., vol. 13, edited by E. Quémerais, M. Snow, and R. M. Bonnet, pp. 141–162, Springer, New York.
Quémerais, E., B. McClintock, G. Holsclaw, O. A. Katushkina, and V. V. Izmodenov (2014), Hydrogen atoms in the inner heliosphere: SWAN-SOHO and MASCS-MESSENGER observations, J. Geophys. Res., 119, 8017–8029, doi:10.1002/2014JA019761.
Slavin, J. D., and P. C. Frish (2008), The boundary conditions of the heliosphere: Photoionization models constrained by interstellar and in situ data, Astron. Astrophys., 491, 53–68.
Stone, E., A. C. Cummings, F. B. McDonald, B. C. Heikkila, N. Lal, and W. R. Webber (2013), Voyager 1 observes low-energy galactic cosmic rays in a region depleted of heliospheric ions, Science, 341(6142), 150–153.
Thomas, G. E., and R. F. Krassa (1971), OGO 5 measurements of the Lyman alpha sky background, Astron. Astrophys., 11, 218–233. Vincent, F. E., O. A. Katushkina, L. Ben-Jaffel, W. M. Harris, V. Izmodenov, E. Quémerais, D. Koutroumpa, and J. Clarke (2014), Observations of
the interplanetary hydrogen during solar cycle 23 and 24. What can we deduce about the local interstellar medium?, Astrophys. J. Lett., 788, L25.
Wallis, M. K. (1975), Local interstellar medium, Nature, 254, 202–203.
Witte, M. (2004), Kinetic parameters of interstellar neutral helium. Review of results obtained during one solar cycle with the Ulysses/GAS-instrument, Astron. Astrophys., 426, 835–844.
Woodgate, B. E., et al. (1998), The space telescope imaging spectrograph design, Publ. Astron. Soc. Pac., 110, 1183–1204.
Woods, T. N., W. K. Tobiska, G. J. Rottman, and J. R. Worden (2000), Improved solar Lyman𝛼irradiance modeling from 1947 through 1999 based on UARS observations, J. Geophys. Res., 105, 27,195–27,216.