DIMENSIONAL CHANGES IN HARDENED GAGE STEELS By
Benjamin Lewis Averbach
M.Met.Eng., Rensselaer Polytechnic Institute, 1942
Submitted in Partial Fulfillment of the Requirements for the Degree of
DOCTOR OF SCIENCE at the
Massachusetts Institute of Technology
1947 Signature of Author Department of Metallurgy September 5, 1947 Signature of Professor in Charge of Research A A Signature of Chairman Department Committee on Graduate Students
I-min Q)k TABLE OF CONTENTS List of Figures List of Tables Acknowledgments Introduction
Precision Length Measurements Quenching Dilatometer Measurements
The Quantitative Determination of Retained Austenite.
A. The Problem
B. Quantitative Analysis by X-ray C. Experimental Procedure for Retained
Austenite
D. Extinction and Absorption Effects E. Results of Austenite Determinations F. Effect of Tempering on Austenite
Deter-minat ions
The Decomposition of Martensite
The Isothermal Decomposition of Retained Austenite VII Conclusions
VIII References
Abstract
IIX Biographical Note
Pare ii vii 1 6 25 51 51 35 59 51 59 66 70 92 106 109 viii x 291O38 I II III IV V VI
-~mu - ii -LIST OF FIGURES Figure 1. Figure 2. Figure 5. Figure 4. Figure 5.
Method of aligning rod specimen in
comparator for precision length mea-surement, showing gage block arrange-ment for adjusting total length to
4.120 inches.
Relative changes in length on aging of a
ball-bearing steel austenitized at 15500 F
(845° C) for 50 minutes and quenched into
oil at 680 F (200 C).
Relative changes in length on aging of a
ball-bearing steel austenitized at 15500 F
(845 C) for 50 minutes, quenched into oil
at 680 F, and refrigerated immediately in
liquid nitrogen at -521O F (-1950 C) for
one hour.
Relative changes in length on aging of a
ball-bearing steel austenitized at 15500 F
(8450 C) for 50 minutes, quenched into oil
at 1250 F (500 C), and air-cooled to room
temperature.
Relative changes in length on aging of a
ball-bearing steel austenitized at 15500 F
(8450 C) for 50 minutes, quenched into oil
at 2500 F (1200 C), and air-cooled to room
temperature. Page 7 9 12 14 15
Figure 6. Figure 7. Figure 8. Figure 9. Figure 10. 1~ ~ a ~x '' I - ~--- iii
-Relative changes in length on aging of a 16
ball-bearing steel austenitized at 15500 F (8450 C) for 50 minutes, quenched into
mol-ten salt at 4500 F (2500 C), and air-cooled
to room temperature.
Relative changes in length on aging of a plain 17
carbon tool steel austenitized at 14500 F (7900 C) for 50 minutes and quenched into
water at 680 F (200 C).
Relative changes in length on aging of a plain 19 carbon tool steel austenitized at 14500 F
(7900 C) for 50 minutes, quenched into water
at 680 F (200 C), and refrigerated immediately in liquid nitrogen at -5210 F 1950 C) for one
hour.
Relative changes in length on aging of a plain 20 carbon tool steel austenitized at 14500 F
(7909 C) for 50 minutes, quenched into water
at 1250 F (50 C), and air-cooled to room
temperature.
Relative changes in length on aging a plain 21
carbon steel austenitized at 14500 F (7900 C)
for 50 minutes and quenched into iced brine at 280 F (-50 C).
Figure 11. Figure 12. Figure 15. Figure 14. Figure 15. Figure 16. Figure 17.
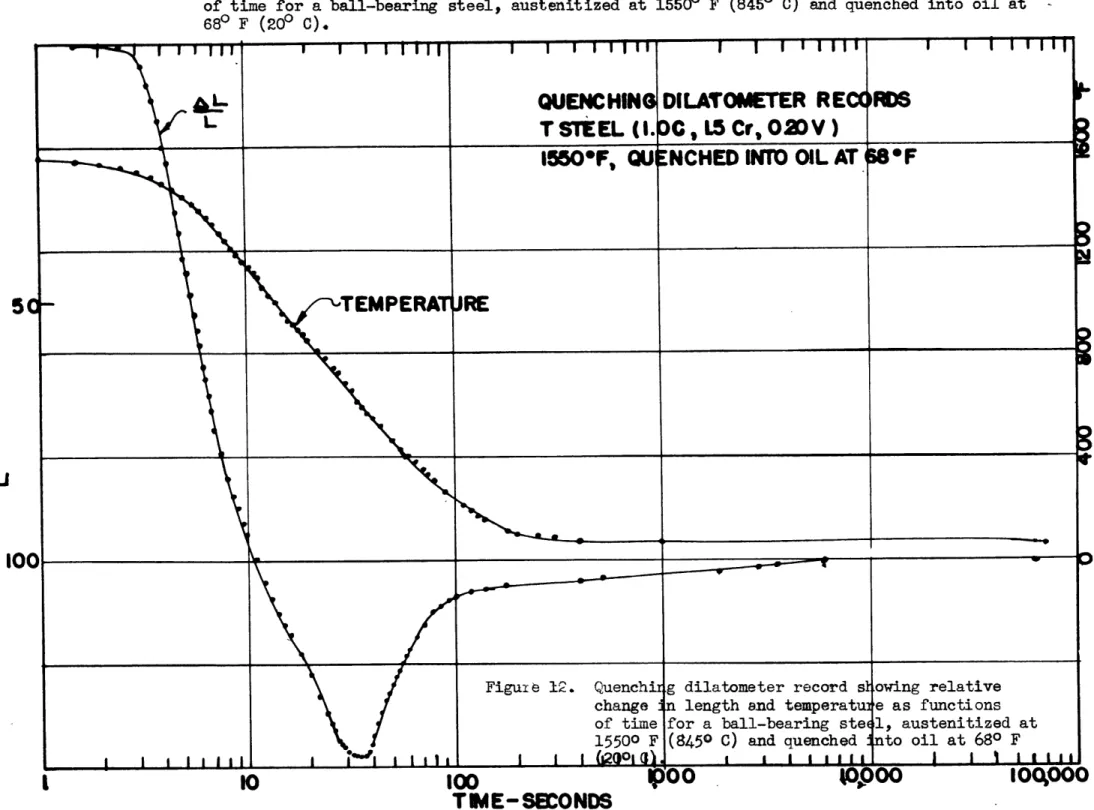
Quenching dilatometer apparatus showing ar-rangement of the equipment and a close-up of the specimen. The dial gage and timer are turned 900 from their normal position Quenching dilatometer record showing rela-tive change in length and temperature as functions of time for a ball-bearing steel, austenitized at 15500 F (8450 C) and quench-ed into oil at 680 F (200 C).
Quenching dilatometer record showing rela-tive change in length and temperature as functions of time for a plain carbon steel, austenitized at 14500 F (790 C) and quench-ed into water at 680 F (200 C).
Variation of absorption correction with
dif-fraction angle for a flat sample.
Arrangement of diffraction camera to obtain
monochromatic radiation on a flat sample.
X-ray diffraction patterns obtained with CoK. monochromatic radiation showing aus-tenite and martensite lines.
Microphotometer traces of diffraction pat-terns shown in Figure 16.
-iv-Pate 24 28 29 58 41 45 44 _1 __
-, Figure 18. Figure 19. Figure 20. Figure 21. Figure 22. Figure 23.
The variation of V*A(Q) with diffraction angle
obtained for K steel (1.07 carbon)
austenit-ized at 14500 F (7900 C) and quenched into
water. The lower points are calculated from
the austenite lines and the constant ratio needed to bring the lower points on to the up-per curve gives the volume ratio of martensite to austenite.
Diffraction of x-rays by a given grain in a mass
of crystallites. (After Brindley(19)).
Relative changes in length on aging 100 percent
martensite of a ball-bearing steel austenitized
for 50 minutes at 15500 F (8450 0) and quenched
into oil.
Relative changes in length on aging 100 percent martensite of a plain carbon tool steel austen-itized for 50 minutes at 14500 F (790P C) and quenched into water.
Rate equation for martensite decomposition in a
plain carbon tool steel at temperatures from 52 to 3000 F (0 to 1500 C).
Activation equations for tate constants of
mar-tensite decomposition in a plain carbon tool
steel. _~ Page 49 54 75 74 88 89
Figure 24.
Figure 25.
Figure 26.
Figure 27.
Isothermal decomposition of austenite at 680 F (200 C) for a ball-bearing steel. Isothermal decomposition of austenite at 680 F (200 C) for a plain carbon tool steel.
Effect of aging on the decomposition of austenite for the ball-bearing steel. The initial reaction at 680 F (200 C) is the decomposition of austenite into martensite, and the later reaction, which occurs after prolonged times at 250 and 500o F (120 and 1500 C), is the decomposition of austenite into bainite.
Effect of aging on the decomposition of austenite for the plain carbon steel. The initial reaction at 680 F (200 C) is the decomposition of austenite into martensite and the later reaction, which occurs after prolonged times at 250 and 500 F (120 and 1500 C), is the decomposition of austenite
into bainite. - vi -page 96 97 105 104 _~ ____ _
V:S
LIST OF TABLES
I. Analyses of Steels
II. X-ray Constants for Austenite and Martensite Lines III. Integrated Intensities for Austenit Determination
IV. Effect of Room Temperature Aging on Retained
Aus-tenite Contents
V. The Microabsorption Effect
VI. Retained Austenite Contents (K steel)
VII. Retained Austenite Contents (T steel)
VIII Comparison of X-ray Determination vs. Lineal
analy-sis
IX. Effect of Quenching Conditions on Retained Austenite
Content
X. Effect of Tempering on Austenite Determinations
XI. Effect of Tempering on Hardness (T steel)
XII. Effect of Tempering on Hardness (K steel)
XIII Constants of Rate Equation for Martensite
Decom-position
XIV. Isothermal Decomposition of Austenite at 680 F
XV. Decomposition of Austenite on Tempering (T steel) XVI. Decomposition of Austenite on Tempering (K steel)
XVII Relative Change in Length Caused by Decomposition of 1 percent of Austenite at Various Temperatures.
- vii -Page 46 48 52 56 60 61 65 64 68 77 78 86 95 99 100 102
- viii
-ABSTRACT
The reaction rate of martensite decomposition and the
mechan-ism by which retained austenite transforms isothermally have been
studied by means of precision length measurements, quenching
dila-tometer observations and quantitative x-ray analyses developed
specifically to measure small amounts of retained austenite in
quenched steels. These studies have shown that it is practically impossible to eliminate all of the retained austenite by a
continu-ation of the quench even to liquid nitrogen temperatures, and that
retarding the rate of cooling through the martensite region
in-creases the quantity of retained austenite.
The solubility of carbon in martensite at the end of the first
stage of isothermal tempering increases slightly as the tempering
temperature increases up to 5000 F (1500 C), and the end of the first stage is marked by retardation in the rate of carbon
rejec-tion from the martensite lattice. Martensite decomposirejec-tion, which
occurs by means of a process of nucleation and growth of a
transi-tion precipitate, is believed to be accelerated by the stresses
present in the martensite lattice and may be represented by the
rate equation:
-de = K(T) c
where c = concentration of carbon remaining in solution at
time, t.
K(T) and S(T) = constants depending only on temperature.
-ix-The heat of activation of the rate coefficient K(T) has been
deter-mined as approximately 8500 cal/mol. This may be regarded as a
measure of the activation energy of carbon diffusion in martensite,
and is about one-half of the value calculated by Polder for carbon diffusion in ferrite. This reduction in potential barrier is pro-bably caused by the high stress level in martensite.
The austenite-martensite reaction does not stop completely when the cooling stops, but 5 or 4 percent more of austenite may transform isothermall into martensite at room temperature. This
isothermal transformation proceeds rather rapidly during the first
1.5 hours after the quench, but it continues at a diminishing rate
for several months. As retained austenite is tempered at higher
temperatures, the decomposition of austenite into bainite becomes
evident after prolonged aging times at 250 and 500 F (120 and 1500 C),
but this bainite decomposition (i.e. the second stage of tempering)
is quite distinguishable from the earlier isothermal decomposition
into martensite.
--ACKNOWLEDGMENT
The author would like to express his appreciation to
Professor Morris Cohen, who gave generously of his time to help
solve the experimental and theoretical problems which arose in the course of the investigation, and to Professor B. E. Warren of the Physics Department for his valuable aid in the develop-ment of the x-ray method used in this study.
A fellowship grant from the Sheffield Foundation made this
work possible and is also gratefully acknowledged.
I. INTRODUCTION
Many observations have been made on the dimensional instability of hardened steels. This instability is particularly troublesome in
master gage blocks which are normally required with a calibration to the nearest millionth of an inch, and as a result, many authors(1- 6 ) have investigated these irreversible changes in length which occur on room temperature aging. Although most of these studies have been
qualitative in that they evaluated a specific heat treatment used in
the manufacture of commercial gage blocks, Scott ( 7 ) seems to have been among the first to recognize the correlation between dimension-al instability and the structurdimension-al changes which take place on tem-pering. He correctly deduced that expansions on aging were caused by the decomposition of retained austenite and that contractions were caused by the tempering of martensite at room temperature. To manufacture a stable gage block of hardened steel, it has been neces-sary, intentionally or otherwise, to either balance these opposing
reactions or to minimize them with a rather involved series of pro-prietary tempering and "seasoning" treatments.
Since Scott's investigation, considerable progress has been made in the understanding of the austenite-martensite reaction, and these concepts have been reviewed and summarized recently(8)(9). Rather extensive information has also been obtained on the tempering
(1)Numbers refer to references at the end of the paper.
~lllec-
-2-process(lO),(1U),(12),(15)p(14),(15), and with the more precise methods of measurement now available it seemed fruitful to
recon-sider the dimensional changes in hardened steels by studying the early stages of tempering on the basis of phase reactions occur-ring in metastable structures. It also seemed desirable to recon-sider the austenite-martensite reaction to determine if this
reac-tion ceases completely as cooling is stopped, or if the
decomposi-tion of austenite observed at room temperature is not, in effect merely a continuous trailing-off of the main austenite-martensite reaction. From an investigation of the kinetics of these isother-mal decompositions it might, in addition, be possible to gain some
approach to the mechanics of these reactions.
In the discussion which follows, dimensional behavior is con-sidered only with reference to the changes which occur as a result of phase transformations, and it does not include the "movement"
which takes place during heat treatment or the distortion which may result from stress relief. In practice, satisfactory gages
must not only be dimensionally stable but must also have high hardness and good wear resistance. For this reason, combinations
of steels and heat treatments were chosen to give fully hard mar-tensitic structures with an excess of carbides. This corresponds to the normal commercial practice, and measurements were made on
specimens large enough to compare directly with commonly used gages. Two representative steels, a plain carbon tool steel (K steel) and a chromium ball-bearing steel (T steel) were investigated and their compositions are listed in Table I.
m " ~ -;; i .? L. i c si Mn Cr 1.07 0.25 0.25 0.014 0.011 1.00 0.55 0.57 Steel - 1.56 0.21 TABLE I Analyses of Steels Weight Percent
-5--4
-Early in the investigation it was shown that steels in the
annealed and spheroidised condition were stable, and no changes
in length greater than one part in a million were observed on
aging at room temperature. Such steels are, however, too soft to be used as gages. Hardened steels, on the other hand, are far from stable. They contain internal stresses as well as a
large percentage of martensite which is unstable and shows a marked tendency to decompose even at room temperature. In
addi-tion, hardened steels may contain up to 50 percent of retained austenite which is also far from equilibrium and which might, therefore, be expected to break down easily on aging.
Undis-solved carbides seem to play no direct part in dimensional sta-bility, although they are valuable in imparting wear resistance.
If the dimensional changes resulting from the transforma-tion of the unstable phases in the direction of their
equili-brium structures are considered, it is evident that two large opposing reactions can occur. For example, in the plain carbon steel after a water quench from 14500 F (7900 C) it will be shown later that there is present about 9 percent retained
aus-tenite, 2.6 percent undissolved carbides, and 88.4 percent mar-tensite. From lattice parameter and specific volume measure-ments (10) it can be shown that if freshly formed martensite were to decompose into ferrite and cementite, a linear contraction of
jl
i
-5-5500 x 10-6 in/in* would occur. Gages made from this steel are seldom tempered above 5000 F (1500 C), and about 50 percent of this total contraction could take place during such tempering.
This corresponds to almost the completion of the first stage of tempering, but there is still a large potential contraction
available to cause dimensional instability. At the same time,
it we assume that the 9 percent of retained austenite can
trans-form into martensite, a linear expansion of 1260 x 10-6 in/in would occur**. Since little of this austenite is removed by tempering up to 5000 F (1500 C) for short times, considerable potential growth could be caused by the decomposition of this
retained austenite, and the net effect could be either a con-traction or an expansion depending on the relative magnitudes and rates of the opposing transformations. By studying these net changes in dimension, this investigation attempted to sepa-rate the martensite decomposition from the austenite
transfor-mation and to observe the kinetics of each process by itself.
*This figure is 6000 x 10-6 in/in for 100 percent martensite containing 1 percent carbon and it also assumes that the fol-lowing relationship is valid:
L A Vv
L V
**This corresponds to 140 x 10-6 in/in for one percent of aus-tenite transformatiDn into martensite at room temperature.
hil"---
-G-
-6-II. PRECISION LENGTH MEASURENENTS
To investigate minute changes in length, specimens 3/8 inch in diameter by 4.000+0.001 inch long with the ends accurately ground to the contour of a 4 inch diameter sphere were used. Length determinations were made by fastening these specimens to a jig to keep themvertical, as shown in Figure 1, and then mea-suring them in a Sheffield Visual Gage Comparator with a magni-fication of 5000X. This gage compares the length of the sample with a standard gage block independently calibrated to the near-est millionth of an inch, and is able to determine deviations from this standard with an accuracy of 5 microinches. For a 4 inch sam-ple, this corresponds to a relative accuracy of about 1.5 micro-inches per inch. The standard gage blocks are nominally 4.120 inches long, and the difference in length between the sample and standard was made up by inserting small gage blocks as depicted in Figure 1. This arrangement permits measurements to be made on a wide variation of sample lengths with the same standard, despite the limited range of the instrument, and contributes greatly to
the ease of measurement and to the internal consistency of the data. The spherical ends prevent errors that might result from
slight tilting of the specimen from vertical.
The machined and ground rod specimens were first austenitized for 50 minutes in a lead pot controlled to 50 F (+30 C) and
m
GAGING
FLAT
RUBBER BAND
SPECIMEN HOLDER
ENDS OF SPECIMEN GROUND TO
4' DIA. SPHERE. .375 o ANVIL SURFACE GAGE BLO EEL
Figure 1. Method of aligning rod specimen in comparator for precision length
measurement, showing gage block arrangement for adjusting total length to 4.120 inches.
___~_ __
1
-7-
-8-quench in a closed brass tube surrounded by liquid nitrogen (-521P F, -195o C). Any scale accumulation was removed with emery paper in a lathe running at slow speed, and the specimens were degreased and allowed to remain for an hour on a large surface plate in the mea-suring room which was maintained at 68+10 F (20w0.50 C). A length
measurement was then made. Following this, the specimens were aged
in oil baths maintained at 100, 150, 200, 250 and 5000 F+20 F (40,
65, 95, 120 and 150 + 1 C), in air at 680 F (200 C) and in an ice
bath at 520 F (00 C). Length determinations were repeated at suit-able intervals for periods exceeding 200 days.
The type of data obtained from such a determination is shown in
Figure 2. A series of specimens of the ball-bearing steel (T steel)
was austenitized at 15500 F (8450 C) quenched into oil at room
tem-perature and aged at the temtem-peraturesmentioned previously. Their
changes in length were recorded as they aged, but for each
determi-nation it was necessary to bring the specimens to room temperature, allow them to come to thermal equilibrium for one hour, and to then make the length measurement at 680 F (200 C). The changes caused by
the time at room temperature and by the cooling to or from the
mea-suring temperature were assumed to be negligible. Figure 2 shows
the relative changes of length as a function of time at aging
tem-perature and it should be noted that the elapsed time is plotted in
hours on a logarithmic scale. Time is taken as beginning at 90
min-utes after the completion of the last heat treating operation, since
+z0
320 F
0200o 0100-400
150F
250*F
-600
20
00 F
-800
0.1
I
10
100
oo
10
p00
AGING
TIME -HRS.
Figure 2. Relative changes in length on aging of a ball-bearing steel austenitized at 15509 F (8450 C) for 50 minutes and quenched into oil at 680 F (200 C).
- 10
-thermal equilibrium after heat treatment before any length measure-ments could be made. Accordingly, the relative changes in length
are all calculated from this point. The first reading as plotted is elapsed time after this reference point, and any changes during the first 90 minutes after the quench apply as a constant
correc-tion to all of these determinacorrec-tions.
The relative changes in length, plotted as x 10-6 in/in
are the averages of at least two specimens treated simultaneously. As aging proceeded, at least 20 length measurements were made on each specimen within the first thousand hours, but the individual points are not plotted, to avoid confusion. The readings were re-producible with an accuracy of +2 x 10- 6 or 10 percent whichever is the greater. This error did not usually arise from the measurement itself, but from the inherent difficulties in reproducing quenching conditions precisely for each set of specimens. The structural re-actions under investigation however, caused length changes which were large compared to this error. No corrections were made for the temperature coefficient of expansion since both the specimens and the standards had approximately the same coefficient, and the speci-mens were left on the plate long enough to come to the same tempera-ture as the standard.
The data in Figure 2 show a maximum growth at 520 F (C0 C) which disappears as the aging temperature increases, and at 250 and 5000 F
(120 and 1500 C) a relatively large expansion at prolonged aging times is apparent as the retained austenite decomposes into bainite
iW
__ C___ _ _ _ _I ~___ ~__I__~ _ __1__~_ __
- 11
-during the second stage of tempering(11). It is difficult to
explain the earlier maxima at 52 and 680 F (0 and 200 C) on this
basis, and qualitatively it is apparent that an isothermal decom-position of austenite must precede the bainite formation.
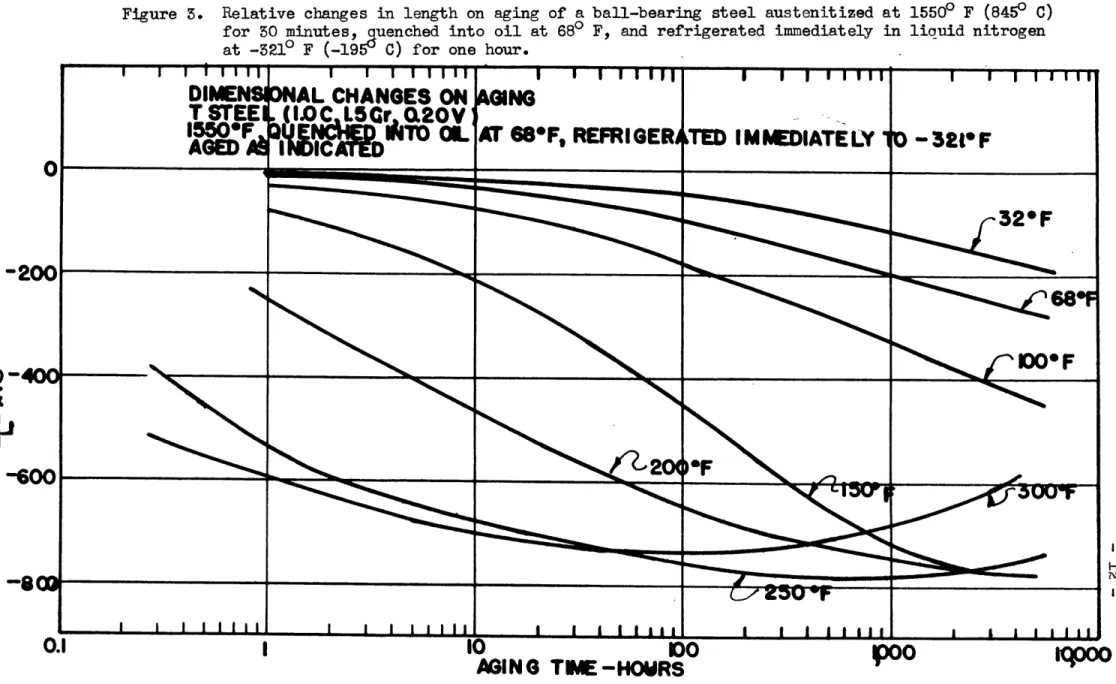
Figure 3 shows the dimensional behavior on aging of a similar set of specimens which had been refrigerated immediately after the
quench to -3210 F with liquid nitrogen. Earlier investigators(16), (17),(18) believed that this subcooling treatment would transform all of the retained austenite into martensite, and, indeed, the early maxima of Figure 2 did disappear for the subcooled specimens.
On aging at 250 and 3500 F (120 and 1500 C), however, decomposition of retained austenite into bainite was still observed, but on a reduced scale. Apparently the refrigerated specimens contained significant quantities of retained austenite although in smaller amounts than the non-refrigerated specimens. The presence of aus-tenite in these subcooled specimens was later verified and measured
by an independent method. The data in Figures 2 and 5 may be con-sidered, therefore, as being derived from two mixtures of austenite
and martensite of the same chemical composition, but with different
quantities of each constituent.
In commercial heat treating practice it is not uncommon to
in-terrupt the quench at temperatures above room temperature and to
then allow the work to air cool through the remainder of the mar-tensite range. The interrupting temperature may be even above the
Figure 3. Relative changes in length on aging of a ball-bearing steel austenitized at 15500 F (8450 C)
for 50 minutes, guenched into oil at 680 F, and refrigerated immediately in liquid nitrogen at -5219 F (-1959 C) for one hour.
I I l I l I l I 11I I lI I 1I1 1 I1l I I I II III I I Il l III
DIMEN
NAL
CHANGES ON
GING
T
STEE
(.0C LS
I
O.20V
0
I I I I I I I I I I I II OI G , _ _1 I I I I1
2"O
I I III II I I II25-*
AGING TME -HOURS
po0
-20
0
4C
-60
uV.
- 15
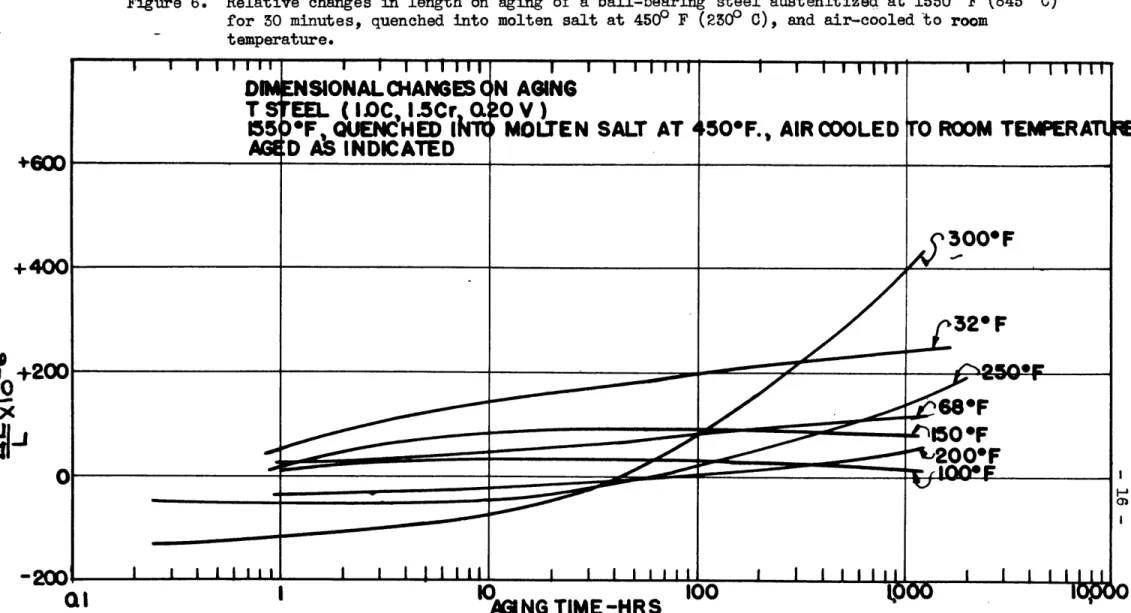
-Ms* point, as in martempering, but the effects of such treatments on the retained austenite content and on the stability of the aus-tenite have not previously been investigated. Figure 4 shows the dimensional behavior of the ball-bearing steel specimens quenched into oil at 1250 F (50 C), held for five minutes in the quenching bath to allow it to come to thermal equilibrium, and then cooled
in air to room temperature. Similarly, specimens were quenched
into oil at 2500 F (1200 C) and molten salt at 450P F (2300 C), held in the hot quenching bath for five minutes, and allowed to
air-cool to room temperature. The dimensional changes on aging
for these cases are shown in Figures 5 and 6. From hardness values it was evident that little or no pearlite had formed dur-ing the quench so that the dimensional behavior in Figures 4, 5 and 6 can also be taken as due to various mixtures of martensite
and retained austenite. The Ms point for this steel was measured
on very small specimens (1/16 inch thick x 1/4 inch diameter) by
the hot-quenching method of Greninger and Troiano(1 9) and found
to be 4150 F (2150 C) so that the data of Figure 6 represent the behavior of martempered specimens.
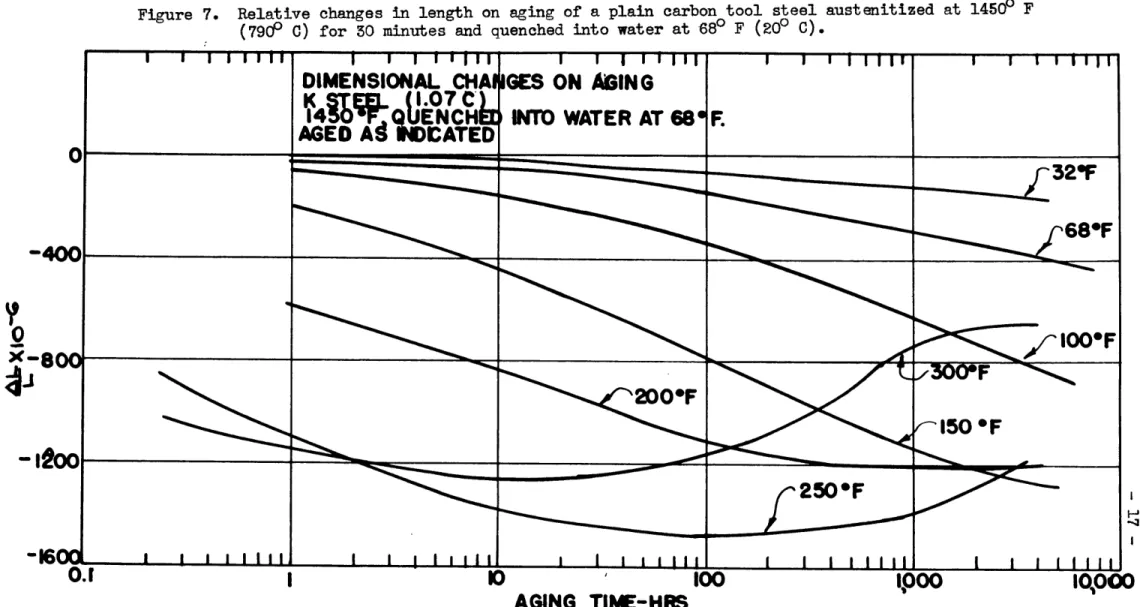
An analagous series of treatments were performed on the plain carbon steel (K steel). Figure 7 shows the dimensional behavior of this steel after quenching into water from 14500 F (7900 C), and here it is also evident that considerable quantities of
re-tained austenite decomposed into bainite at the higher aging
Figure 4. Relative changes in length on aging of a ball-bearing steel austenitized at 15500 F (8450 C) for 50 minutes, quenched into oil at 1250 F (500 C), and air-cooled to room temperature.
I I I I 11. I
DIMENSK
TSTEEL
1550*F
AGED Ail
I I I I I11 INAL
CHANGES ON
A
(I.OC 1 Cr 020
V)
)UEdiHED
INTOOIL
INDICATED
[LA t ! I I I 1 li i i i i O l g a I ii .. rr . rrr ISING
I I I I I I I I I I r11AT
125 F., AM 0O01ED
TO
ROOM TEMP
RATURE
a
____x
I I I • .L3-
2F
'Fss
S-IuV r
300OF
WOF I. ' . N m | , ' I I I I mI I I I I I SwoAGING TIME-HIS
I I , I I111 102
-400
-0io Ibi. I I I I I I Ill ^ Gi w - - - - --I olowL -- - M I - I I N or ~e r I YY I 1 r II 2 w r • - • i • 1,000Relative changes in length on aging of a ball-bearing steel austenitized at 15500 F (8450 C)
for 30 minutes, quenched into oil at 2500 F (1200 C), and airrcooled to room temperature.
I I I IIII~ I I I I I ill
IM
MSIOA
CHANGE
STEEL (I.O'C 1.5 Cr
50
F
QUENHED IA
GED
AS
INDICATED
I I I 11IS ON
AGING
P.20
V)
rO
OIL
AT
250*F,
Al
I I T IIISCOOLED
TO
OOM T
I I I I I IIIEM PERATUR E
.32
F
--
F
3
00F
'OF
I--I
m
-m~mI
I I I 1111 I I I I I I I I I I I I II I I I I I I I Il200 F
I I I I I I Il 6,NIIEH
4I00IIpo
I
Figure 5.+4
-4001O
000oo
lopoo
AGING TIME-HRR
- ---
~~
l FMwm --- --- an •- m-m -- -- • ,,l GGV ISO rRelative changes in length on aging of a ball-bearing steel austenitized at 15500 F (8450 C)
for 30 minutes, quenched into molten salt at 450° F (2300 0), and air-cooled to room
temperature.
I
1 I I I I I I I II I I I 1 II I I I I I I III I I I I 1 s
DIM
SIONAL CHANGES ON
AGING
T
EEI ( IOC I.Cr
Oa.
OV)
155 *F
QUENCHED I
MOLTEN SALT AT
450F.,AIR COOLED
TO ROOM
TEMPIERA
D AS
INDICATED
300* F
32* F
)150*F
) I I I I I li l I I I I I II I I I I I I I I I ll I I I I
AGING TIME -HRS
kljIuFigure 6.
t G00)
+40C
10+20C
J©
-2CC
QI
IIFigure 7. Relative changes in length on aging of a plain carbon tool steel austenitized at 14500 F
(79&0 C) for 30 minutes and quenched into water at 68° F (200 C).
I I I I III I I I i I I I I ill I I I I
DIMENSIONAL CHAIGES ON AGIN G
K(1.07
C)
141;W UECHE INTO WATER AT 8F
AGED Ad ICDATED
150 F-oo
160. 1 I lo.AGING
T
-HSoo
oo
AGING TIME-MRS
- 18
-temperatures. The slight early maxima which were present in the low alloy steel are not apparent here. However, specimens which were quenched and immediately refrigerated to -521" F (-195o C) and then aged, Figure 8, shrank correspondingly faster so that there mnst have been some obscured expansion due to the early decomposition of the retained austenite.
Because of its relatively lower hardenability, the plain carbon steel could not be quenched into very warm baths and still
remain fully martensitic for the specimen sizes used here. It was possible, however, to obtain fully hard samples on quenching
into water at 1250 F (500 C), and Figure 9 shows that even this
slight increase in interrupting temperature produced a marked
change in dimensional behavior. Pronounced early maxima were present and it is apparent that this steel is very sensitive to
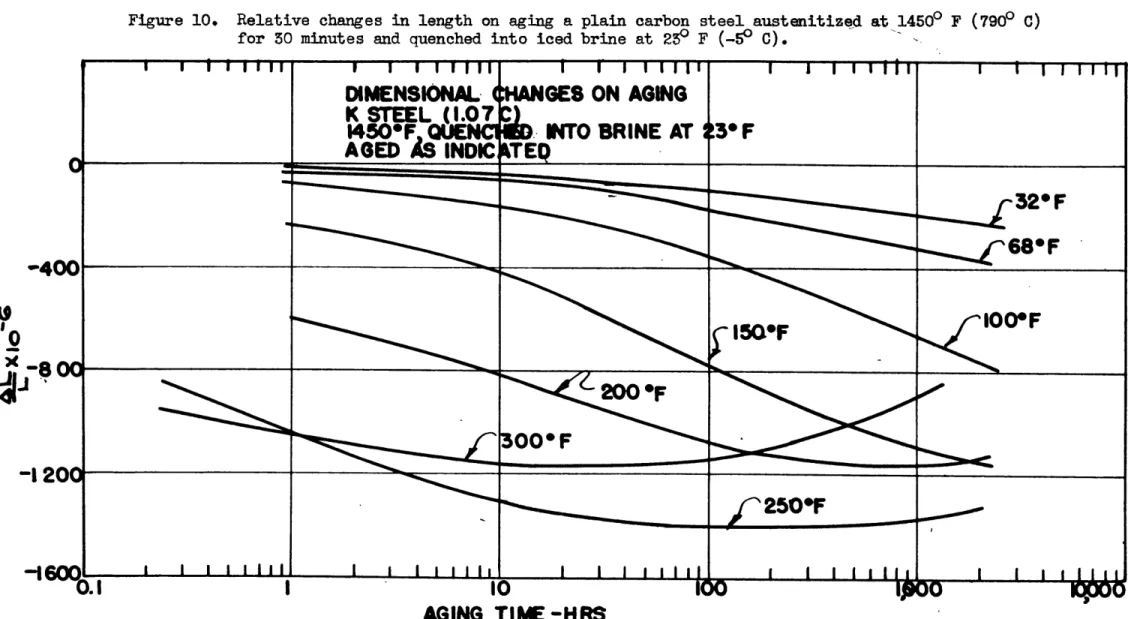
quenching conditions. An iced brine quench at 250 F (-5 C) was also used for this steel since this quench is considerably more drastic than the water quench, and these results are plotted in
Figure 10. The Ms point for thisteel was determined by the
Greninger and Troiano technique and found to be 4000 F (205" C). All of the specimens used in this investigation were obtain-ed from rod stock in the spheroidized-annealed condition. The effect of fibre direction had been investigated previously(18)
by cutting specimens from a plate of ball-bearing steel parallel and transverse to the rolling direction and subjecting them to various duplicate heat treatments. No significant differences
Relative changes in length on aging of a plain carbon tool steel austenitised at 14500 F
(7900 C) for 50 minutes, quenched into water at 680 F (200 0), and refrigerated immediately
in liquid nitrogen at -321o F (-195o C) for one hour.
DIMENSIONAL CHAI
K STEEL
(I.07C)
AGED
AS
INUKAI
0.1
AGING TIME-HRS.
Figure 8.-400
200-I 200
2
Relative changes in length on aging of a plain carbon tool steel austenitized at 14500 F
(7900 C) for 30 minutes, quenched into water at 1250 F (50O C), and air-cooled to room
temperature.
i I I 1 1 1II r I 1 1 11 I 1 1 1 111 I I I t I li
DIMEN
IONAL
CHANGES ON MING
K
STEE
(1.07C)
1450e QUENCHED
INTO
+TER AT 125OF
AGED
S
SIDICATED
_8_F
100 F200P
1509F
300 F
tfo'00
N
I I I I I II I -* ... *.a%
* . . . . • .a . . a .a a~~I nI I I i !1 I I I I I III I I0IN
0 0T1
AGII
TIME-HRS
Ipoo
0o
ow
I I I lI rIi I a a a almaI Figure 9.
+40(
0
X-400
-800
.I II I- I I IO0000"
1 ... _.Figure 10. Relative changes in length on aging a plain carbon steel austenitized at 14500 F (7900 C)
for 30 minutes and quenched into iced brine at 23" F (-50 C).
I I I i I I I I I II I I I I l l I I I l i I I
DIMENSIONAL
NGES
ON AGING
KSTEEL (1.07
14 50DF UITO
BRINE
AT
3* F
AGED
AS
INDIC TE
0
.
00400
-0
150F
0* F
200 *F
00
F
-120
AGING
TIME
-HRS
- 22
-in dimensional behavior were found on ag-ing and it has been assumed,
therefore, that the length changes measured in this investigation
reflect true volume changes due to phase transformations. This pro-cedure is a much more sensitive test of directionality than either direct specific volume determinations or simultaneous measurements of length and diameter of a given specimen.
I-24-r
III. QiUENCHIG DILATOMETER MIASUREMEUTS
Because of the observed instability of the dimensional specimens during the 90 minute interval between the quench and the first measurement, it was suspected that rather large changes took place during this period. A quenching dilatometer was
con-structed, therefore, to study this interval immediately after the quench. The dilatometer was essentially that of Flinn, Cook, and Fellows(20) except that it was modified to take a thermocouple and a specimen 4 inches long by 5/8 inch diameter. This specimen was supported at its lower end by an outer quartz tube cut away to admit free access of the quenching fluid, and was held by spring compression at the upper end against a smaller quarts tube which actuated the dial gage. The arrangement is shown in Figure 11.
For a dilatometer run, the specimen was set into the quarts holder, and austenitized in the small lead pot set on the moving table. To quench, the lead pot was lowered away from the speci-men and the quenching bath brought up around it, by swinging the counterweighted table through a U-shaped course described by the guide shown in Figure 11. During the quench the dial gage and timer remained in the same position and were photographed by a motion picture camera running at 16 frames per second but with shutter speed advanced to one-eightieth of a second to stop the motion of the dial. The quenching bath was equipped with a high
MOVIE CAMERA--INTERVA . TIMER SINGLE FRAME CONTROLL
GUIDE FOR TABLE
FLOOD LIGHTS1 DIAL GAGE SPECIMEN .-LEAD POT MOVING TABLE--. STRING I GALVANOMETER -RECORDING DRUM FOR GALVANOMETEF .DILATOMETER TUBE -QUENCHING BATH
Figure 11. Quenching dilatometer apparatus showing arrangement of the equipment and a close-up of the specimen. The dial gage and timer are turned 9& from their normal position
- 25
-controlled by a potentiometer controller, so that a wide variety of quenching conditions were possible. A vibrator was attached to the quarts tube holder, and flood lights were provided to light the dial sufficiently to be photographed.
For these experiments it was of utmost importance to determine when the specimen had reached room temperature. A hole 1/2 inch deep and 1/16 inch in diameter was drilled into the top of each dilatometer specimen and a 28 gage chromel-alumel thermocouple
in-serted until it made metallic contact. This thermocouple was thread-ed back through the inner quartz tube of the dilatometer to a string galvanometer with a 0.007 second period which was used by Greninger(21) and which was capable of following quenching rates up to 10,000 F per second. This galvanometer produced a trace on photographic paper attached to a revolving drum and provided, therefore, a record of temperature and time. The galvanometer deflections were calibrated in terms of temperature by measuring the austenitizing temperature with a separate portable potentiometer and recording the high trace on the revolving drum. A low trace was recorded at zero millivolts, and it was demonstrated that the temperature was a linear function of the deflection. This calibration was performed on each record. The quenching rates for the fairly massive samples used here were
comparatively -slow and it was an easy matter to match up correspond-ing records of length, temperature, and time.
In practice, the specimen was quenched with the flood lights on, the buzzer operating, the stirrer working vigorously, and the
- 26
-camera running free. At the same time, the string galvanometer was recording on the revolving drum. After the main motion of the dial gage had subsided and the specimen had reached room temperature, an automatic timer was introduced, and this would in proper sequence, turn on the lights, operate the vibrator, activate an electronic
circuit designed to trip the shutter for a single frame, and turn off the lights at predetermined intervals for the next 24 hours. On runs where the quenching bath was above room temperature, the
specimen tended to approach the ambient rather slowly and the tem-perature readings were taken directly on the potentiometer. An electric fan was also used to accelerate the air-cooling of these
specimens.
Considerable experimental difficulties were encountered in operating the quenching dilatometer. The specimen was quite heavy and the quartz breakage frequent. Because of the thermal shock,
specimens could not be quenched into iced brine, and molten salt
baths could also not be used because of the solidification of the salt about the specimen and quarts during the subsequent air
cool-ing. In order to quench to 4500 F (2500 C) it was necessary to use
a hot oil bath, but hardness readings as well as cooling curves demonstrated that there was little difference between salt and oil
at this temperature under these conditions. Some difficulty was also encountered with oil at 4500 F (250" C) because of a gumnmy
carbon residue which formed as the hot specimen was quenched into the hot oil. Lead oxide in the austenitizing bath attacked the
- 27
-quartz and caused it to deteriorate rapidly, but this was alleviated somewhat by deoxidizing the lead bath with an oil-soaked brick prior to each run. Finally, the quenching fluid tended to enter between the specimen and inner quartz rod and to flood the thermocouple. This was prevented by using a thin tight-fitting sleeve of stainless steel at the top of the specimen. The sleeve is not shown in Figure 11. After repeated trials, duplicate runs were obtained for each of the quenching conditions studied here with the exception of the iced
brine quench, and since the dilatometer specimen size and quenching
conditions duplicated rather closely the situation for the
dimen-sional specimens, it was possible to anambiguously project the length
changes from the dilatometer specimen to the dimensional data.
The results for a ball-bearing steel specimen (T steel) quenched
from 1550 F (8450 C) into oil at 680 F (200 C) are shown in Figure 12, and the corresponding results for a specimen of plain carbon
steel (K steel) water quenched from 14500 F (7900 C) are shown in Figure 15. The onset of the martensite reaction is indicated ap-proximately by the sharp minima in the length curves since the
aus-tenite-martensite reaction is attended with a rather large increase in volume. The temperature readings at these minima are several
hundred degrees higher than the Ma points measured by the Greninger
and Troiano method, and it is evident that the thermal gradients in the dilatometer specimens were so high that the thermocouple was reading consistently too high. Although this discrepancy might be quite large during the quench, it would tend to become less as room
Figure 12. Quenching dilatometer record showing relative change in length and temperature as functions of time for a ball-bearing steel, austenitized at 15500 F (8450 C) and quenched into oil at 68 F (200 C).
DILATOMETER R El
DC,
L5
Cr, OaoV)
1550*F, QUtNCHED INTO
OIL
AT
change 1 of time 15500 F
100
T
E- SECONDS
g dilatometer record skn length and temperatu for a ball-bearing ste(
(8450 C) and quenched I I I I I li I owing relative e as functions l, austenitized at to oil at 680 F
QUENC
HING
T STEEL
(I.
~~_~__~~~~~_ _ __~_Figure 13. Quenching dilatometer record showing relative change in length and temperature as functions of time for a plain carbon steel, austenitized at 14500 F (7900 C) and quenched into water at 680 F (20 C).
Lching dilatometer reco ,ime for a plain carbon
80 F (200 C).
IING DILATOMETER
I
WALTEiR
UENCH X
tE
IRDS
68*F
?d showing relative chage in length and temperature as functions
steel, austenitized at 1450Q F (7900 C) and q lenched into water
TI ME -SECONDS
iqpoo
I0
- - -_
- 50
-temperature were approached, and in any event, it would err on the conservative side in estimating when the entire sample had come to room temperature. Even on the compressed scale of Figures 12 and
15 it is seen that some expansion took place after the sample had reached room temperature, and what is equally important, that this expansion was continuous with that caused by the martensite reac-tion on cooling. Similar results were obtained for each of the
- 31
-IV. THE QUANTITATIVE DETERMINATION OF RETAINED AUSTENITE
A. The Problem
Before the reactions which hardened steels undergo on subse-quent heat treatment could be considered in anything but
qualita-tive fashion, it was necessary to make some kind of quantitative
analysis for each of the reacting constituents. Martensite and
retained austenite are the important reactants in the normally hardened tool steels considered here, although undissolved
car-bides must be considered as a diluent if they are present in
meas-urable quantities. Once this analysis had been made, it was more precise to follow transformation reactions by observing changes in length, but this latter method could only determine differences in the amount of retained austenite, and an independent method was necessary to establish the absolute amounts of either austenite or martensite.
In certain instances the microscope has been used to determine the percentage of retained austenite. The quenched sample is
tem-pered to darken the martensite, and then polished and etched in the
usual fashion. A point counting method, which measures the percen-tage of the etched area which appears as austenite, or the lineal
analysis of Howard and Cohen(9) which measures the percentage of a line drawn across an etched surface which is intercepted by
aus-tenite grains, has then been used to make the determination
quanti-tative. All such microscopic methods, however, depend on the etch
- 52
-itself being quantitative. On fairly coarse structures, larger than ASTM grain size No. 6, if a reasonably large percentage of retained austenite is present, i.e. larger than 15 percent, and if the austenite is not too finely divided, there is probably lit-tle smearing of the etch, and a lineal analysis or a point count
is probably quite accurate. If the structure is difficult to re-solve, however, the retained austenite may be completely obliterat-ed under the microscope or it may appear disproportionately low as the lines of demarcation become difficult to distinguish. For
example, a plain carbon tool steel (1.07 0 - K steel) quenched
from 14500 F (790 C) shows only martensite and undissolved
car-bides under the microscope, yet as will be shown later, such a sample contains almost 10 percent of retained austenite.
X-ray methods have been most successful in filling in the region under 15 percent retained austenite where the microscopic
methods usually fail. Although austenite and martensite in the same steel may be identical chemically, their crystal structures and lattice parameters differ, and the intensity of an austenite diffraction line is some function of the percentage of retained aistenite in the sample. In the method of Gardner, Antia and
Cohen(22) this principle was applied by exposing the sample sim-ultaneously with a standard aluminum foil in a Phragmen camera. The ratio of the peak blackening of the (200) austenite line to
that of the (200) aluminum line as determined from a microphoto-meter trace was taken as proportional to the austenite content.
53
-To calibrate this method, however, it was necessary to determine
this ratio as a function of austenite content by one of the
micros-copic methods. At high austenite contents this calibration was
probably quite accurate and it resulted in a straight line which apparently passed through the origin. Close to the point where the austenite began to disappear, however, the accuracy was pro-bably quite low, and it is questionable if the straight line
should have been continued from the last calibration point through
the origin. Fletcher's modification(1 6 ) consisted of tempering the sample at 500 F (1500 C) to collapse the martensite (1o0-101)
doublet and of using the (111) austenite line which is considerably more sensitive than the (200) line.
In addition to the uncertainty in the microscopic calibration
there is an inherent theoretical error in extending the calibration
line as a straight line through the origin. The peak intensity of a diffraction line is not a quantity which can be calculated
theoret-ically because it is influenced very greatly by the physical
condi-tion of the diffracting crystal. As the austenite transforms, the
particle size of the retained austenite becomes smaller, and soon
after it reaches the point where it can no longer be resolved under
the microscope, line broadening begins to occur in the austenite
diffraction lines. The peak intensities are thus lowered with a
corresponding increase in line width. Retained austenite
crystal-lites are also apt to be considerably distorted since the trans-formation product has a greater specific volume than the austenite
- 54
-from which it forms. Such distortion also reduces the peak
intensi-ties appreciably, and these two factors together could easily reduce
the peak intensities by 50 percent. However, only the intensity
distribution is affected in these cases; the total diffracted energy
remains the same. Other factors such as errors in photometry and
uncertainty in "instrumental" broadening affect the peak intensity
and the shape of the line but again have comparatively little effect
on the integrated intensity, which is proportional to the energy of the diffraction line. These factors cannot be eliminated by an
ex-ternal calibration since the austenite is no longer visible in these
regions, and they would tend to make the determination indicate less austenite than was actually present.
It is in this low austenite region that most normally hardened steels fall, and the isothermal decomposition data presented pre-viously indicated that many interesting effects occur even with
small amounts of retained austenite. These data also showed that more austenite was present in normally quenched steels than had previously been suspected, and another method of austenite deter-mination, which would be independent of a microscopic calibration
-35-B. Quantitative Analysis by X-rays
An x-ray method based on the measurement of diffracted energy can also be developed for determining the percentage composition of multi-phase alloys. If, for example, a mixture of martensite
and austenite is irradiated with x-rays, each type of crystal will diffract in accordance with the Bragg law.
(1) nA = 2d sin O
where n = order of the spectrum A = wavelength in kX units
d = interplanar spacing in kI units 9 = diffraction angle
To consider the energy in each of these diffraction lines it is necessary to measure the integrated intensity, i.e. the area under the intensity vs. 0 curve. This energy can be calculated on a
theoretical basis, however, and for a powder sample consisting of
very small crystals the integrated intensity in ergs/sec per unit
length of a diffraction line for a particular substance, , is given by:
(2) PK = KsIo S2e - 2M m (L.P.) A(Q)
where K = N2 A3e4 24 527r !,moec
- 58
-and PC = power per unit length of diffraction line in erg/sec for a particular diffraction line of
substance *c
N(
=
number of atoms per cm5A = wavelength in cm.
e = electronic charge in e.s.u. Ro = camera radius in cm.
me = electronic mass in grams
c = velocity of light in cm/sec.
Io = intensity of plane incident wave in erg/cm2
-sec.
V = volume in cm5 of substance, o( , irradiated
S,
=
structure factor per atom e- 2 m = Debye-Waller temperature factorm = multiplicity of diffracting plane
L.P. = Lorens and polarization factor A(G) = sample absorption factor
Collecting all the constants which would apply for a given camera and exposure, this equation may be asrranged to:
(5) PI = const * N eF2e- 2M m (L.P.) V, A(G) = const * R*V~A(G)
where No = number of unit cells per unit volume = -v, = volume of unit cell of substance *
-57-If martensite is taken as the substance o< , then a similar equation may be written for each diffraction line of austenite,
substance Y , where No, F, m, (L.P.), V. and A(Q) each have
different values. For each line, therefore, the coefficient R contains the factors which may be readily calculated from tabu-lated values, the volume irradiated in the unknown to be
deter-mined, and the absorption correction depends on the geometry of
the sample. For a flat sample set at a grazing angle, , the absorption correction has been given by Taylor(25) as:
(4) A(Q) = a(sain ) s in(20 .- ) , (0)
"A sin (20 - # ) + sin# '
where a = area of specimen irradiated
,, = average linear absorption coefficient for the entire specimen.
Since "a" and "" are constants for a given exposure, the factor
A' () varies only with 9 in a smooth curve such as the one plotted
in Figure 14 for the case where , = 600 . It is noticeable that
the absorption decreases rapidly as the back reflection direction
is approached.
To determine the volume percentage of c? and 2 , the
dif-fraction lines of substance o( are microphotometered and the inte-grated intensity per unit length of line determined in arbitrary
units. Division of these observed intensities by the appropriate
- 58
-ABSORBTION CORRECTION FOR FLAT SAMPLE
40
50
60
e (DEGREES)
Figure 14. Variation of absorption correction with diffraction angle for a flat sample.
60 4)
1
constant for all of the diffraction lines from substance *<, a plot of V( *A(Q) vs. 0 should have the same general shape as the curve in Figure 14. If the sample contains a different percentage of '
than of Y , a similar procedure will yield another curve for
V,*A(G) which should also have the same shape as the one in Figure
14. Since A'() is the same for both diffracting substances, the
difference in the curves for o< and ? is due only to the fact that
V, is different than Vy . The constant ratio by which the ordi-nates of the Y curve must be multiplied to place them on the 0( curve is thus equal to the volume ratio of '.N. If no other dif-fracting medium is present in the sample, the volume percentage of each constituent may then be calculated from the additional fact
that c + = 100.
C. Experimental Procedure for Retained Austenite
The procedure may be illustrated by describing the
determina-tion of retained austenite in the K steel (1.07 carbon) austenit-ized at 14500 F (790 C) for 50 minutes and quenched into water
at room temperature. The sample was a cylinder 3/8 inch diameter
by 5/8 inch long (0.95 x 1.6 cm) heat treated in a lead pot and quenched into agitated water. After heat treatment, about 1/8
inch was removed from the flat surface on a wet grinder with pre-cautions taken not to temper the specimen. A standard metallo-graphic polish and etch with 1 percent nital was then used and the
sample was examined for evidences of tempering and flow. Pitting P;_ ___~_~ _ ____~~ I _ _ ~ __ _ L ^_;I~_~__~I_ _
-of the undissolved carbides was also avoided since the diluting effect of these carbides was considered in a subsequent calculation.
The specimen was then mounted in'a Debye camera so arranged that the grazing angle, # , with a flat cross-section was 600. This grazing angle was chosen since it was small enough to allow the (200) martensite line to diffract, and large enough to prevent
excessive line boradening because of the obliqueness of the
irrad-iated surface. A flat sample was used because of the ease of
dup-licating the surface preparation and because it was possible to re-move sufficient metal from the surface to make certain that no edge effects were involved. A plane surface is also an efficient dif-fracting shape and exposure times were considerably lower than for
a wedge or a thin rod. Monochromatic CoKoK radiation was obtained by the diffraction of cobalt radiation from the (200) face of a rock salt crystal mounted directly on the camera in front of the
collimating system. Although both the half and third wavelengths were also present they did not interfere with the determination
since only the relatively weak lines were used. Monochromatic radiation was used to cut down the background intensity so that the very weak lines for low percentages of austenite would be visible, and the camera was also evacuated to reduce air scattering. The camera arrangement is shown in Figure 15. Segregated areas in the specimen were avoided, and because of the fine grain size (ASTM No. 9) obtained from this particular heat treatment no sample oscillation was necessary to obtain smooth uniform diffraction lines. Exposure
-- 1 I
-- 41
-X-RAYS
Co
RADIATION
)W
CAMERA EVACUATED
/8~ DIA. x% LG.
SPEC
IM EN
DIFFRACTION
CAMERA FOR AUSTENITE
DETERMINATION
Figure 15. Arrangement of diffraction camera to obtain mono-chromatic radiation on a flat semple.
I
i
times were about 24 hours and the central reproduction in Figure 16 shows the diffraction pattern obtained by this method for the K steel water quenched from 1450& F (790 C).
The x-ray patterns were recorded on Eastman No-Screen film, and all films were processed so as to produce a linear blackening
vs. intensity curve up to a blackening of 1.5. In practice, how-ever, the maximrum blackening used was approximately 1.2. These films were then microphotometered in a Kipp and Zonen recording microphotometer with the light intensity adjusted to provide the greatest possible vertical enlargement of the lines, and the cen-tral trace of Figure 17 shows the microphotometer record of the
corresponding film of Figure 16. This densitometer trace was then converted to a blackening curve and the areas under each peak calculated by Simpsonts rule in the manner described by
Fit zwilliam(24).
Most of the factors for the value of R in equation (5) have
been tabulated by Taylor(25). The volume of the unit cell was calculated in each case from the known parameters of austenite
and martensite for this carbon content(15). Since the CoKcx
radiation (1.7872 kX units) is very close to the absorption edge of iron (1.7594 kI units) a rather large correction must
be made in the listed atomic scattering factors for dispersion. This correction has been tabulated by H8nl(25) and takes the
- I ---MEN** 1 1 'W"" W a
-AUSTENITE
MARTENSITE
20C
0
WATER QUENCHED,
COOLED
IMMEDIATELY
TO
-321
0F
220
311
2.9%
220
1
AUSTENITE
0
WATER QUENCHED
D
i
QUENCHED INTO WATER AT
1250F,
AIR COOLED TO ROOM
TEMPERATURE.
9.3%
AUSTENITE
14.1%
AUSTENITE
Figure 16. X-ray diffraction patterns obtained with CoK monochromatic radiation showing aus-tenite and martensite lines.
-43-AUSTENITE (220) (311)
WATER QUENCHED, COOLED 2.9% AUSTENITE
IMMEDIATELY TO -321OF
WATER QUENCHED
e
-9.3% AUSTENITE
QUENCHED INTO WATER AT 14.1
125*F, AIR COOLED TO ROOM TEMPERATURE.
Figure 17. Microphotometer traces of diffraction patterns shown in Figure 16.
e% AUSTENTE
% AUSTENITE
--- 45
-form:
(5) f = fo - a
where f = effective atomic scattering factor
fo = calculated atomic scattering factors for the
case where the irradiating wavelength is not
close to an absorption edge of the sample
A f = decrement of the atomic scattering factor
due to interaction with the K electrons
For the case of CoK. radiation on iron, Af = 4.0 units. Since
the camera was too small and the lines too diffuse to allow
reso-lution of the martensite doublet for most of the lines, the
doub-lets were lumped together as if they were effectively body center-ed cubic lines for the martensite and the structure factor as well as the multiplicity were calculated on this basis.
The Debye-Waller temperature factor was calculated from the Debye temperature for iron taken as 420P K(26). In the Lorenz and
polarization factor, account was taken of the fact that a beam of
x-rays monochromated by a rock salt crystal is not completely
un-polarized and the (L.P.) factor was calculated from
cos2 cos2 2 (6) (L.P.) = + cos2 c 2 2
sing sin 20
where Qc = Bragg angle for the monochromating crystal. The values
of each of these factors are listed for austenite and martensite
in Table II.