HAL Id: tel-03128471
https://tel.archives-ouvertes.fr/tel-03128471
Submitted on 2 Feb 2021
HAL is a multi-disciplinary open access
archive for the deposit and dissemination of sci-entific research documents, whether they are pub-lished or not. The documents may come from teaching and research institutions in France or abroad, or from public or private research centers.
L’archive ouverte pluridisciplinaire HAL, est destinée au dépôt et à la diffusion de documents scientifiques de niveau recherche, publiés ou non, émanant des établissements d’enseignement et de recherche français ou étrangers, des laboratoires publics ou privés.
Cameroon). : A geochemical study of water dynamic
from the atmosphere to the subsurface.
Bertil Nlend
To cite this version:
Bertil Nlend. Hydrological processes in a hyper-humid coastal area with strong anthropogenic in-fluences (Douala, Cameroon). : A geochemical study of water dynamic from the atmosphere to the subsurface.. Hydrology. Université Bourgogne Franche-Comté; Université de Douala, 2019. English. �NNT : 2019UBFCD055�. �tel-03128471�
École doctorale n°554 Environnement-Santé
Doctorat de géologie - Structure et évolution de la Terre
Par
M.
Bertil NLEND
Processus hydrologiques dans une zone côtière
hyper-humide sous forte influence anthropique (Douala,
Cameroun). Une étude géochimique de la dynamique
de l'eau de l'atmosphère au sous-sol.
Thèse présentée et soutenue à Besançon, le 10 septembre 2019devant le jury composé de :
M. HUNEAU Frédéric Professeur à l’Université de Corse - Pascal Paoli Président
M. Stephen FOSTER Professeur à l’University College of London Rapporteur
M. Philippe LE COUSTUMER MCU HDR à l’Université de Bordeaux 1 Rapporteur
Mme. Camille RISI Chargé de Recherche HDR à l’Université Paris Sorbone Examinateur
M. Benjamin POHL Chargé de Recherche HDR à l’UBFC Examinateur
M. Guillaume BERTRAND MCU à l’UBFC Examinateur
Mme. Hélène CELLE-JEANTON Professeur à l’UBFC Directrice de thèse
M. Jacques ETAME Professeur à l’Université de Douala Co-directeur de thèse
École doctorale n°554 Environnement-Santé
Doctorat de géologie - Structure et évolution de la Terre
Par
M. Bertil NLEND
Hydrological processes in hyper-humid coastal area with
strong anthropogenic influences (Douala, Cameroon).
A geochemical study of water dynamic
from the atmosphere to the subsurface.
Thèse présentée et soutenue à Besançon, le 10 septembre 2019
devant le jury composé de :
M. HUNEAU Frédéric Professeur à l’Université de Corse - Pascal Paoli Président
M. Stephen FOSTER Professeur à l’University College of London Rapporteur
M. Philippe LE COUSTUMER MCU HDR à l’Université de Bordeaux 1 Rapporteur
Mme. Camille RISI Chargé de Recherche HDR à l’Université Paris Sorbone Examinateur
M. Benjamin POHL Chargé de Recherche HDR à l’UBFC Examinateur
M. Guillaume BERTRAND MCU à l’UBFC Examinateur
Mme. Hélène CELLE-JEANTON Professeur à l’UBFC Directrice de thèse
M. Jacques ETAME Professeur à l’Université de Douala Co-directeur de thèse
« Je me suis toujours posé des questions sur les gouttes de pluie. Je me demande comment elles tombent en trébuchant les unes sur les autres, en se brisant les jambes et en oubliant leur parachute quand elles dégringolent direct du ciel vers une fin incertaine. » “I always wondered about the raindrops. I wonder how they fall stumbling over each other, breaking their legs and forgetting their parachute when they tumble down from the sky towards an uncertain end.” Insaisissable, tome 1 : Ne me touche pas de Tahereh Mafi
I Tout au début de cette belle aventure qu’est la thèse se trouve une femme qui avait dédié la majeure partie de sa vie de sciences à l’hydrogéologie du bassin de Douala. Béatrice
Ketchemen-Tandia est celle qui a guidé mes premiers pas dans la recherche en dirigeant mes
travaux de Master sur la signature isotopique des pluies à Douala. C’est elle qui très tôt m’a mis à l’école des articles ; elle m’a mis le pied à l’étrier et m’a aidé à développer ma passion pour les isotopes. Je n’oublierai jamais toute la peine qu’elle a prise lors de la constitution de mon dossier pour l’obtention de la bourse de doctorat que j’aurai finalement eue. Je n’oublierai jamais son implication financière et matérielle lors de mes campagnes de terrain. Bien plus qu’une encadrante, Béatrice a été pour moi comme une mère. J’aurais aimé la compter parmi les membres du jury ce 10/09/2019 jour de ma soutenance, mais le ciel en a décidé autrement. De là où elle se trouve j’espère qu’elle est fière de moi et je lui fais la promesse d’être un bon hydrogéologue pour mon pays comme elle l’a toujours souhaité. Je remercie Hélène Celle-Jeanton pour avoir accepté de diriger cette thèse. En septembre 2016, quand j’arrive pour la première fois au laboratoire Chrono-Environnement, on a à peine de quoi faire une thèse. Hélène a très vite fixé le cap, donner les grandes orientations, défini les articles qu’on fera et établi des collaborations. C’est la meilleure directrice qu’un thésard puisse rêver d’avoir !! Je la remercie pour son enthousiasme qui m’a toujours été bénéfique lors de mes coups de mou^. Enfin, Hélène je veux te remercier pour ton amitié. J’espère qu’on aura l’opportunité de travailler sur pleins d’autres projets et agrandir ainsi ton dossier Cameroun^^.
Avec ses fonctions administratives de Directeur de l’IUT de Douala, on ne s’est pas souvent beaucoup vu mais Jacques Etame a bien co-dirigé cette thèse. Je le remercie pour ses conseils toujours pragmatiques et avisés. Il est des hommes qui aiment la science et bien des fois on ne mesure pas la chance qu’on a de l’avoir au sein du Département des Sciences de la Terre de l’Université de Douala. Sa présence à Besançon le 10/09/2019 m’a honoré à plus d’un titre.
Je veux maintenant remercier les membres du jury ; les hommes et femmes dont les travaux scientifiques et leur soin de la profession ont rendus éminents : Stephen Foster et Philippe
Le Coustumer pour avoir accepté de jouer le rôle de rapporteurs ; Frédéric Huneau, Camille Risi, Benjamin Pohl, Guillaume Bertrand et Marc Steinmann pour avoir pris la
peine d’examiner ce travail.
Marc je te remercie d’avoir été présent pour les comités de thèse. Guillaume merci pour tes corrections (on en reparle !!). Benjamin, tu es avec Pascal Roucou mon maitre en climatologie. Je vous remercie tous les deux pour votre disponibilité. Camille, ça a été un bonheur de bosser avec toi. Merci pour ta patience et pour m’avoir appris beaucoup sur les isotopes et les processus atmosphériques. Maintenant grâce à toi, je regarde le ciel différemment. Que Genevieve Seze soit également remerciée pour avoir mis à ma disposition les images satellitales des types nuageux. Frédéric, je sais toute la part que tu as dans cette thèse. Merci pour ton énorme soutien analytique et pour les relectures minutieuses des
II Cameroun à travers le SCAC ainsi que toute l’équipe Campus France du Grand Est pour leur coopération et pour avoir facilité mes mobilités.
A l’Université de Douala, je remercie Suzanne Nkot, ma grande sœur qui m’a toujours soutenu et encouragé. En l’absence de Béatrice, peu de choses auraient été possibles sans elle. Mes remerciements vont également à l’endroit de tous les enseignants du DST pour m’avoir initié à la géologie. A tous ceux qui m’ont accompagné sur le terrain et qui en plus ne sont pas des hydro je dis Merci. Boris, je te salue tout spécialement pour avoir assuré pour moi en grande partie le suivi journalier des pluies.
A Besançon je remercie mes zamis , les meilleurs que j’ai jamais eus, mes compagnons du du -116L : Cyril, Thomas, Méline et José. A chacun de mes séjours en France, vous m’avez toujours acceuilli royalement. Merci à vous les gars pour votre amitié et cette merveilleuse ambiance que vous avez sû entretenir au bureau. Ceci dit, on sait bien qui est le président aux jeux de cartes !!! Merci à Cyril et à sa femme Maud pour les soirées chez eux. Mazette, qu’est ce qu’on s’est marré ! Merci à vous deux de m’avoir fait découvrir les saveurs de cette belle région qu’est la Franche-Comté. Merci à Thomas, le mec capable de se plier en quatre pour ses potes. Merci particulièrement d’avoir été là pour la préparation de ma soutenance et pour m’avoir écouté et aidé lors des repétitions. sì u tippu più bellu !! Promis je veillerai à ce que la langue Corse soit répandue au Cameroun Merci à toi mémé pour nos folies. C’est çaaa Dugars !! Le bureau n’aurait pas été le même sans toi. Merci pour cette dernière semaine passée à Besançon. C’était bon de te revoir. Josélito merci de nous avoir instauré des instants jungle au bureau et pour nous avoir fait gouter avec Pauline au Mezcal^^. Je t’avoue toutefois que je garde de toi cette image en robe de mariée^^. Adoptée du -116L, je remercie Léa pour son tendre soutien et pour avoir contribué à animer nos pauses du midi et les soirées. Elle a souvent d’ailleurs joué les chauffeurs de taxi pour me ramener du centre ville au Crous. Merci Léa !! Exilée du -116L, mais son amitié ne m’a toutefois jamais fait défaut, Emilie merci pour les cours momentanés de russe et pour m’avoir fait découvrir cette fabuleuse chanson qu’est Thai Na Na de Kazero. Elle aura bien rythmé ma thèse^^. Merci pour tous tes mots d’encouragement lors de la dernière ligne droite. Merci aussi à Souamaya qui est d’une extrême gentillesse. C’était bien ces petits instants tous ensemble au -116L. Merci à vous tous pour ces trois années. Je prie Dieu que nos chemins se croisent encore et encore.
J’ai une pensée pour toutes ces personnes à Chrono-Environnement qui m’ont souvent accordé un peu de leur temps et de leur sympathie : Pierre Nevers, Caroline Schaal, Vanessa Stefani, Catherine Pagani, …..et nos précieux informaticiens Charles-Henri et Jean-Daniel. Val merci pour ta gentillesse. Tu es un chouette gar. C’est toi qui m’as aidé à préparer l’amphi le jour de la soutenance. Je te remercie pour cela et pour plein d’autres trucs. Je n’oublie pas ce merveilleux noel passé chez toi en famille. Tu diras à ton père que grâce à lui j’ai repris goût à la choucroute . Merci à Johanna pour ses prières.
III amour et votre soutien ont été des moteurs durant l’ensemble de mes études. Merci également à Alvine pour m’avoir supporté ces dernières années. Je veux également dire merci à mon oncle Simon Ndebi Bisseg et sa femme Corine pour m’avoir acceuilli chez eux et fait visiter la Suisse en décembre 2016. C’était trop cool !!! Tonton merci d’avoir pris la route rien que pour moi et d’avoir amplement participé au pot de thèse.
Enfin je rends grâce à Dieu le père !!!
IV
Chapter I: General introduction 1
Chapter II: Water sampling strategy, data and analytical methods 5
1. Atmospheric water investigation 5
1.1. Rainwater sampling sites 5
1.2. Rainwater sampling protocols 8
1.3. Satellite dataset 10
1.4. Representativeness of the study period 11
2. Groundwater investigation 13
2.1. Choice and description of sampling points 13
2.2. Sampling protocols 17
2.3. Database 19
3. Analytical methods 21
3.1. Isotopic analyses 21
3.2. Chemical analyses 21
Chapter III: Atmospheric water cycle in the coastal hyper-humid region of Douala:
isotopic study of rainfall at different time-scales 22
1. Physical framework of the West African Monsoon (WAM) 23
1.1. Location 23
1.2. Topography 23
1.3. Spatial distribution of rainfall 24
2. Regional atmospheric circulation
25
2.1. Monsoon and harmattan flows 26
2.2. African “ITCZ” 26
2.3. Oceanic surface 27
3. Meteorological features of Douala 28
3.1. Precipitation 28
3.2. Temperatures 31
3.3. Other parameters 32
4. Article: Identification of the processes that control the stable isotope composition of
rainwater in the humid tropical Western and Central Africa 33
5. Synthesis and final discussion 65
Chapter IV: From rainwater to groundwater. Characterization of subsurface flow by
coupled hydrology-geochemistry approach 67
1. Geomorphology, hydrography and soils 67
V 2.1. The Douala basin: geodynamic evolution from the Pangea to the present 71
2.2. Some tectonic elements of the Douala basin 75
2.3. Litho-stratigraphy and palaeoenvironments of the Douala basin 76
3. Hydrogeological framework 81
3.1. The main aquifers of the Douala basin 81
3.2. Detailed hydrogeological synthesis of the Mio-Pliocene aquifer 87
4. Article: Behaviour of a shallow urban aquifer under hyper recharge conditions and
strong anthropogenic constrains. The case of the Mio-Pliocene aquifer in the coastal
region of Douala (Cameroon). 91
5. Synthesis and final discussion 129
Chapter V: How global changes impact hydrological processes and especially groundwater resources in the humid region of Gulf of guinea and peculiarly in the
megacity of Douala? 131
1. West African coast: location and key socio-environmental problems 132
2. Article: The impact of urban development on aquifers in large coastal cities of West
Africa: Present status and future challenges 136
3. Review of the potential impacts of climate changes on groundwater 149
3.1. Analyses of climate changes effects on groundwater quality: emphasis on the possible changes on the Mio-Pliocene aquifer of Douala Effect of climate
change on groundwater quantity 149
3.2. Analyses of climate changes effects on groundwater quantity: emphasis on the possible changes on the Mio-Pliocene aquifer of Douala 151
4. Synthesis and final discussion 155
Chapter VI: Conclusion, outlook and recommendations 156
1. Summary of results 157
2. Outlook 158
3. Recommendations 159
1
Chapter I
General introduction
Global context: the dynamic environment of the humid tropics
Humid tropics represent the most dynamic environment in the world (Wohl et al. 2012). Convergence of surface trade-wind easterlies and equatorial westerlies within the humid tropics creates deep convection and often cyclonic vorticity conducive to tropical cyclogenesis. Compared with humid temperate zones, the humid tropics are characterized by greater energy inputs in the form of fluxes of water vapour from the mid-latitudes, more intense precipitation, rapid weathering of inorganic and organic materials, and rapid introduction of large volumes of water and sediments (Stallard & Edmond 1983; Liu & Zipser 2008). These regions produce the greatest amount of runoff (Feteke et al. 2002). According to Fosberg et al (1961), they correspond strictly to areas where (i) the mean monthly temperature for at least eight months of the year equals or exceeds 68°F (20°C.); (ii) the vapor pressure and relative humidity for at least 6 months of the year average ~20 millibars and 65% respectively; (iii) the mean annual rainfall exceeds or ranges from 1500 to 2500 mm and; (iv) rain falling all year with at least six months having precipitation ≥75mm each month. In addition, Salati et al (1983) and Lugo and Brown (1991) mentioned that humid tropics are regions where rainfall exceeds evapotranspiration for at least 270 days in a year.
This dynamic is increasing sharply in coastal environments. Indeed, coastal zones are constantly subjected to the effects of energy flows (from tides, waves and swells, wind, solar radiation and rivers) and receive inputs of organic and mineral matter issued from the land and marine ecosystems around it. Moreover, recently, scientific community, politics authorities and non-governmental organizations recognized that coastal areas in the world suffer from sea level rise (Grip 2017).
This description of humid coastal areas dynamics is incomplete without taking into account the human factor. Indeed, humid tropics cover one-fifth of the global land surface and nearly two-thirds of the human population lives and works within 150 km of a coastline (Hinrichsen 1999), placing substantial pressure on coastal areas. Population pressure in developing and low-income countries has led to increasing fragmentation of land cover (through forest cuttings, urbanization and industrialization), with consequent effects on hydrological fluxes (Hansen et al. 2008) from deep groundwater to the troposphere (Wohl et al. 2012). Of particular concern are groundwater system which is an integral element in humid tropical ecosystem (animal-plant-soil-surface water), because of the intimate relationship between
2 surface and groundwater and the frequently shallow groundwater table with abundant phreatophytic vegetation in such environments (Foster & Chilton 1993).
Local context: the region of Douala, a hyper-humid coastal site
The region of Douala (Cameroon, Western Central Africa) concentrates all the features presented above. It is a coastal site near the equator (Figure 1), a port city, a megacity with exponential demographic rate in Western Central Africa, the economic capital of Cameroon with several industries (textile, agro-food, chemistry, glass, cement, wood, fertilizer, etc) and it has one of the highest yearly rainfall amount (~ 4m) in the world.
Figure 1: delimitation of humid tropical areas in Africa (Fosberg et al. 1961; modified). The red surfaces represent mountains which have an elevation of more than 2,000 m. Areas in
black colour are characterised by permanent high humidity (dry periods are almost non-existent) while in regions displayed in grey colour there is a contrast between a drier and a
wetter season. The location of Douala (yellow point) is also plotted.
In this context of population growth, of urbanization and industrialization, access to water is a major challenge for government despite abundant water resources. To cope with the growing demand for drinking water, public authorities of Douala have progressively turned to aquifers (Table 1) which are more protected from surface pollution and require thus less treatment processes. Thus, groundwater accounts nowadays for about 49% (22% and 27% respectively from Paleocene and Mio-Pliocene aquifers) of the total volume of water distributed by the Camwater (Cameroon Water Utilities Corporation) while 51% corresponds to surface water exploitation (Dibamba and Mungo Rives). The Table 1 well summarizes all these information on public water supply at Douala.
3
Table 1: public water supply at Douala. Data sources: Leutou (2010); Ketchemen-Tandia (2011) and INSIGHT BDS (2013).
Exploited water volume of water
dispensed (m3/day)
Percentage in the global water supply Start of operation Surface water Dibamba River 65,000 29 1950 Moungo River 50,000 22 2010 Groundwater Paleocene aquifer 50,000 22 1984 Mio-Pliocene aquifer 60,000 27 1998 Total 225,000 100
However, more than 50% of the population in the Douala region is not registered to the Camwater and therefore is not considered in the public water supply. This part of the population use waters from springs, hand-dug wells and/or private boreholes tapping the Mio-Pliocene. The number of private boreholes and private hand-dug wells is constantly increasing. For instance, Ketchemen-Tandia (2011) revealed that the number of private boreholes in Douala, accounting for 300 in 1996, has been multiplied by ten during the last decade showing firstly the increasing interest on groundwater potential and secondly the increase of water demand due to population growth.
Issue
Since in these humid areas, groundwater is strongly exploited for -and possibly degradated by- human activities, there is an urgent need to increase the knowledge of aquifers functioning. This was pointed out by the scientific community since 1989 and 1999 (UNESCO 1990, 2000) at the first and second International Symposium on Hydrology and Water Resources Management in the Humid Tropics but is still of a great concern. To conduct a sustainable water management, we have to know if the aquifer potential is maintained in terms of quantity and quality, regarding the inadequately controlled exploitation and the poor sanitation network (characteristic of sub-saharan countries, see Banerjee & Morella 2011) in the study region. Moreover, as recharge of aquifers may oper all the year long in such tropical humid regions, this knowledge should include a comprehensive understanding of water fluxes from atmosphere to groundwater and vice versa.
Objectives
Then the main goal of this thesis is, with the help of chemical and isotopical tools, to determine the hydrological and hydrochemical processes that affect water fluxes through the critical zone (land–atmosphere-subsurface continuum) in the hyper-humid context of Douala with particular focus on:
- meteorological factors controlling rainfalls within Western Central Africa and more peculiarly at Douala;
4 - mode, time and rate of groundwater recharge;
- hydrodynamical or hydrogeological conditions of groundwater flow (confined/unconfined, velocity, groundwater flow paths and mixing);
- discharge area of groundwater
- Mio-Pliocene aquifer's vulnerability (quantitatively and qualitatively) to human activities
Document outline
This thesis is organized in 6 chapters. Following this one, the chapter 2 presents the water sampling strategy and the data obtained or collected for this project. In chapter 3, we study the atmosphere dynamic through identification of processes controlling the rainwater isotopic composition. In chapter 4, thanks to information on the input signal, we focus on the hydrogeological functioning of groundwater. Then in chapter 5, we evaluate the groundwater response to human induced changes.
5
Chapter II
Water sampling strategy, data and analytical methods
The general objective of our study is to characterize the hydrological processes that affect the critical zone of a hyper-humid tropical region. Then we decide to study both the atmospheric and groundwater cycles by using water stable isotopes (18O and 2H) and major ions (Cl-, SO4
2-, NO3-, HCO3-, Na+, K+, Mg2+ and Ca2+). Coupling with atmospheric and hydrological data;
the effectiveness of these natural tracers is nowadays well recognized by the scientific community. This chapter is dedicated to present the strategy deployed for the sampling and analysis of rainwater and groundwater in order to answer the main goal of the study.
The atmospheric water cycle was studied using the stable isotopic composition of water vapour and rainwater. We were greatly inspired by the work of Camille Risi (Risi 2009, 2017) and Françoise Vimeux (Vimeux 2011) who used stable isotopes to understand atmospheric processes in various regions in the tropics. Sub-surface hydrology was addressed using isotopic and chemical composition of groundwater in addition to a precise hydrogeological characterisation and water level and flow measurements.
Since a clear description of the methodology will contribute to validate the approach and interpretations developed throughout the manuscript, we present below a description of rainwater and groundwater sampling networks which have been set up or used during the study, sampling and measurements protocols and additional data such as satellite information and hydrological data used for intepretation.
1.
Atmospheric water investigation
1.1. Rainwater sampling sites
In order to characterize the isotopic signal of rainwater, we firstly relied on monthly data of the GNIP (Global Network of Isotopes in Precipitation) station of Douala (Table 2). This latter was installed in June 2006 by the hydrogeology team of the Earth sciences Department (University of Douala, Cameroon). The isotopes measured at this station are oxygen-18 (18O) and deuterium (2H) of the water molecule. Nowadays, it is the oldest existing GNIP station in Central Africa with more than ten years of continuous isotopic record. In this thesis, we use monthly data from June 2006 to December 2016 (which were available at the beginning of this project).
6
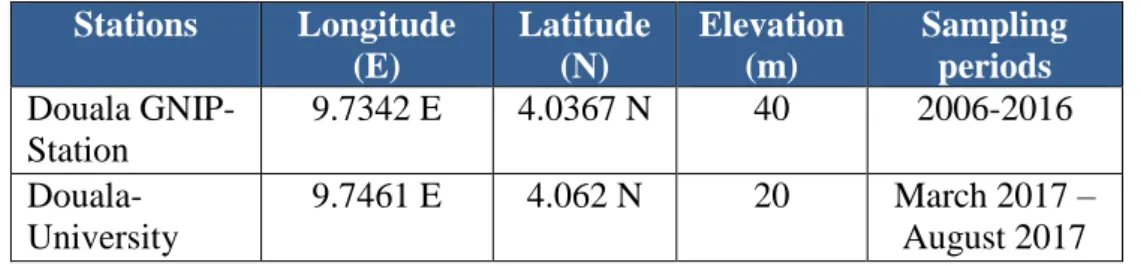
Table 2: location and sampling periods for the different sampling sites at Douala.
Stations Longitude (E) Latitude (N) Elevation (m) Sampling periods Douala GNIP-Station 9.7342 E 4.0367 N 40 2006-2016 Douala-University 9.7461 E 4.062 N 20 March 2017 – August 2017
Regarding its position at the centre of Douala (Figure 2), and its altitude (Table 2) close to the mean altitude of the study area (38 m), the GNIP station of Douala can be considered as representative of the study region.
Figure 2: location of rainwater sampling sites with DEM (digital elevation model) on
background.
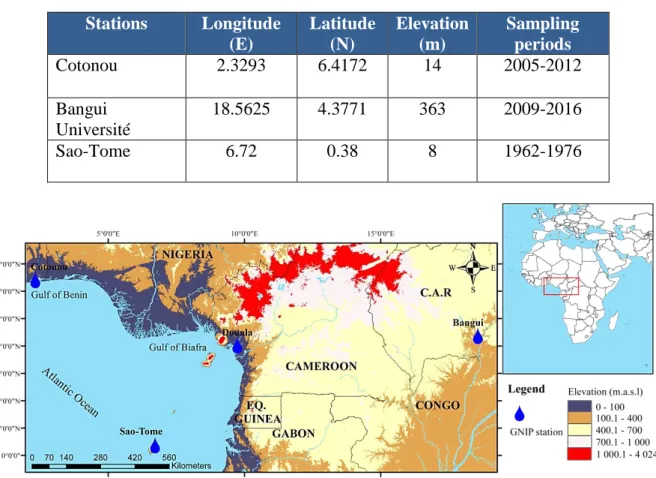
We also used data from other GNIP stations (Table 3) to compare their main features to the ones of Douala and to link their behaviour on a climatological and meteorological point of view, to the regional atmospheric circulation. We selected stations localised either along the western Africa coastline or in the tropical forest region of Central Africa closed to Douala, with an isotopic chronicle, sufficiently long. The three stations indicated in Table 3 match these requirements: Cotonou, Sao-Tome and Bangui (Table 3, Figure 3).
7
Table 3: GNIP stations used in this study in complement to data from the Douala-GNIP
station. Stations Longitude (E) Latitude (N) Elevation (m) Sampling periods Cotonou 2.3293 6.4172 14 2005-2012 Bangui Université 18.5625 4.3771 363 2009-2016 Sao-Tome 6.72 0.38 8 1962-1976
Figure 3: Location of GNIP stations of Cotonou, Bangui, Douala and Sao-Tome.
As for the GNIP station of Douala, the stable isotopes of the water molecule are measured at these stations on a monthly basis. The meteorological settings such as rainfall amount, air temperatures relative humidity and vapour pressure are obtained at the national meteorological centre of each country.
Since individual meteorological events are hidden at a monthly scale, we complete the monitoring network by a specific station dedicated to daily measurements. This station called Douala-University is located 3.5 km NNW to Douala-GNIP (Figure 2), closed to our research building in the University campus in order to monitor it more easily. Measurements begin in March 2017 and last till August 2017 in order to sample the major rainy events for one year. Douala-GNIP and Douala-University stations have been set far away from trees (precisely at a distance corresponding to the double of height of surounding trees), roads, buildings etc. to avoid influence of these elements.
8
1.2. Rainwater sampling protocols
Monthly scale
Monthly samplings achieved in the GNIP stations follow the standard protocols of the International Atomic Energy Agency (IAEA 2012). At Douala-GNIP, samples were collected by using a rain gauge which consists of a plastic funnel coupled with a filter mesh to prevent debris contamination (Figure 4). Approximately 0.5 cm layer of light paraffin oil (available in all chemistries) has been systematically added into the rain collector. Paraffin oil floats on the water sample in the collector and prevents sample evaporation.
Figure 4: Douala GNIP station.
Samples are taken regularly (every week during the dry season and almost every day during the rainy period), so that a GNIP sample represents the total natural precipitation of a calendar month. Each montly sample was stored in a totalizer and kept at 4°C before being transferred in 50 ml amber glasses bottles tightly capped (Figure 5).
Figure 5b: Twelve rainwater samples of one
year ready to be sent to the laboratory.
Figure 5a: Borosilicate glass flask.
IAEA (2012)
Upper cap
9 It is this aliquot part of rainwater which is sent to the International Atomic Energy Agency (IAEA) laboratory, Vienna, Austria for stable isotopes (18O and 2H) determination. We careful mark on the bottle the presence of paraffin oil and at the laboratory, before analyses, removal paraffin oil is proceeded.
The number of samples collected and analysed along the sampling period is presented in
Table 4 as well as those of Cotonou, Bangui and Sao-Tome involved in this study. For these
stations, the data are available on the GNIP database at: https://nucleus.iaea.org/wiser.
Table 4: Number of samples for each sation.
Stations Sampling period Number of samples Cotonou 2005 - 2012 95 Bangui 2009 - 2016 81 Douala 2006 - 2016 106 Sao-Tome 1962 - 1976 123 Daily scale
Daily samples were collected at Douala-University every rainy day as soon as possible after the rain-event by using a Palmex rain gauge (Figure 6) that presents the advantage to avoid evaporation without using medicinal paraffin oil (Gröning et al. 2012).
Figure 6: Scheme of the daily precipitation water sampler (Gröning et al. 2012). Marked in
black, the external plastic tubing around the sampling bottle is dedicated to pressure equilibration and avoids evaporation.
10 Samples are taken in 50 ml amber glasses bottles (presented above) that have been sent after the 6 months campaign to the hydrogeology Department, UMR 6134 SPE of the University of Corsica for isotopes determination.
It should be noted that monthly and daily sampling strategies presents both advantages and disadvantages described in Table 5.
Table 5
: Rainfall monthly monitoring: advantages and disadvantages.
Monthly sampling Daily sampling
Advan
tage
s
Sufficient temporal resolution for groundwater and catchment hydrology
Compliant with any other monthly averaged data
Lower analytical effort and cost (maximum of 12 samples / year / station)
Allows obtaining data at high temporal resolution
Is an appropriate method in hyper-humid area where convective activity is intense (risk of not seeing extreme events is high when accumulating).
Disad
van
tage
s
Can blur significant rainfall events (which may have distinctive isotope values)
Risk of sample evaporation during totalized collection or long storage
Needs permanent observer or highly sophisticated sampling equipment, high cost
Higher analytical effort and cost (considerable number of samples per year/station)
In parallel to isotopic investigation, meteorological data (rainfall amount, air temperatures, vapour pressure, relative humidity and evaporation), at monthly and daily scales (only for 2017) are continuously collected at the meteorological service of Douala from the station which present the followed coordinates: 04°01’N, 09°42’E and an altitude of 25m. Thanks to this data collection, we have 65 years of monthly rainfall amount data (between 1951 and 2016), 45 Years (1971-2016) of data on monthly air temperatures and more than 20 years of vapour pressure, relative humidity and evaporation data.
1.3. Satellite dataset
In addition to field measurements, data from satellite have been integrated in this project. The combination of these different dataset aims to make our study robust and will be helpful for the understanding of the regional atmospheric circulation since information provided by satellite cover generally a large area.
TES (Tropospheric Emission Spectrometer): measurements of water vapour isotopic content With the advent of new technology in stable water isotopes, it has become easier to analyze isotopic composition of water vapor from measurements within satellite (Aemisegger et al. 2012). Thus, TES instrument on board on the Aura satellite is a nadir-viewing infrared Fourier transform spectrometer from which the deuterium content of water vapor (δDv) can
11 be retrieved (Worden et al. 2006; Worden et al 2007). In this project, we used δD values acquired at 900 hPa (closest data from the soil/sea surfaces) from 2004 to 2008, period in which both isotopic and TES data (covering the study area) are available. More details can be found in the section 3 of chapter III.
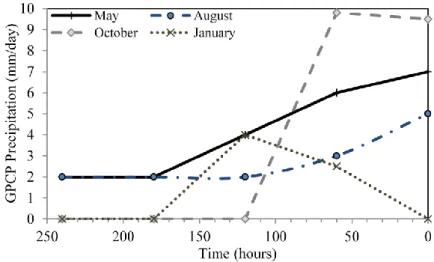
GPCP and SAFNWC products: information on intensity and organization of convection Convective activity prevails in the tropics and impacts isotopes variation in rainwater. Its effects have been analysed using the Global Precipitation Climate Project (GPCP; Huffman et al. 2001) data and cloud type (CT) products issued from geostationary MSG (Meteosat Second generation; Derrien & Le Gléau 2005).
GPCP data were retrieved from the National Oceanic and Atmospheric Administration (NOAA) website (https://www.esrl.noaa.gov/psd/cgi-bin/data/composites/printpage.pl). These data used both for monthly and daily analyses, allows the evaluation of convection intensity and its control on rainfall isotopes.
The organization of convection in the region (and its influence on precipitation isotopes), have been assessed by using CT products developed by SAFNWC (Satellite application facilities in support to nowcasting) /MSG algorithms (for more information see http://www.nwcsaf.org/web/guest/scientific-documentation).
More details concerning these datasets are presented in the section 3 of chapter III.
1.4. Representativeness of the study period
Since the measurement period is different from one station to another, to validate our interpretations and to generalize them, we must evaluate the representativeness of these periods in relation to the normal ones. (Figure 7). The difference between the normal (3846.7 mm) and the mean rainfall (3717.1 mm) amount recorded during the GNIP sampling period do not exceed 3.5% at Douala. This low value highlights the great representativeness of the GNIP sampling period at Douala for climate study and therefore, interpretations that we will formulate below, will not be limited to a restricted timescale. However, at Cotonou, Bangui and Sao-Tome, a large difference of respectively 9.3%, 22.1% and 12% exists between the normal and the mean rainfall amount over the GNIP sampling periods. Thus for these stations, interpretations should be reported to the study period and any extrapolation to a larger period should take into account this lack of representativeness of the meteorological parameters.
12
Figure 7: Average annual rainfall for each station compared to normal (over 30 years).
We also checked the representativeness of monthly GNIP measurements at Douala month by month. Monthly precipitations recorded during the GNIP monitoring from June 2006 to December 2016 are mostly in the range of ± 5% relative to the normal (Table 6). Only the months of January, May and July show a deficit of 29, 15 and 17% (Table 6). This can be explained by the low number of samples in January and by relative dry conditions in May and July compared to the normal conditions. However, in November and February, up to 24% more precipitation is observed (Table 6). Finally, for the majority of months, the gap between the normal and measured rainfall amount is weak. For a study at a seasonal scale, we can consider that the data covering the study period are representative of the climate context at Douala.
Table 6: comparison of normal (over 30 years) and measured rainfall amount during the
study period from June 2006 to December 2016. The gap is the difference between the two measures and n is the number of GNIP samples collected.
1 2 3 4 5 6 7 8 9 10 11 12 Monthly normal (mm) 41 66 173 242 280 445 668 742 618 400 144 34 Mean monthly GNIP precipitation (mm) 29 82 170 240 237 463 556 716 633 383 178 33 Gap (%) -29 + 24 -1.7 -0.8 -15 + 4 -17 -3.5 +2.4 -4 +24 -3 n 4 6 7 9 10 11 11 11 10 10 10 7
Furthermore, we note that the number of samples often varies from one month to another (Table 6). This is due to the lack of rain during certain periods. Moreover, samples which have been subject to evaporation (resulting of sampling or rainwater storage which does not respect the protocol) have not been considered.
0 500 1000 1500 2000 2500 3000 3500 4000
Cotonou Douala Bangui Sao-Tome
Measurement period Normal
13 Concerning the daily data, the 70 samples collected between March 2017 and August 2017 give a total rainfall amount of 2054 mm which account for about 55 % of the annual average rainfall recorded during the 11 years monthly monitoring at Douala GNIP station attesting the representativeness of this sampling period.
2.
Groundwater investigation
2.1. Choice and description of sampling points
Sampling points were at first selected to obtain a relative good distribution throughout the Douala region. Sampling points are however concentrated in the urban centre of Douala (Figure 8) where there is the maximum of wells used by households and industries. The following criteria were considered for the choice of points:
- we ensure that the identified well (hand-dug well or borehole) taps the target aquifer for this study
- accessibility of wells (hand-dug wells and boreholes),
-
existence of protective measures against surface pollution and the fact that the well is used by the local population,-
boreholes must have basic information such as drilling log.Figure 8: sampling map.
In addition, we made the effort to have one sample per neighbourhood. So by applying all these criteria, we sampled water in 48 wells (28 boreholes and 20 hand-dug wells) and 10 springs. Unlike many previous works, we selected bore wells with water table as far away to the soil surface in order to avoid eventual influence of surface pollution and capture the natural geochemical background of water.
14 Borehole
Boreholes in the study area are often equipped with foot, hand pumps or directly connected to a faucet (Figure 9). They are used by industries and population for drinking water and domestic uses. The depth of sampled boreholes varies from 45 m to 140 m. The only disadvantage of this engineering structure in Douala is that they are most of the time screened at several depths. This can complicate the understanding of groundwater flow and hydrochemical processes which take place within the aquifer.
Figure 9: some types of boreholes in the region of Douala.
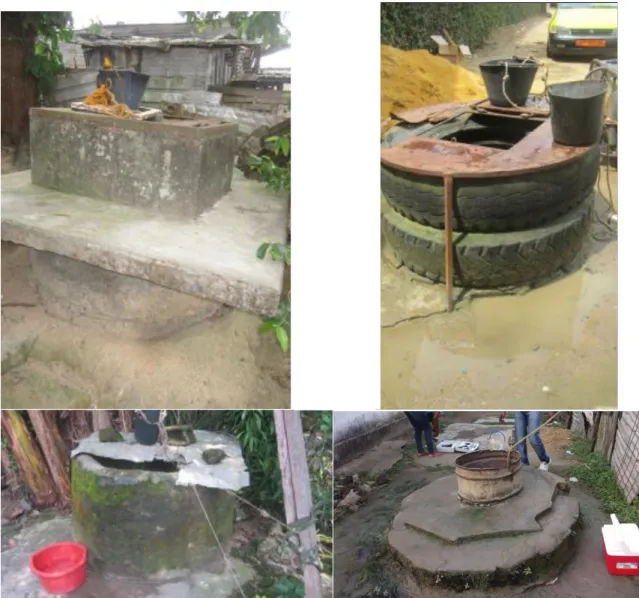
Hand-dug wells
They are usually called traditional wells and have depths varying between 1 and 17 m. People generally use it only for domestic uses (e.g. laundry and housework). The types of hand-dug wells encountered at Douala are presented on Figure 10. The well-coping (cemented, made of sheets metals or wheels of trucks) when they exist often reach 0.5 m. There are no protection zones but wells openings have lids to protect water from occasional pollution from external sources. The great disadvantage of hand-dug wells lies in their maintenance. The walls of these wells are poorly cemented, so that they crumble easily, under the action of infiltration of runoff water. Moreover, we often found in the wells the presence of tree roots.
15
Figure 10: types of hand-dug wells in Douala.
Springs
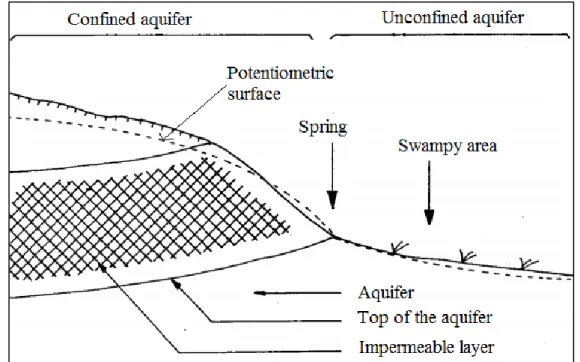
Springs encountered at Douala are located at the bottom of steep slopes, bordering important marshy areas. These emergences called overflow sources (GRET 1987) are due to the intersection of the upper surface of an impermeable layer with the topographic surface. A conceptual scheme is presented in Figure 11 and we can see on Figure 12 some pictures of sources in Douala. These latter are arranged in a simple way using a pipe through which water flows (Figure 12).
16
Figure 11: conceptual scheme of an overflow spring (modified from GRET 1987).
17 Despite their general difficult accessibility, water from springs is used in Douala both for domestic uses and drinking water.
2.2. Sampling protocols
Sampling has been carried out in February 2017 during 12 days. We choose to perform the sampling at this time corresponding to the “dry season” in Douala, because
(i) the study region undergoes almost continuous rainfall during the year. The existing dry season is not strong (more details in Chapter III) and therefore we supposed that the groundwater is recharged along the year;
(ii) we expected to observe the real geochemical signature of groundwater without external influences at this time period. Indeed, Douala is submitted to a very long rainy season lasting from March to November (see chapter 3) with a peak in July-August. During this period of July-August, rainfall amount is higher than 1 m, grounwater table is close to the soil surface, blending with runoff and renewal of groundwater corresponds to a mixing with various leachates mobilized by the important water fluxes. Therefore, we estimated that the water sampled at this time would not be representative of the aquifer itself. This second fact motivated us to make one sampling campaign instead of two as usually done in hydrogeology studies;
(iii) many authors in similar climate contexts previously show that there is no significant difference in groundwater geochemical signature between the dry and the rainy season (e.g. Djebebe 2014, Ngo Boum et al. 2015 and Emvoutou 2018).
A sampling day was conducted from morning (~08 AM) to early evening (~05 PM) with temperatures ranging from 23.5 ° C to 34.8 ° C.
All the different field measurements can be summarized in the following way for each sampling point:
(i) Well purging (for wells)
This procedure concerns both boreholes and hand-dug wells. The purging allows draining the stagnant water from the well to obtain a sample that represents groundwater from the aquifer. However, assuming the fact that wells in Douala are daily used for domestic supply, it was considered that there is no stagnant water within the well and that their purge is already achieved.
(ii) Taking geographical coordinates
By using a Garmin GPS, longitude and latitude has been recorded. The altitude (Z) was determined further on Arc Gis, software dedicated to cartography.
(iii) Measurement of groundwater table
The depth of water in the well relative to the soil surface i.e groundwater table (h) has been measured by using a potentiometric probe (Figure 13). Thanks to this measure, the potentiometric surface (H) has been calculated through the equation 1.
18
Figure 13: measurement of water table in a hand-dug well.
(iv) Measurement of physicochemical settings (pH, Electrical Conductivity, Temperature and Dissolved Oxygen)
It was performed by using a WTW 2FD46G multi-parameter kit. These measurements have been carried out for non-stagnant water in a beaker. They have been validated only after all the in situ parameters reached the stability for three consecutive measurements separated by 5-minute intervals.
(v) Rinsing of sampling bottles (for chemical and isotopic analyses) with water to sample (3 to 4 times)
(vi) Filling two polyethylene bottles of 30 ml dedicated to cations and anions analyses through 0.45μm syringe filters (Figure 14). Samples for cations were acidified with ultra-pure nitric acid (HNO3)
(vii) Filling amber glass bottles (presented above in rainwater sampling) without filtration for stable isotopes analyses.
(viii) Bicarbonates measurement
Here we used the method of titration with sulfuric acid solution and coloured indicator (bromocresol). This latter is added in 100 ml of water. The titration by H2SO4 is then done gradually and HCO3- content is determined when the sampled
water turns from green to pink colour. The detection threshold for this method is 0.1 mg/l CaCO3 (Stumm & Morgan 1996).
19
Figure 14: water filtration during sampling;
Figure 15 summarizes all the equipment deployed for this fieldwork.
Figure 15: Field equipment.
At the end of the measurements and sampling, the samples were kept cool in ice boxes before shipment to the laboratory for analyses of major ions and stable isotopes.
2.3. Database
Figure 16 well summarizes the methodology developed for groundwater investigation.
Long-term monthly meteorological data (monthly rainfall, air temperature and evaporation rate) acquired at the meteorological service of Douala (Cameroon) and GNIP dataset represent the input of the database which has been constructed in order to understand subsurface hydrology of the study region.
Data concerning the base flow (such as runoff) and the soils properties was compiled from previous works (Ndome 2010; Emvoutou 2018).
Potentiometric probe Device measure of Eh pH meter Conductimeter HNO3 Amber bottle (20 mL) for δ18O and δ2H
Bottle (30 mL) for major ions analyses
Pipette for the use of HNO3
Beaker Syringe for water filtration
20 Drilling logs and hydrodynamics parameters (transmissivity, discharge flow, permeability and storage coefficient) which are collected from drilling companies by the hydrogeology team of the Earth Sciences Department (University of Douala) since several years constitute the third element of our database for this project.
Chemical data on aquifers (and more or less from surface water) compiled from studies on groundwater quality (Eneke et al. 2010; Kopa et al. 2012; Ngo Boum et al. 2015; Fantong et al. 2016; Tatou et al. 2017; Ketchemen-Tandia et al. 2017 and Wirmvem et al. 2017) have also been integrated firstly to have an overview of issues on groundwater resource in Douala and secondly to identify an evolutionary trend in some chemical species.
Coupled with measurements carried out in February 2017 in the framework of this thesis, all this dataset will provide insights on hydrogeology of Douala.
Figure 16: hydrogeological work’s structuration. Selection of sampling points
Bibliography:
Collection of historical data (water chemistry, water isotopes, water table, etc.) trhough previous studies
Sampling:
Collection of 58 groundwater samples in February 2017 and 106 monthly rainwater samples from 2006 to 2016
Laboratory analyses:
Major ions (K+, Na+, Ca2+, Mg2+) and stable isotopes (18O and 2H)
Data handling
Constitution of the Database:
Meteorological parameters (monthly rainfall amount and monthly air temperatures),
GNIP dataset (δ18O and δ2
H),
Hydrological parameters (runoff, soil water storage and discharge flow of local rivers.),
Hydrogeological information (drilling logs, aquifer transmissivity, aquifer discharge flow, aquifer permeability, storage coefficient and historical data on water table
variation)
Groundwater chemical and isotopic data (and to a lesser extent those from surface water).
21
3.
Analytical methods
3.1. Isotopic Analyses
Analyses have been performed at the isotope hydrology laboratory of IAEA in Vienna (Austria) for monthly rainwater and at the hydrogeology department, UMR 6134 SPE of the University of Corsica (France) for daily rainfall and groundwater samples.
Delta (δ) and standard concepts
The isotopic composition of water is given by the ratio (R) of the heavy isotope on the light isotope (equation 2). Since the heavy isotope is very rare, this ratio is very small. The isotopic ratios of the water molecule are compared to the isotopic ratio of a standard water of known isotopic ratio (equation 3). The Vienna Standard Mean Ocean Water (VSMOW) is the most widely used standard
Thus, measurements in stable isotopes are usually done differentially using abundance ratio R (equation 2) compared to a standard (equation 3). Finally, in order to facilitate calculations, isotopic abundances are expressed in δ per mil (‰).
R = 18O/16O or R = 2H/1H (2)
δ = [(Rsample/RVSMOW) - 1] * 1000 (3)
Analytical protocol
Isotopic contents have been determined using a Los Gatos DLT-100 laser isotope analyser following the method described by Aggarwal et al (2006) and Penna et al. (2010). The fourth generation off-axis ICOS (Integrated Cavity Output Spectroscopy) technology incorporated in this equipment yielded higher precision and reduced measurement time compared to conventional cavity ring down spectroscopy (CRDS; Aggarwal et al. 2006). The quality of the isotopic analysis was checked using a standard deviation condition up to 1‰ for δ2
H and up to 0.1‰ for δ18
O.
3.2. Chemical analyses
These measurements were conducted at the Hydrogeology Department, UMR 6134 SPE of the University of Corsica, France. The contents of ions: anions (Cl-, SO42-, NO3-) and cations
(Na+, K+, Mg2+ and Ca2+) concentrations were determined by ionic chromatography using a Dionex ICS 1100 chromatograph. The quality of the chemical analysis was checked by calculating the ionic balance error. Analyses were rejected if the ionic balance error was greater than 5 %.
22
Chapter III
Atmospheric water cycle in the coastal hyper-humid region of Douala:
isotopic study of rainfall at different time-scales
Wohl et al (2012) reported that in the context of land use and climate changes, the processes that operate within the hydrological cycle are expected to accelerate as temperatures rise and the capacity of the air to carry moisture increases. By having greater energy inputs and faster rates of change this fact is most relevant in humid tropics (Wohl et al. 2012). Unfortunately, the understanding of hydrological cycle is still limited in these areas and peculiarly in humid regions of West Africa -while during the last decades we recorded a lot of works in arid or semi-arid region (e.g., Celle-Jeanton et al. 2001; Risi et al 2008b, 2010 and Tremoy et al 2012) - and relies heavily on model-based scenarios rather than observations (e.g., d’Orgeval et al. 2008; Stanzel et al. 2018). Of particular concern when we talk about hydrological cycle are the processes involved in the atmosphere. The atmosphere is an essential hydrological environment; the major place regulating the transfers and exchanges for the global functioning of the Earth system.
The use of water stable isotopes, both δD and δ18O has provided insights in the study of
atmospheric water cycle (e.g., Rozanski et al. 1993, Araguas-Araguas et al. 2000,
Celle-Jeanton et al. 2004). Precipitation stable isotopes are efficient tools to determine the origin of water vapour, identify the evaporation processes, the incorporation of recycled atmospheric moisture, and/or the possible mixing between isotopically distinct reservoirs. Moreover, efforts have been made recently to measure the composition of atmospheric water vapour by
satellite (Worden et al 2012).
Thus, thanks to isotopic monitoring of rainwater at different timescales and isotopic data from satellites on water vapour, this study aims to investigate the processes involved in the atmospheric water cycle in the Western Central Africa region with a specific focus on Douala
(Cameroon). The chapter firstly begins with a clear description of the atmospheric circulation
in Western Africa and then presents the meteorological parameters measured at Douala in order to give the context of the results submited in Journal of Hydrology in 2019.
23
1. Physical framework of the West African Monsoon (WAM)
1.1. Location
West Africa belongs to the intertropical domain and can be defined as being situated in latitude, between the equator and the southern fringe of the Sahara (about 20°N), and, in longitude, between 18°W and 20°E (eastern border of Lake Chad; Figure 17). This region appears as an important continental incursion into the tropical Atlantic (Figure 17). Since the mainland has the ability to heat up and cool faster than the ocean, there is then, on the spindle 18°W-10°E, a contrast between continental and oceanic surfaces. This meridian land / sea asymmetry has an important consequence on precipitation regimes and the distribution of atmospheric and oceanic fields (Chapter III sections 2 and 3.1).
1.2.Topography
The West African relief is quite simple (Figure 17). The topography is composed of plateaus, mountainous massifs, large plains and tabular spaces of low altitude (about 200 m). Plains characterize the littoral border, whereas, inland is mainly dominated by tabular spaces. The mid-altitude plateaus and mountains are located at the south-west, south-east and north-east margins of the region. The highest mountain ranges of Western Africa are: the Hoggar massif (> 2900 m), the Tibesti chains (> 3400 m) and the Mount Cameroon (> 4000 m at 70 km SW of Douala). This simplified topography explains, to a large extent, the meridian arrangement of precipitation (Figure 18). However, it is not excluded that despite its low relief (average altitude of 400 m) compared to other monsoon regions (e.g. Himalaya), the West African orography has an impact on regional atmospheric circulation. Drobinski et al. (2005) showed, for example, the role of the Hoggar Massif (7.5°E 25°N) in triggering the African monsoon. In the Gulf of Guinea, Suchel (1988) underlined the role of the Mount Cameroon (>4000 m) as a pluviogenesis factor by promoting air mass elevations and thunderstorm activity in the region.
24
Figure 17: Topography of West Africa. The location of Douala (represented by the yellow
point) and the mains massifs is highlighted.
1.3.Spatial distribution of rainfall
On a large scale, the rainfall gradient increases in a N-S direction. Sub-Saharan West Africa has a strong annual precipitation gradient with cumulative rainfall ranging from about 100 mm (northern fringe of the Sahelian zone) to more than 2500 mm in the SW part of the region close to the Mount Cameroon (Figure 18). Indeed, in this region, we record exceptional annual rainfall amount. Territories on the western slope of the mountain receive between 6000 and 11000 mm of rainfall per year while those on the eastern slope (including Douala) record only 2500 to 6000 m (Suchel 1988). Indeed, the humidity transported from the equatorial Atlantic, via the monsoon flow, makes that the part of the relief facing the winds is very watered.
25
Figure 18: Spatial distribution of average annual rainfall amount (in mm) in West Africa over
the period 1968-2002. This map was established by Louvet (2008) from monthly CRU (Climate Research Unit) data (0.5° x 0.5°).
2.
Regional atmospheric circulation
Atmospheric circulation in West African coast is organized around some key elements (Figure 19), notably in low layers: sea surface temperatures (SSTs) and the convergence between Monsoon flow (South-West) and Harmattan (North-East).
26
2.1.Monsoon and harmattan flows
The anticyclones of Azores in the northern hemisphere and Saint-Helen in the southern hemisphere are the two belts that affect directly the atmospheric dynamic and tropical climates in West Africa, with the first largely overrunning during the boreal winter (Figure 20). The northern high pressure cell tends then to disappear over West African coast areas especially during the summer season, although it remains in altitude between 500 hpa and 700 hpa above the Sahara Desert. It has the characteristics of being a cell of subsidence and divergence with remarkable dryness (Laing and Evans 2011). The surface of the northern circulation cell flows generally from NE and tends to curve to the west, responding to the anticyclone curvature (Figure 20). This northeast trade wind is a continental air mass called harmattan. Above the Atlantic Ocean it is generally stratified with a slightly lower wet and cool layer. During the boreal spring, the wet layer becomes thicker over the ocean, with decreasing stability in the atmosphere and increasing intensity and frequency of rainfall. A major thermal gradient directed towards the north then takes place and is accompanied on the continent by the migration of a thermal depression which is positioned above the superheated low levels. The SE trade winds coming from the southern hemisphere are then strengthened enough to reach the northern hemisphere. Once the equator is crossed, these moisture laden winds are deflected by the horizontal component of the Coriolis force to form the southwestern "monsoon flow". This flow brings moistured air to the continent, what is necessary for cloud convection. It is the main cause of precipitation, development of cumulonimbus with strong vertical development and convection. Further, the intensity and the energy of the monsoon flow will be decisive for its positioning on the continent.
Figure 20: position of the ITF in Africa for January and July (Olivry 1986). The location of Douala is represented here by the red point.
2.2. African “ITCZ”
The convergence between Harmattan and monsoon flows marks the location of the InterTropical Front (ITF, Adefolalu 1983) which represents the ground track of the ITCZ. This dynamic system corresponds to a vertical upward flow and is characterized by a low intertropical atmospheric pressure derived from the trade wind convergence (Figure 20).
Equator
Tropic of Capricorn Tropic of Cancer
27 Since dry air from the north and humid air from the south meet, it is an area of conflict between north-eastward continental and south-eastward oceanic wind flows, and therefore a region of major turbulence. The ITCZ is responsible for the zonal organization of annual rainfall in West Africa (Figure 18). Its annual movement follows the sun's zenith. Between April and the end of June, the ITCZ is positioned above the Guinean coast (~5°N), resulting to the first rainy season in this region. Then, during the first half of July, it moves rapidly to the north and reaches relatively ~11°N, corresponding to the establishment of the rainy season in the Sahelian regions. ITCZ stays on this latitude until the end of August, and then descends gradually to the south, crossing over the Guinean coast and resulting in another rainy season in this region. In consequence, the northern semi‐arid regions experiences precipitation only during summer while the coastal guinea areas present two rainy seasons in spring and autumn. The abrupt rise of the ITCZ to the north contrasts with its withdrawal, which appears to have a more steady progression southward.
Figure 20 provides positions of ITF and Harmattan/monsoon flows in January (southernmost
position) and July (when it tends to reach its northernmost location).
2.3. Oceanic surface
The eastern equatorial Atlantic has a very marked seasonal cycle (Wauthy 1983), having an influence on Western Africa rainfall regime (Mitchell and Wallace 1992; Gu and Aldler 2004). Figure 21 shows the monthly sea surface temperatures (SSTs) variation at 5°W. Generally, SSTs are warmer in March-April from 50°W to 10°E. The transition from warm to cold temperatures takes place from May to June with a more intense cooling from June to August. Indeed, SST decreases by 5°C to 7°C at this period and the minimum values are located between 1°E -5°E and roughly 4°S - 1°N (Marin et al. 2009; de Coëtlogon et al. 2010; Giordani et al. 2013; Figure 21). From August to December, the ocean warms up again. Warm SSTs correspond to spring and autumn rainfall periods in Gulf of Guinea. The onset of the cooling developed southerly to the equator is well correlated to the abrupt northward shift of the ITCZ in July (Picaut 1983; Colin 1989; Waliser and Gautier 1993). The intensification of the “cold tongue” in the Atlantic Ocean increases the contrast of air temperature between the Gulf of Guinea and the Sahel, which in turn accelerates, onshore, south-to-north near-surface winds. Indeed, the recent trends of Sahel drought are attributed to high SSTs, which favours the establishment of a deep convection zone over the ocean and weakens the convergence of the monsoon flux over the continent (Giannini et al. 2003). On the other hand, the cold tongue drives the convection zone northward and inhibits Western African precipitation in almost part of Gulf of Guinea (Okumura and Xie 2004). However, in the Gulf of Biafra (Figure 17), between 2°N and 4°N and 5°E-10°E, SSTs remain sufficiently high to maintain convection in Douala (Figure 21).
SSTs variations are due to the formation of equatorial upwelling (Merle et al. 1980; Picaut 1983; Weingartner and Weisberg 1991). The origin of this equatorial upwelling is generally attributed to the divergence of ocean’s currents along the equator (Philander 1990). However, the upwelling can also be explained by a vertical oceanic mixing (Peter et al. 2006) or Kelvin equatorial waves (McCreary et al. 1984).
28
Figure 21: Mean climatological SSTs (°C) from 2001 to 2006 (Jouanno 2011): (a) horizontal distribution in August and (b) time–latitude distribution at 5°W.
3. Meteorological features of Douala
3.1.Precipitation
Rainfall regime
Douala is the wateriest urban centre after Monrovia (Liberia) in Western Africa. It receives exactly on average, 3854.3 mm of rain per year (standard deviation = 464.4 mm; weather data from 1951-2016).
According to the ombrothermal diagram presented in Figure 22, the megacity of Douala has a long rainy season from March to November, and a lesser wet season from December to February. Compared with other humid areas in the region of the Western and Central Africa such as Cotonou (Benin), Bangui (Central African Republic), and Sao-Tome (Sao-Tome and Principe), which present a relative long dry period respectively of 5, 7 and 8 months, Douala appears as a hyper-humid region.
The unimodal rainfall regime observed in Douala, is also atypical. In the whole part of the Gulf of Guinea, the bimodal regime is a more common feature (see for example at Sao-Tome and Cotonou; Figure 22). This particularity of Douala is related to the interaction between the southwestern African monsoon wind (SW monsoon) and the geography/topography of the region. Firstly, the concave shape of the Cameroonian coast at Douala, perpendicular to the southwestern monsoon winds, induces a convergence of these winds. The same pattern is observed on the Liberian coast.
29
Figure 22: Ombrothermal diagram of Douala (Meteorological data are ranged from 1951 to
2016 (1971-2016) for rainfall (temperatures). We also provide those of Cotonou (Benin), Bangui (Central African Republic), and Sao-Tome (Sao-Tome and Principe).
0 50 100 150 200 250 300 350 0 100 200 300 400 500 600 700 1 2 3 4 5 6 7 8 9 10 11 12 Douala Precipitation 2*Temperature 50 51 52 53 54 55 56 57 58 0 50 100 150 200 250 300 350 400 450 1 2 3 4 5 6 7 8 9 10 11 12 Cotonou 50 51 52 53 54 55 56 57 0 20 40 60 80 100 120 140 160 180 200 1 2 3 4 5 6 7 8 9 10 11 12 Bangui 47 48 49 50 51 52 53 0 20 40 60 80 100 120 140 160 1 2 3 4 5 6 7 8 9 10 11 12 2 * T em p era tu re ( °C) Ra in fa ll a m o u n t (m m ) Months Sao-Tome
30 Secondly, the Mount Cameroon (~ 4000 m; ~70 km at the southwest of Douala) constitutes an obstacle to the southwestern winds precited and induces orographic ascents of an extremely hot, humid and therefore unstable air. These air mass convergence and orographic airlift are more significant if the monsoon flow is intense and thick as it is the case during the summer monsoon season, when the ITCZ is far up to North and the monsoon is well developed. This contributes to explain the unimodal nature of the rains at Douala.
In summary, the specificity of the Douala’s climate is linked to: (i) SSTs that remain sufficiently high during the summer in the Gulf of Biafra (Figure 21) favouring atmospheric convection; (ii) the concave shape of the Cameroonian coast at Douala, perpendicular to southwesterly monsoon winds (Figure 20) and (iii) the influence of the Mount Cameroon (Figure 17).
The specificity of rainfall distribution is also reflected by a significant occurence of rainfalls during the night (Tsalefac et al. 2003). According to Vondou et al (2018), this could be due to the propagation of convective systems that are generated on the continent, during the afternoon. However, it could also be associated to the strengthening of convergence on the sea and the coast, at night, due to the replacement of sea breezes by land breezes (Leduc-Leballeur 2012).
Inter-annual precipitations
The inter-annual evolution of precipitation between 1951 and 2016 (Figure 23) shows a strong variation with a general downward trend. We observe a wet phase (average of 4157.6 mm) from 1951 to 1981 characterized by rainfall above the inter-annual mean (3854 mm) and a less humid or "deficit" phase from 1982 to 2016 (average of 3570.5 mm), marking a long period with precipitation below the average inter-annual value.
Figure 23: inter-annual evolution of rainfall (mm) in Douala (1951 to 2016).
2500 3000 3500 4000 4500 5000 5500 1950 1960 1970 1980 1990 2000 2010 2020 Ra in fa ll a m o u n t (m m ) Year Mean rainfall amount for 1951-1981
inter-annual mean rainfall amount
31
3.2. Temperatures
The monthly temperature distribution is relatively uniform at Douala. The annual average over 44 years is 27°C (standard deviation = 0.3), with a minima of 25.4°C in August and a maxima of 28.6°C in February (Figure 24); giving a thermal amplitude of 3.2°C on average.
Figure 24: average monthly temperatures (°C) in Douala (1971-2016)
Between 1971 and 2016, there is a slight increase in annual average temperatures (Figure 25) corresponding to approximately +0.02°C/year.
Figure 25: inter-annual evolution of temperatures (°C) in Douala (1971 to 2016).
25 26 27 28 29 1 2 3 4 5 6 7 8 9 10 11 12 A ir tem p era tu re ( °c) Months increase of +0.02°C/year 26 27 28 29 1970 1980 1990 2000 2010 2020 A ir tem p era tu re (° C) Year