Support Information
Separation and Identification of Microproteins in the Mouse Brain using Top-down Method with High Resolution Nanocapillary Liquid Chromatography
Mass Spectrometry
Wenxue Li1, Filomena Petruzziello1, Nan Zhao2,Huiyuan Zhao2, Xueting Ye3, Xiaozhe Zhang2* and Gregor Rainer1
1 Visual Cognition Laboratory, Department of Medicine, University of Fribourg, Chemin de Musee 5,
Fribourg, CH-1700, Switzerland
2Division of Biological Technology, Dalian Institute of Chemical Physics, Chinese Academy of
Science, Zhongshan Road 457, Dalian, China.
1 Experiment section
1.1 Materials
Optima grade acetonitrile was purchased from Thermo Fisher (New Jersey, USA). Formic acid (MS grade) and acetic acid (Chromatographic grade) was purchased from Fluka (Buchs, Switzerland). Pure water was prepared by GenPure system (TKA, Niederelbert, Germany) in house. Siliconized centrifuge tubes (2ml) were purchased from Eppendorf (Hamburg, Germany). Microcon centrifugal filter devices (Vivacon 500) were purchased from Sartorius AG (Goettingen, Germany). All samples were analyzed in a Dionex nanoLC (Dionex, Thermo Fisher, Sunnyvale, USA) tandem LTQ-Orbitrap Elite (Thermo Fisher scientific, Bremen, Germany).
1.2 Brain samples
The samples were derived from eight healthy mice C56BL/6 (male and female) brain tissues, and after sacrificed, the brain was removed immediately and then stabilized by using heat irradiation (Denator AB, Gothenburg, Sweden) as described elsewhere [1]. The denatured brain tissue was kept in the liquid nitrogen a few minutes and then stored in an -80 °C fridge until analysis. The animals were housed under constant temperature and humidity with free access to water and food. All procedures with live animals were conducted with protocols approved by the cantonal veterinary office of Fribourg, Switzerland.
1.3 Samples preparation
The extraction method was based on our previous publication [2] and restricted temperature control was used to minimize the degeneration of microproteins and endogenous peptides. All samples were extracted by aqueous solution and organic solution and then mixed on column. Each sample was extracted twice as follows: 0.2% acetic acid aqueous solution and 30% acetonitrile containing 0.2% acetic acid solution. The extraction solution was 5 µl per 1mg brain tissue. The sample was added to the
solution and homogenized twice within 1min by a Precellys 24 homogenizer (Bertin Technologies, Montigny-le-Bretonneux, France), and then ultrasonicated (100 kHz) for 10 min at room temperature. The sample was centrifuged at 20000 g for 1 h at 4 °C for each step and collected the supernatant, respectively. After extraction, the supernatant was filtered on a 100-kDa cutoff filter (Vivacon 500, Sartorious AG, Goettingen, Germany) by centrifuging 90 min at 14000 g at 4 °C. The usage of organic solvent in the extract buffer was demonstrated to be necessary to improve the recovery of large peptides in injection, separation and storage [3].
1.4 LC-MS data acquisition
The extracts from the brain tissue were separated and analyzed by Thermo Scientific LTQ-Orbitrap Elite tandem the Dionex nanoLC. The trap column (150 µm inner diameter and 3 cm long) was packaged with ReproSil-Pur C18 300Å particles (5 µm, Dr. Maisch GmbH, Ammerbuch-Entrigin, Germany) and installed in a peak holder (Upchurch, Oak Harbor) in the 10-port valve. The analysis column was packaged with same media but different size (3 µm, 25 cm bed length). The organic extracts were injected into a trap column first, and after 5 min the aqueous extract were also injected and both extracts were eluted together through the nanoLC-MS system and detected. In load method, the samples were enriched in the trap column with the 2% acetonitrile and 98% water containing 0.2% formic acid for 5 min. In injection method, the trap column was reversed and eluted when it was switched to couple with the analysis column. The injection volume was 5 µl and per sample running almost 90 min.The analysis column was packed with C18 (3 µm, 300 Å; Dr. Maisch GmbH, Ammerbuch-Entrigin, Germany) in a Picofrit capillary with an emitter tip of 10µm (New Objective, Cambridge). The mobile phases A and B in NC pump were 0.2% formic acid aqueous solution and 95% acetonitrile containing 0.2% formic acid, respectively. The analysis column was eluted at 300nl/min using following gradient: 5% B at start, 20%B at 35 min, 40%B at 55 min, 60%B at 65 min, 90%B at 65 min, 90%B at 80 min. The valve was switched to loading states and equilibrating the column at 80 min as 5% B for another 10 min.
All data were obtained on the Orbitrap Elite (Thermo Fisher scientific, Bremen, Germany) with a nano ESI source. All the data were collected with the Orbitrap mass analyzer with the mass range from 300 to 2000 m/z for precursor acquisition and mass range from 50 to 2000 m/z for fragmentations. Microscan and maximum injection time were 1 ms and 100 ms respectively. The FT AGC value setting was 1,000,000 for full scan and MS2. The S-lens RF voltage was 68% for all samples and the source voltage was 1.8 kV. The source offset voltage was 15 V. The capillary temperature was 250 oC. Fragmentation was performed for the top four precursors in
a data-dependent fashion with HCD and ETD. The normalized collision energy was 28 for HCD. The activation time was 0.1 and 50 ms for HCD and ETD, respectively. The minimum signal required was 1000 for both fragmentations. Isolation width was 2 Da and the default charge state was 2. The charge state rejection enabled and the charge state 1 rejected. Dynamic exclusion was enabled and with a repeat count of 2, exclusion duration of 60 s, and repeat duration of 30 s. The dynamic exclusion list size was 200. The resolving power setting was 120,000 for MS and fragmentations. Lock mass 445.120025 (polydimethylcyclosiloxane) was used for real time internal calibration [4].
1.5 Data Analysis
ProteinGoggle [5] software was selected for intact protein searching. The database was downloaded from the Swissprot website (5041 entries, Mouse, reviewed, sequence length from 1 to 300, September 2ed, 2015). The forward and random database creation parameters were set as methylation (N-term), acetylation (N-term) and phosphorylation (STY) for dynamic PTMs. The max PTMs sited of per protein was 3. The search parameter setting was modified according to a previous report [5]. The Top-Down method was chosen as the MS2 search. The Isotopic Peak m/z Deviation and Isotopic Peak m/z Deviation Outlier Maximum were set 15 ppm and 30 ppm for MS and MS2, respectively. The Isotopic Peak m/z Deviation Outliers was set at 40% for MS and MS2. For the Isotopic Abundance Cutoff setting, it was 20% and 10% for MS and MS2, respectively. Besides, the Isotopic Peak Abundance Deviation,
Isotopic Peak Abundance Deviation Outliers and Isotopic Peak Abundance Deviation Maximum were 100%, 20% and 200% for MS and MS2, respectively. The MS2 Percentage of Matching Product ions was 5%. All the raw data files were uploaded into the software directly and the search work was performed in the forward and random way with the same parameter setting. The high P score means the high confidence in the forward search result, and reversely in the random search result. The cutoff of false discovery rate for proteins identification in ProteinGoggle search was within 1%. After that, manual inspection was performed to improve the confirmation of identifications from database search. The 100 P score was selected as the cutoff for improving the identification confidence. The more fragmentation ions were considered the high confidence and the protein of missing MS2 ion was exclusive even if it has high score. Only intact proteins were chosen for the identified list (100% coverage was selected), because the peptides searches work had been conducted by the PEAKS software. For the repeated protein in same fragmentation experiment, the high P score one was chosen as the final result.
Peaks Studio Software 7.0 (BSI, Waterioo, Ontario, Canada) was selected for raw LC-FT-MS/MS data processing and spectral interpretation. This software has three main functions of Data Refinement, Auto De Novo and Peaks Search. The De novo sequencing derives the peptide sequence from the tandem mass spectrum without the need of a sequence database. The refined data were subjected to the Auto De novo program with the mass tolerance of precursor ions and fragment ions with 10 ppm and 0.05 Da, respectively. No enzyme was specified for cleavage. The amidation (C-terminal), acetylation (N-terminal), pyroglutamylation from glutamic acid and glutamine (N-terminal) and phosphorylation (STY) were selected in De novo sequencing for the variable post-translational modifications. PEAKE DB is a database tool assisted by de novo sequencing to achieve high sensitivity and accuracy, and which was conducted in a protein database SwissProt (16719 entries from mouse, downloaded on September 2ed, 2015). The False Discovery Rate (FDR) was estimated to ensure that only valid results were reported by searching the all mass spectral against decoy database. The FDR value 1% was specified as the cutoff of
false discovery rate for peptides identification in this study. Manual inspection was conducted to ensure that the sequences identified from the database search. The following matching criteria were used: (1) the mass of the peptide calculated from its monoisotopic ions and the results of the database searching were identical to the results of de novo sequencing; (2) the tolerance errors of precursors and the major fragment ions were below 10 ppm and 0.05 Da, respectively; (3) the number of minimal and maximum amino acids length was 4 and 46, respectively, and all this included should have sufficient fragmentation information for recognizing the alignment of the amino acids.
2 Endogenous Peptides Results
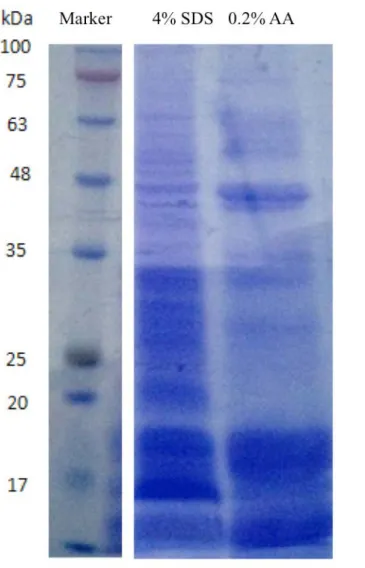
Although a large number top-down approaches have been reported, it remains a challenging task to separate proteins from real complex mixtures without pre-fractions. Many extraction methods, utilizing all kinds of detergent buffers in addition to acetic acid buffer as extract solution, have been previously tested. These studies confirm that a detergent buffers can efficiently disrupt the cell membrane and release more proteins, but these methods are well suited only for middle to large size proteins. Since a high content of detergent is incompatible with mass spectrometry analysis, additional sample preparation procedures are generally required. For example, the desalt and remove detergent steps with methanol/chloroform/water precipitation,[6] the pellets were difficult to be dissolved with non-detergent solvent except high concentration cold formic acid.[7] Even if the suspending problem fixed, the most of endogenous peptides and smaller microproteins would be missing during desalt step. Our investigation shows that with a high power sonication step (100 kHz), acetic acid buffer alone without the need of detergents is sufficient for extraction of the microproteins and peptides (See Support Information Figure S1). Totally, the extraction method that we selected proved to be the best way for simultaneously preparation of microproteins and endogenous peptides, utilizing a solvent is compatible with LC-MS analysis.
(grand average of hydropathicity) index distribution using the online GRAVY calculator (see Figure 3D). A positive GRAVY index corresponds to hydrophobic proteins, whereas a negative GRAVY index corresponds to hydrophilic proteins. For our samples, the GRAVY index was negative, within a range from -1.2 to 0, for more than eighty percent of proteins, suggesting that most of them are relatively strongly hydrophilic. This result is consistent with the acetic acid extract buffer what we selected in the sample preparation procedure.
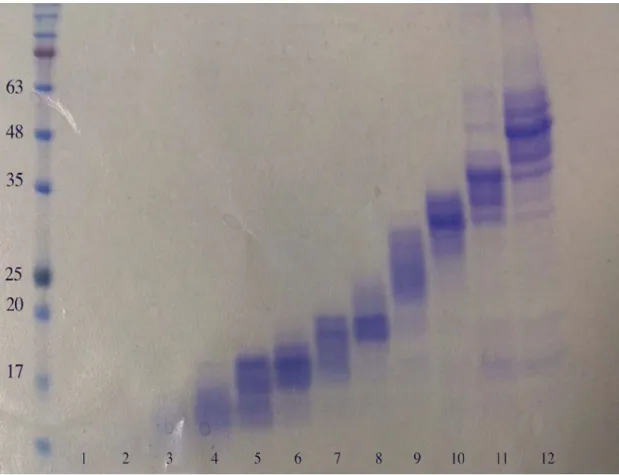
With the advances in the high-resolution mass spectrometry [8, 9] and search software [5], top-down proteomics for complex sample LC-MS analysis has been much improved. However, there remain some limitations for different mass spectrometry instruments that are dependent on resolve power. For example, on the “12 T LTQ FT Ultra”, which has more than 200,000 resolve power, 105 kDa proteins can be analyzed [10]. Previous investigation showed that the resolve power of the high field Orbitrap Elite is well suited for the top-down analysis of proteins up to about 30 kDa [9]. In addition to the limitation of analyzer capability, the complexity of samples is another limiting factor in top-down proteomics. Thus, sample fractionations are often performed prior to LC-MS analysis. The efficient fractionation options have been selected based on previous mass analysis, such as GELFrEE [10-12], hydrophobic interaction chromatography combine with ion exchange, size exclusive and affinity chromatography [13]. We have tested a GELFrEE unit for microprotein fractionation with SDS detergent as lysis buffer and found that most of peptides and some microproteins were not easily fractioned even using a high content gel cartridge (See Support Information Figure S2). Furthermore, most of peptides were subsequently lost during the deleting detergent steps after GELFrEE fractionation. In comparison, acetic acid solutions plus super-filtration were found to be most suitable for the simultaneously extraction of microproteins and endogenous peptides, addressing some of the limitations of the above mentioned preparation methods. We observed that most identified microproteins were up to 20 kDa in size, and could be extracted with acetic acid aqueous buffer as extract solution (See Figure 2).
2.1 Endogenous peptide identification
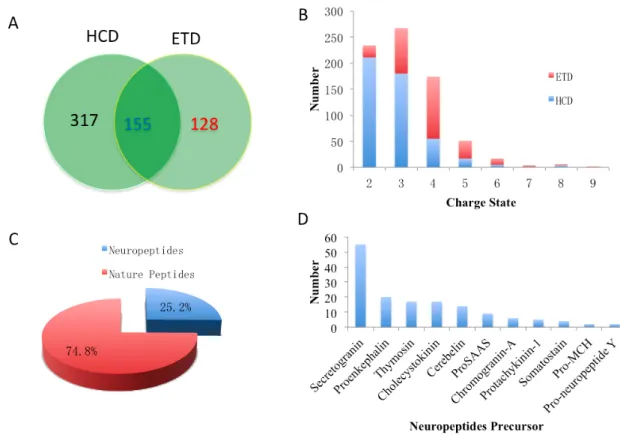
For endogenous peptides characterization, the PEAKS studio was selected for peptides searching and 599 peptides (for complete list see Support Information Table S2) were identified in eight runs with HCD or ETD. The different fragmentations technologies HCD and ETD have been compared in the peptides identifications (See Support Information Figure S4). The peptides were sorted according to precursor charge states and fragmentation method in Support Information Figure S4B, the percentage of ETD fragmentation type increased gradually with the charge state. While only 9.8% doubly charges peptides were identified with ETD fragmentation, 32.6% and 68.4% for three and four charge states peptides respectively could been identified with ETD method, and even 100% for seven and nine charge states peptides. Our findings suggest that in small peptides analysis, HCD can be helpful for improving coverage and inducing more fragments compared to the ETD method.
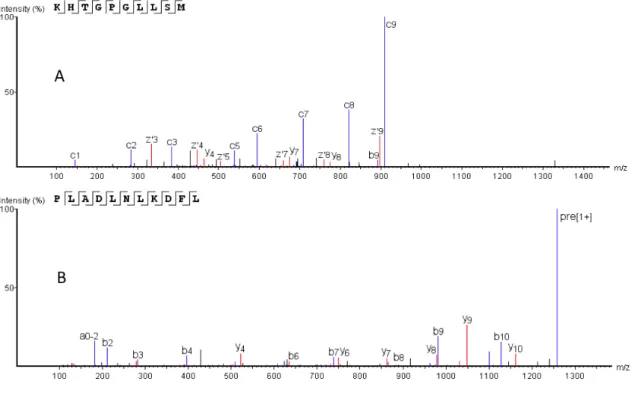
Aside from this, the charge state distribution also confirmed that ETD exhibits greater efficiency in high charge ions fragmentation compared to the HCD method, underscoring that it is necessary to use multiple fragmentation methods for peptide analysis. More than two-thirds of identified peptides were doubly charge state, similar to commonly digested peptides in bottom up proteomics. Representative fragmental ions of two fragmentation methods are shown in the Support Information Figure S5. A total of 99 known or potential neuropeptides (25.2%, Support Information Figure S4C) were identified, and most of them were derived from 11 precursors (See Support Information Figure S4D) with 55 peptides derived from the secretogranin precursor. A group of truncated peptides could assist in prediction, identification and confirmation of their correct sequences [14]. Truncated peptides are commonly observed in neuropeptidomics studies, even if strict preparation methods were used. In our study, many truncated peptides, possibly derived from endogenous proteolytic processing, were detected.
The common neuropeptides such as cerecrin-1, substance P, neuropeptide Y, Met-enkephalin-Arg-Ser-Leu, Met-enkephalin-Arg-Phe and Somatostatin-28 were
identified (see Support Information Table S1). Of the identified neuropeptides, some have important roles in the brain. For example, neuropeptide Y functions as a neurotransmitter in the brain and autonomic nervous system of humans, served as an important signaling molecule regulating numerous functions, such as food intake, storage of energy, reducing anxiety and stress. The neuropeptide somatostatin-28 is one of two active forms, produced by cleavage of precursor somatostatin protein. After antidepressant treatment, the somatostatin-28 increased in Hypothalamus of C57BL/6 mice [15]. In addition to theses neuropeptides, Aß-42, an important peptide involved into the Alzheimer disease [16] was also identified in this work.
References
[1] Svensson, M., Boren, M., Skold, K., Falth, M., et al., Heat stabilization of the tissue proteome: a new technology for improved proteomics. J Proteome Res 2009, 8, 974-981.
[2] Petruzziello, F., Falasca, S., Andren, P. E., Rainer, G., Zhang, X., Chronic nicotine treatment impacts the regulation of opioid and non-opioid peptides in the rat dorsal striatum. Mol Cell Proteomics 2013, 12, 1553-1562.
[3] Taylor, S. W., Andon, N. L., Bilakovics, J. M., Lowe, C., et al., Efficient high-throughput discovery of large peptidic hormones and biomarkers. J
Proteome Res 2006, 5, 1776-1784.
[4] Olsen, J. V., de Godoy, L. M., Li, G., Macek, B., et al., Parts per million mass accuracy on an Orbitrap mass spectrometer via lock mass injection into a C-trap.
Mol Cell Proteomics 2005, 4, 2010-2021.
[5] Li, L., Tian, Z., Interpreting raw biological mass spectra using isotopic mass-to-charge ratio and envelope fingerprinting. Rapid communications in mass
spectrometry : RCM 2013, 27, 1267-1277.
[6] Wessel, D., Flugge, U. I., A method for the quantitative recovery of protein in dilute solution in the presence of detergents and lipids. Analytical biochemistry 1984, 138, 141-143.
[7] Doucette, A. A., Vieira, D. B., Orton, D. J., Wall, M. J., Resolubilization of precipitated intact membrane proteins with cold formic acid for analysis by mass spectrometry. J Proteome Res 2014, 13, 6001-6012.
[8] Breuker, K., Jin, M., Han, X., Jiang, H., McLafferty, F. W., Top-down identification and characterization of biomolecules by mass spectrometry. Journal of the
[9] Ahlf, D. R., Compton, P. D., Tran, J. C., Early, B. P., et al., Evaluation of the compact high-field orbitrap for top-down proteomics of human cells. J Proteome
Res 2012, 11, 4308-4314.
[10] Tran, J. C., Zamdborg, L., Ahlf, D. R., Lee, J. E., et al., Mapping intact protein isoforms in discovery mode using top-down proteomics. Nature 2011, 480, 254-258.
[11] Tran, J. C., Doucette, A. A., Gel-eluted liquid fraction entrapment electrophoresis: an electrophoretic method for broad molecular weight range proteome separation. Anal Chem 2008, 80, 1568-1573.
[12] Vellaichamy, A., Tran, J. C., Catherman, A. D., Lee, J. E., et al., Size-sorting combined with improved nanocapillary liquid chromatography-mass spectrometry for identification of intact proteins up to 80 kDa. Anal Chem 2010,
82, 1234-1244.
[13] Xiu, L., Valeja, S. G., Alpert, A. J., Jin, S., Ge, Y., Effective protein separation by coupling hydrophobic interaction and reverse phase chromatography for top-down proteomics. Anal Chem 2014, 86, 7899-7906.
[14] Ranc, V., Petruzziello, F., Kretz, R., Argandona, E., et al., Broad characterization of endogenous peptides in the tree shrew visual system. J
Proteome Res 2012, in press.
[15] Nilsson, A., Stroth, N., Zhang, X., Qi, H., et al., Neuropeptidomics of mouse hypothalamus after imipramine treatment reveal somatostatin as a potential mediator of antidepressant effects. Neuropharmacology 2012, 62, 347-357.
[16] Evered, L., Silbert, B., Scott, D. A., Ames, D., et al., Cerebrospinal Fluid Biomarker for Alzheimer Disease Predicts Postoperative Cognitive Dysfunction.
Figure S1. The gel electrophoresis experiments with the extracts by 4% SDS buffer and 0.2% acetic acid (AA). The loading volume is 50μl. The concentrations of protein are 10.68 µg/µl and 13.10µg/µl for the 4% SDS and 0.2% AA, respectively. The protein concentration measurement was performed with the standard BSA fit.
Figure S2 The sample fractionations with GELFrEE unit for the mouse brain tissue. The samples were extracted by 4% SDS buffer after incubate at 4oC for 60min.
Figure S3 Representative MS spectrum and sequence map of identified protein with
Figure S4 Identified peptides from the LC-MS/MS analysis. A) Compare the different fragmentation method in ETD and HCD; B) The charge state distribution in the ETD and HCD; C) The ratio of the identified neuropeptides from the total peptides; D) The mainly precursors of identified neuropeptides.
Figure S5 The identified endogenous peptides with HCD and ETD fragmentations. The peptide A and B were cleaved from Succinate dehydrogenase (Q9CQA3, SDHB_MOUSE) and Hemoglobin subunit alpha (P01942, HBA_MOUSE), respectively.
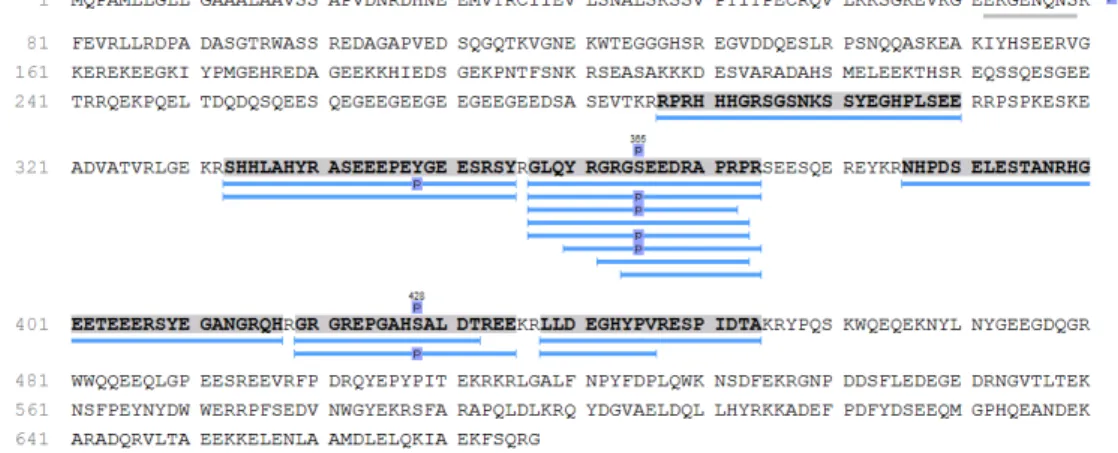
Figure S6. The amino acids sequence map of secretogranin-1 protein. The peptides were searched in PEAKS studio software.