Record Number:
Author, Monographic:
Cavadias, G. S.//Morin, G.
Author Role:
Title, Monographic:
Approximate confidence intervals for numerical verification criteria used in
hydrological models. Application to the WMO intercomparison of conceptual
models of snowmelt runoff
Translated Title:
Reprint Status:
Edition:
Author, Subsidiary:
Author Role:
Place of Publication:
Québec
Publisher Name:
INRS-Eau
Date of Publication:
1985
Original Publication Date:
Janvier 1985
Volume Identification:
Extent of Work:
154
Packaging Method:
pages
Series Editor:
Series Editor Role:
Series Title:
INRS-Eau, Rapport de recherche
Series Volume ID: 164
Location/URL:
ISBN:
2-89146-162-2
Notes:
Rapport annuel 1984-1985
Abstract:
25.00$
Call Number:
R000164
APPROXIMATE CONFIDENCE INTERVAlS
FOR NUMERICAl VERIFICATION CRITERIA
USED IN HYDROlOGICAl MODElS.
APPLICATION TO THE WMO INTERCOMPARISON
OF CONCEPTUAl MODElS OF SNOWMElT RUNOFF
"1
~
McGiII University
W'
Montreal
Universitll du Qu6bec
Institut national de la recherche scientifique
APPROXIMATE CONFIDENCE INTER VALS
FOR NUMERICAL VERIFICATION CRITERIA
USED IN HYDROLOGICAL MODELS.
APPLICATION TO THE WMO INTERCOMPARISON
OF CONCEPTUAL MODELS OF SNOWMELT RUNOFF
G. Cavadias
Department of Civil Enginnering
and App1ied Mechanics
McGi11 University
817 Sherbrooke Street West
Montréal (Québec) H3A 2K6
Canada
and
January 1985
G. Morin
Université du Québec (INRS-Eau)
Complexe scientifique
2700, rue Einstein, C.P. 7500
Sainte-Foy (Québec) G1V 4C7
TABLE OF CONTENTS
Page
1.
1 NTRODUCTI ON •••••••••••.•••••.••••••••••••••••••••••••••••••••••
1
2.
ESTIMATION OF CONFIDENCE INTERVALS .•.••..••••••••.•.••••....••••
7
2.1 Two-way analysis of variance
...
7
2.2 Jackkni fe s tati st; c ... 16
3.
CONCLUSIONS. • • • • • • • • . • • • • • • • • • • • • • • • • • • • • • • • • • . • • • • • • • • • • • • • • • • • 18
Appendices
A.
Annual criterion values •.••••••.•.••••..•••••.••••••••••••.••.•• 25
B.
Graphs of annual criterion values •••••.•••...•••••..••••••..•. 51
C.
95% confidence intervals estimated by the Jackknife statistic •.• 77
D.
Graph of confidence intervals estimated by the Jackknife
stati st; c ...
103
E.
Model groups based on confidence intervals estimated by the
LIST OF TABLES
Page
1
Annual criterion values (NTD) .•.•••.•.•..•••.••.••••••.•••••••••
4
2
95% confidence intervals based on two-way ANOVA (NTD) •.•••••••••
9
3
95% confidence intervals based on two-way ANOVA (S) ••••••.•.••.• 12
LIST OF FIGURES
Page
1
Annual criterion values (NTD) •.••••.•.••.•••.••••••...•••..•..••
6
2
95% confidence intervals based on two-way ANOVA (NTD) •.•.•.••••• 10
3
95% confi dence i nterva l s based on two-way ANOVA (S) •.•••.•• •••• 13
4
Model groups based on confidence intervals calculated by two-way
ANOVA (NTD) ••••••••••••••••••••••••••••••••••••••••••••••••••••• 14
5
Model groups based on confidence intervals calculated by two-way
ANOVA (5) ••.•••••••••••••••••••••••••••••••••••••••••••••••••••• 15
6
95% confidence intervals based on Jackknife statistic (NTD) ••.•• 20
7
Model groups based on confidence intervals calculated by
-1-1.
INTRODUCTION
During the period 1978-1983 the World Meteorological Organization (WMO)
carried out an international intercomparison of conceptual models of
snowmelt runoff [WMO, 1982].
The aims of the project were:
-
to assembl e i nformati on on exi sti ng model s used operati onally to
estimate snowmelt runoff;
-
to compare snowmelt runoff models with regard to their structure,
conceptual basis and data needs;
-
to evaluate and obtain an insight into their performance and
accura-cy of estimation, and
-
to disseminate the information and results obtained so as to
popu-l arize new approaches to forecasting snownepopu-l t runoff and assist
countries in the selection and application of models for this
purpose.
Ten model s submi tted by seven countri es were i ncl uded in the project
and fitted to six standard data sets submitted by six countries.
-2-Each data set comprises a six-year calibration period and a four year
verification periode
Graphical and numerical verification criteria were
used to analyse the results of the models; the final report is in
prepara-tion and will be published by WMO.
The participants of the technical conference held in Norrkoping, Sweden
on September 26-30, 1983 expressed the opinion that itwould be desirable to
estimate confidence intervals for the values of the verification criteria in
order to determine whether the differences between the criterian values are
significant or the result of sampling variations.
At the conference, it was decided that, in addition to the values based
on the entire calibration and verification periods and the snowmelt seasons,
annual values should be computed as well for the criteria R, NTD, Sand NS.
In this report, we used these criteria, which are defined as follows:
Ratio of the mean error to the mean observed discharge:
R
=
One minus ratio of the sum of squares of the daily residuals ta the
centered sum of squares of the daily observed discharges:
NTD
=~(y
_y
)2_
~(y_y)2
o
0c
a
~(y
_
y )
2o
03
-- Ratio of the standard deviation of the residua1s to the mean observed
di scharge:
- Coefficient of gain from dai1y means:
NS
=
L: (y
0 -Yod) 2 - L: (y
C -y
0)2
L:(yo - Yod)2
In the above equations: Yo : observed discharge; Yc : computed
discharge; n : total number of observations; Yod: mean dai1y observed
discharge for each day of the year derived from the calibration period.
The mode1s and the basins used in the Intercomparison Project are given
in the fo11owing table:
MODElS
BASINS
MODEl
ABBREVIATION
IN THIS REPORT
Durance
(France)
UBC
UBC
W3
(U.S.A. )
CEQUEAU
CEQ
Dunajec
(Pol and)
ERM
ERM
Dischma
(Swi tzer1 and)
NAM-II
NAM
III eci 11 ewaet (Canada)
TANK
TAN
Ku1tsjon
(Sweden)
HBV
HBV
SRM
SRM
SSARR
SSA
PRMS
PRM
NWSRFS
NWS
DAIlY MEAN ("Peasant")*
DAY
* This "mode1" was not inc1uded in the intercomparison project.
It
consists
of the mean dai1y observed discharge for each day of the year derived from
the calibration period.
TABLE 1. ANNlIAL CRrHRrO~J VALUFS NTD
rATCH~~ENT DURANCE RTVFR (FRA"lCE)
CO"'Ptt:TE VEAR
UBC CF (J I:.RM NHI TAN HBV SRM SSA PPM NIolS
OH
CAL ,,9.10 • 9?'~ .<:1;>1 .A12 .Q'iil .8 9 6 ,937 .1,000 .904 .920 ,91)1 .81.14
CAL 70-71 .8 9 b .910 .815 .h 91J .935 ,8bO .. 1.000 ,81\1 .836 .9tO .793
CAL 11-72 .81'\1 .9:?~ ,750 .901 .9('8 ,8 9 1 -1,000 ,90b .853 ,909 .198
CAL 7;>-73 ,912 .61l1 .092 .831 .801.i .ba/) -1.000 .921 ,&85 ,921 .700
CAL 73-74 .875 .71'\1.i ,037
,"'''"3
,919 ,85~ ·1.000 .87& .880 .8b3 .804CAL 74-'75 .8b2 .!\~4 .blJ,? .817 .625 .875 .934 .893 .&811 .8011 .732 VlR 7115-10 .357 .310 -.7/10 .71\4 .&1\8 ,845 .831 .838 .323 .71.12 .. 1.009 VlR 7b .. 11 .8 73 .fll'\/j ,70n .8bO .81\4 .81& .805 .897 .75b .919 .462 VlR 71 .. 78 .60/J .1\(,1 ,595 .8;>0 .825
.9n
,893 ,822 .b24 .920 .1.185 VER 78-79 .9f.d .935 .797 .875 .912 ,92? ,8115.<no
.880 .929 .771.1 1 +=> 1 SNOloiMELT SEASON CAL b9.70 .817 .9;>4 .833 .977 ,8b2 .9t4 "1,000 ,833 .897 .928 .61H CAL 70 .. 71 .852 ,8~7 .1\07 ,8~0 ,8 4 7 ,518 ·1,000 ,bClb ,Sb7 .7"0 .1.138CAL 71.72 .717 .8A9 .5(,1 ,673 ,8f18 ,750 -1.000 .7AD ,129 ,880 .522
CAL 72-73 .8A/J .3 9 8 .021 ./'.27 .74& .447 .. 1.000 ,880 .1177 ,8C10 • 4 il CI
CAL n·7/J .8<;0 .1>91 .5/14 .833 ,8&2 ,71q .. 1,000 ,793 .7 C1 b .758 .6«15
CAl,. 7/J-75 .TOq .t:>t:lô .31:>3 .826 .566 .7il2 .ClO7 .821 ,1.131 ,b&O .3«11
VER 7r;.7b -./:I Q8 ·.571 -1.1.817 .P.7 ,321 .821 ,814 ,732 •• 128 .3n -3.612
VER 76·77 .68/J .B/ll .êA2 .936 .832 .75C1 .874 .822 .022 .924 -.159
vE~ 77.7B .820 .881 .3Qt:I .81\Q .731.1 ,QOl ,925 ,& Cl 3 .ôqo .Cln4 .328
5
-As a first step the annual values of the criteria defined above were
studied.
The an nu al values of the criteria for all basins, periods and
seasons are given in Appendices A and B.
As an example, Table 1 and Figure
1 give the values of the criterion NTD for the Durance River.
The value
(-1.000) denotes that the model has not been tested in a given case.
In Figure 1, each asterisk represents the annual value of the criterion
for the calibration and verification periods.
If the annual value is the
same for more than one year, the asterisk is replaced by a digit showing the
number of repetitions.
The symbol 'T' indicates that at least one annual
value is outside the range of the scale.
An examination of the tables and graphs indicates that criterion values
vary for different years and models. There is an overlap between the range
of the an nua l values of the cri teri a for different mode l s wh i ch i ndi cates
that the difference between criterion values may be due to sampling
varia-tion and therefore it would be useful to compute confidence intervals. In
this connection, it is interesting to note that the dispersion of the
criterion values of a given model for different years is an indication of
the consistency of its performance.
FIGURE 1. ANNUAt CRlTFRYON VALUES NT/)
CA TCHMENT rHiRANCF ~lVER (FRANCE)
COMPl.ETE VEAR
CALlRRATTO'-J PERlflf) VERIFICATION PERlOn
CRITEfJlflN VAL\I[S CRIHRJ()N VALUFs
0,0 0.1
0.2
n.3 0.1.1 0.5 0,6 n,7 O.R O,q 1.00,0
0.10,2
0,3 0,1.1 0,5 0,& (1,7 0,8 0.9 1.0t t
,.
t l' l' l' t l' t,
l' l',
l',
l',
,
.,.,
tUBC
*2*2
URe•
*
• •
USCCEIl
*
•
•
3 CE(J•
••
•
CEIilERM ?
•
•
2 ER'" 1•
* * ER'"NAM
•
22
•
NAM* *
••
NAMTAN
*.
.2*
TAN•
•
•
..
TANHRV
*
2"•
HaV *. i!Mev
SR'"•
SRM*
il!..
SRM 55A 23* 55A••
.*
SU PRM"
***
•
PRM•
..
•
•
PRM NWS*
..
2*
..
NWS•
h N\1IIS 1DAY
•
*
3*
OAV 1••
*
DAY CJ)5NOWMF,:LT 5EASON
CAl IARA TJO~J PEPInD VERIFICATION PERIOD
CrqTERIoN VALJJES CRITERTON VALUES
0,0 0, t
0.2
0,3 0,1l 0.15 0.6 0,7 0.8 0,<1 1.0 0,0 0.1 0,2 0,3 O,a 0,5 0,& 0,7 0,8 0,9 1,0t .,. l' t t
,
,
l' l' t,
t,
, , ,
,
t t,
t tURe:
•
•
**2
Il!:!e 1*
•
* USCCE(~
*
2*
•
*
CEIl 1 Z*
CECI(RM
•
*.
•
•
* fRM * * !RMNAM 22
•
*
NAM•
..
l NAMTUi
*
* ·2* TAN **
*
*
UN HAV•
•
•••
•
HBV 11 ** •
Hev
SRM*
SRM*
*•
* SR'" S5A•
•• *.
11 55A•
*• •
SU PRM•
..
•
.. ..
*
PRM•
*
* PR'" NWS•
••
•
••
NWS 11.* *
NWS7
-The verification criteria are complicated functions of the observed and
estimated flows and therefore the computation of exact confidence intervals
i s mathematically i ntractabl e.
In thi s report, two different approaches
were used to compute approximate confidence intervals.
The first approach is the standard two-way analysis of variance and the
second is the Jackknife statistic which is of general applicability.
It must be noted that confidence intervals for the criterion values
were also computed using Friedmanls (Hollander and Wolfe, 1973)
non-parametric two-way analysis of variance method.
The results of this
compu-tation were less sensitive in discriminating between model performances than
both the ordinary Anova and the Jackknife statistic and therefore they are
not included.
2.
ESTIMATION OF CONFIDENCE INTERVALS
2.1 Two-way analysis of variance
A two-way analysis of variance can be used to determine the effects of
the years and the models on the values Vij of the verification criterion V
where (i) represents the year and (j) represents the model.
It must be
noted however, that in our case, as i s apparent from the graphs of the
-8-previous section, the basic assumptions of the analysis of variance
(homoscedasticity, independence and normality of residuals) are not
satis-fi ed in most cases.
In additi on, confi dence i nterval s computed by the
standard two-way Anova are based on the pooled standard deviation and
there-fore cannot take into account the differences in dispersion between models
and can only give an indication of the size of the confidence intervals.
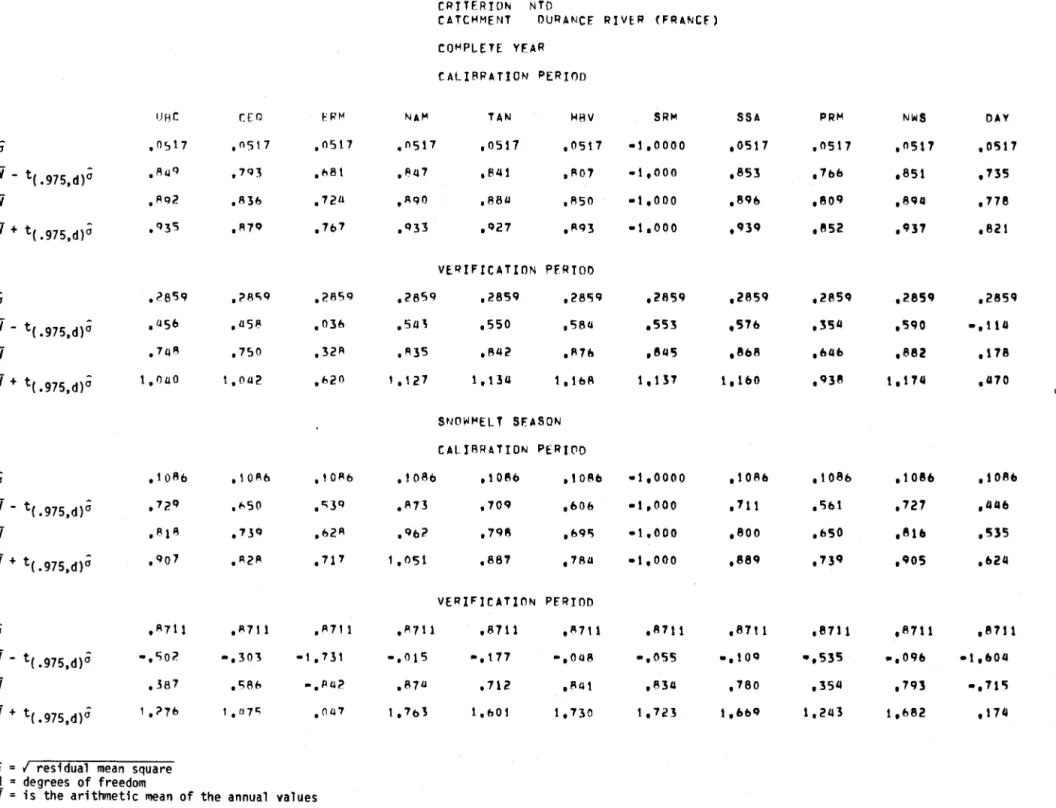
Tabl e 2 shows the resul ts of a two-way analysi s of vari ance for the
criterion NTO of the annual values of Table 1 and the 95% confidence
inter-vals based on the pooled standard deviation.
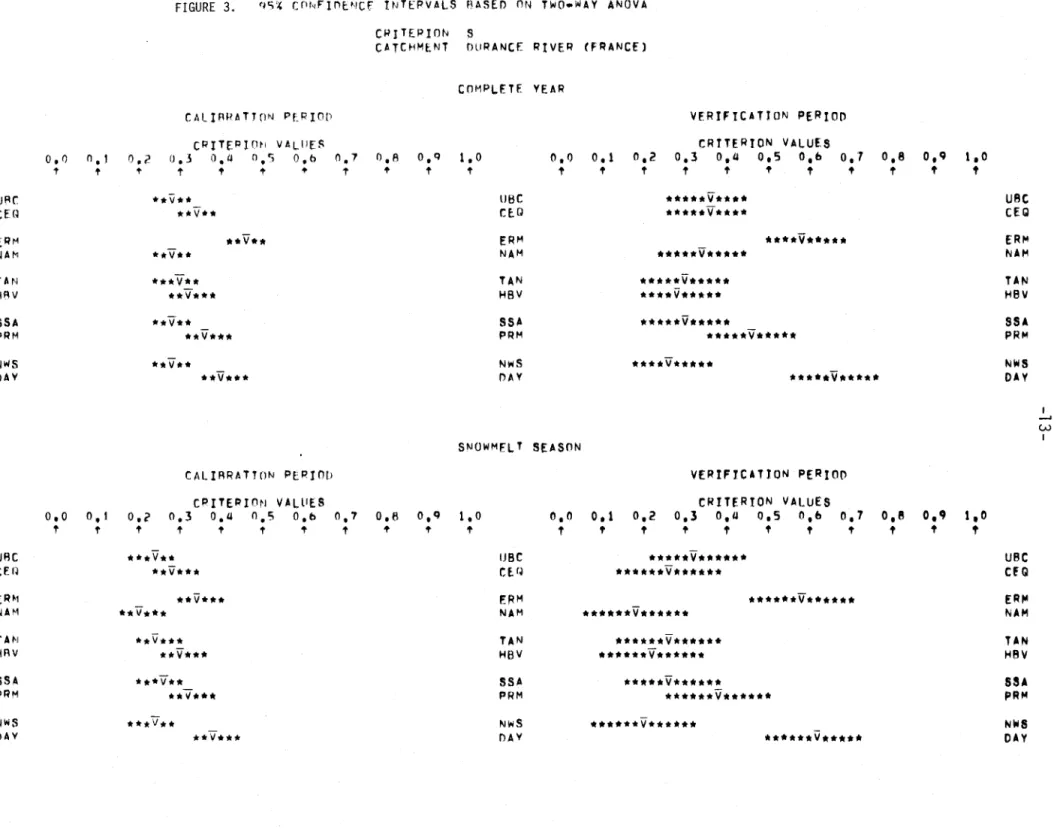
Figure 2 shows in graphical form the confidence intervals of Table 2.
On this graph,
"V"
represents the arithmetic mean of the annual values of
the criteri on.
It must be noted that the confidence intervals in the figures are
cut-off if the upper or lower limit of the interval is outside the range of the
scale. This is indicated by the symbol "1".
Figure 2 shows that the confidence intervals for NTO are very wide for
the verification period.
This is due to the fact that the pooled standard
deviation is influenced strongly by models with high variability of the NTO
values.
TABLE 2. Q,,~ r:(J~IFTDF'~.CE. INTF.:RVALS AASE.D ON Twn-WAV ANOVA
CRITF.RION NTD
CATCHMnJT DURANCE RIVt R (FRANCf)
COMPLETE VOR
CALlRRATION PERlon
URe C(:Q H;>M NAM TAN I-IBV 5RM 55A PRM NINS DAY
cr ,n')17 ,oS17 ,n511 ,0517 ,0517 ,OS17 -l,DODO .0517 ,0517 ,0517 ,0517
Y -
t(.975.d)â ,RuQ ,7<)3 ,;'81 .1'1.17 ,llLll ,R07 -1,000 ,853 ,hb ,85t ,735Y
,1'192 ,R36 ,72/1 ,1'1</0 ,8S/J ,RSO -1,000 ,89& ,80 9 ,894 ,778Y +
t(.975.d)â ,Q3'5 ,1\7 9 ,7b7 ,q33 ,Q27 .1193 -1.000 .93Q .852 .937 .821 VERIFICATION PERIOI)-
,?8'59 ,?A""9 ,285Q ,?S5</ ,2859 .?SCj9 ,2aCj9 ,2859 ,2f159 ,2859 .2859 cry -
t(.975.d)â ,IJSb .lIS"- .036 • Stn .550 ,S8/J .553 ,57b ,354 ,590 .. ,114Y
,7t1 R .750 .321'1 ,1'135 .flQ2 ,117& ,8Q5 .8b8 .bQb ,S8Z ,178Y+
t(.975.d)â l,n/JO 1,0/.12 .1>20 1 .127 1.134 t,lb8 1,1n
l,IbO .Q38 1.174 ,4110 1 \.0 1 SNOWMELT SF.ASQNCAllARA TION PERI('1D
-
,10Ab ,101'1& ,lOllb .10Ab .108b .108b ·1.0000 .10Ab ,108b .1086 .108bcr
y - t(.975,d)â .729 ,(0,50 ."3 Q .1173 .709 ,bnb -1.000 .'11 ,'5bl .727 ,446
Y
,1'\11\ .73Q .621'1 .Qb? .798 .b9C; -1,000 .800 .b50 .81b .535Y +
t( .975,d)â .9n1 .1'121'1 ,717 1,051 ,fl87 .7f14 -1,000 .889 .13 9 .905 ,b24VERIFICATION PfRIOD
â ,1'1711 ,A711 ,1'1711 ,A711 .8711 ,!'I7tl ,fl111 ,87 t 1 ,8711 ,8111 .8711
Y -
t(.975,d)â -,cio?' -.303 -1.731 -.015 -,t77 -.0118 -,055 -,10Q ",535 _,09& -1,&04Y
,38 7 ,1586 ",1'11.12 .A7 11 .712 .8111 ,834 ,780 ,354 .1Q] _,11'5Y+
t(.975,d)â '.276 , ,Il 7C, ,01.17 1,11)1 1.bOl 1.130 1,723 l, &bq 1,2'13 1.682 ,174â
=
1
residual mean square1
=
degrees of freedomTAN HRV SSA PRM NIIIS DAY ERM NAM TAN HRV S5A PRf-I NltiS DAY 0,0 l' 0,0 l' n.1 l' 0.2
,.
0,2 l' FIGURE 2. CRITEPIPti VALUES 0.3 D,a n.~ ".b l' ,. l' t CRITERION VALUES 0.3 0,4 0.5 0.6 l' t ." t 0,7 l' CPITt::RION CATCHME.NT 0.8 tHt:V**
**v***
•• **.v**.*
****.v.**.
* •••• v.***
•• *.*v****
****v****
.*.*v*.*.*
NleDURANCE RIVER (FRANCE)
USC CEQ fRM NAM TAN HBV 5SA PRM NWS OAY 0.0 l' 0.1 t VfRIFICATtON PERlon CRITFRYON VALUES 0.3
o.a
o.~ O.b 0.7l' t l' t l' 0.6 l'
****.*.** •• *.*V************I
*********.****v**********.*I
******.*******v********.***.**
***************V*******I
***************V******.I
.*.**** •• ******V**.**l
***.*****.****V**** •• l
••• **.* •• ·* •• *v ••
*.****.**.**.
SNQWMFLT SEAsnN SSIl PRM 0.1 l' VERIFICATION PERIODtRtH.:RYON
vllLUES 0.3o.a
0.5 O.b t t t t 0,8 tt,O
tI**** •• **** •••• ·.*·v •• * •• ·* •• **.*.****.***.*.****.I
t •••*.**.** ••• * ••• **·.·***.**V** •• *.*.* •• ********.l
1**
I*.****·**.*.· •• **.·*.***·**·******.********V**.*.I
1·**·*·**·****··*·***.**···**·** •• V
••• **** ••• ***I
I** •• *.*.* •••• *.*****.*.*·*·**.****.*.****V*****.*I
1 •• ***.*.*.***********.***··.**** •• *·**V ••• *.· •• *.I
I.** ••• ·**·.***.**V** •• ** •• ·*** ••• * •••• *** ••• *.*.*l
I.**.*.**·*.*.*********************··**·V •• **·****I
1*********
UBe CEG ERM NAM TANHav
5S. PRM NWS OAV UBe CEG ERtoI NAM TANHav
55A PRM NIIIS OH 1 - ' 0 1-11-This is a serious limitation of the standard two-way ANOVA approach.
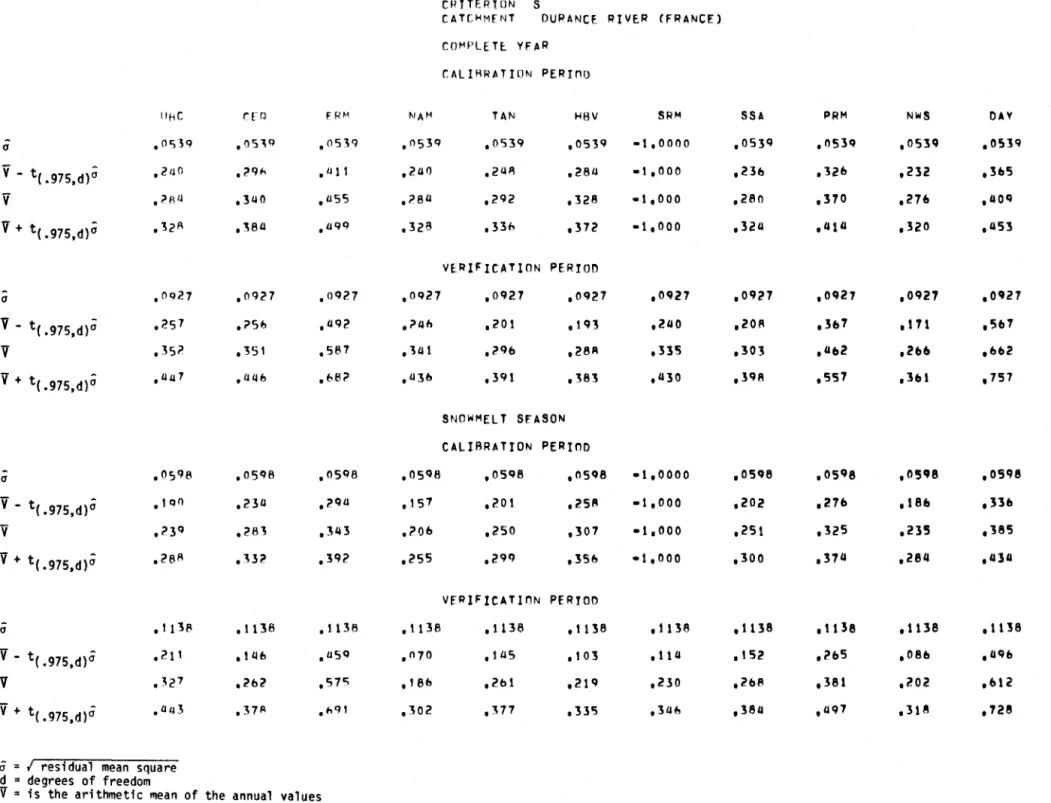
Given that the confidence intervals for NTD are very wide it was
consi dered useful to i ncl ude the correspondi ng tabl es and graphs for the
criterion S which has a smaller variability (Table 3, Figure 3).
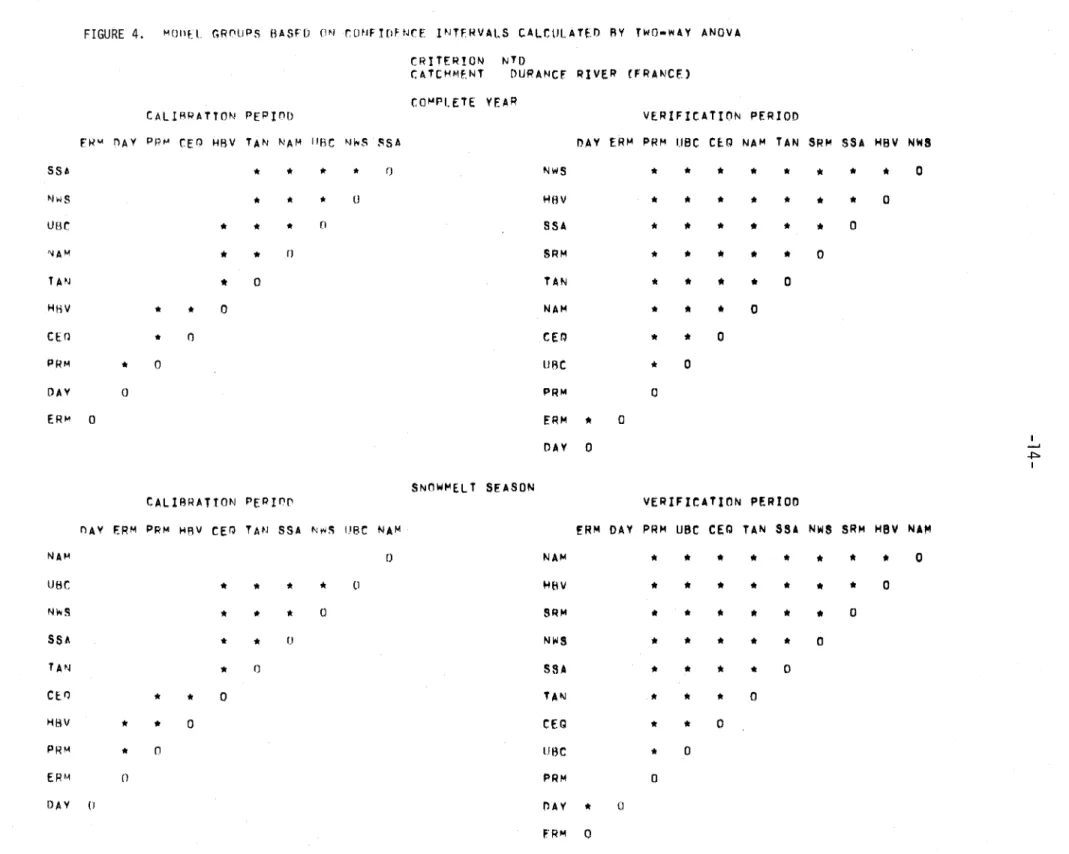
Based on the confidence intervals alreaqy computed, we can determine
groups of models which are not significantly different, i.e. the lower NTD
values are within the confidence interval of the higher NTD values.
Figure 4 shows groups of models whose NTD values are not significantly
different. The figure should be read from the higher to the lower values of
tJTD.
For example, for the calibration period (complete year) , the models
TANK, NAM-II, UBe and NWSRFS are within the confidence interval of the best
model (SSARR).
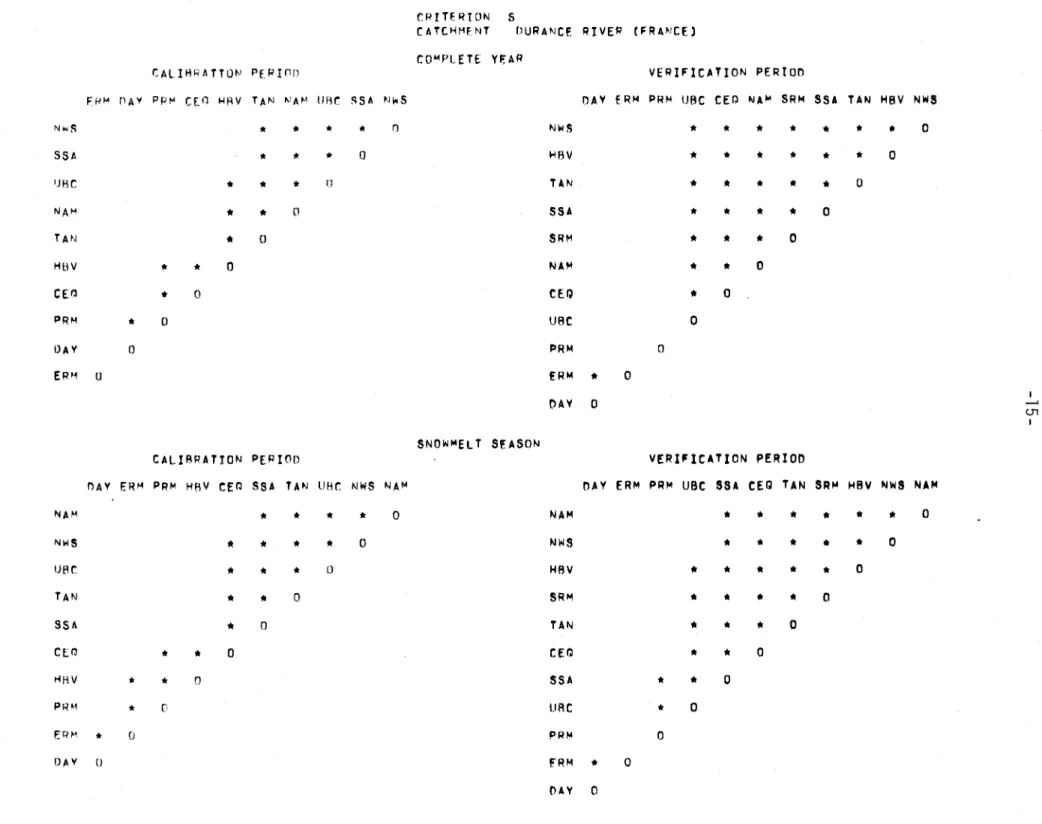
Figure 5 shows the corresponding results for the criterion
S.
The above computations were carried out for all basins, criteria,
periods and seasons.
The resul ts show that the confidence i ntervals based
on the pooled standard deviation are not a reliable guide to model
perfor-mance and therefore the remaining tables and graphs are not included in this
report.
TABLE 3. o~~ crn,IFTUf ~H;E INTFRVAI S BASE!) ON TW(1 .. WAY ANOVA CHJTERION S
CATCf.lMfNT DURANCE. RIVf.R (FRANCE) COMPLET!: YFAR
CALIBRATION PERlno
IIflC
no
F R ~~ "'AM TAN HBV SRM 55A PRM NWS OAYa • or::;~o .os~q .o')VJ .°530 .053Q ,OSH -1.0000 ,OS3o ,0531'1 ,053Q .05H
V -
t(.975,d)Ô .2ll(l .?ql- ,Ill! ,2(11) .21.1A ,28/J -1.000 .236 ,32b .232 .3"5V
.?f\ll .31.10 ./JS5 .?8 4 .202 ,328 -1.000 ,280 .310,nt,
,401'1V
+ t(.975,d)Ô .32" .JBtI ./JC/CI .328 ,33*" ,372 -1,000 ,324 ,4ltl .320 .453 VERIFICATION PERlon-
.OCl27.oqn
,Oq?7 .01'127 .01'127 .01'127 ,0027 .01'127 ,0Q21 .0021 .0'27a
V -
t(.975,d)â .25 1 .?5b ,a02 .?4n ,ZOl ,10! .240 ,208 .3b1 • Ul ,Sb?V
.3e;;? .351 .587 , Hl .206 .28R .315 .303 ,tI,,2 ,2t/6 .b"2V
+ t(.975,d)â ,aa 7 ./JlIb .bS? .a36 ,Hl ,383 ,430 ,H8 .557 ,361 ,757 .1--' N SNOWMELT 5FASON 1 CALIRRATION PERIOO
-
.OSq8 .051'18 .OSCl8 .051'18 ,05 08 .051'18 -1.0000 .051'18 ,05'8 ,05Q8 ,05Q8 aV -
t(.975,d)â . 1 ( 1 ) ,23/J .2Q/J ,15 7 ,201 .258 -1,000 .202 ,21" ,18" ,3UV
,231'1 .2A3.:vn
.?Ob ,250 ,307 -1,000 ,251 ,325 .235 ,385V
+ t(.975,d)â .2s R.H?
.31'12 .255 ,20e) .35b .1,000 .300 .374 ,284 ,4lU VERIFICATION PERrOn â • 1138 .1138 .1138 .1138 .1138 ,1138 .1138 ,1138 .1138 .1138,t
138V -
t(.975,d)â .211 .ttl6 ./J5Q ."70 .ttlS .103 .11 4 .152 ,?&S ,086 .Uq"V
.32 7 .262 ,57<; .18b ,201 ,21Q ,230 ,2&8 ,381 ,i!02 ,612V
+ t(.975,d)â .a«3 .:HA .t.qt .302 ,377 .33'5 ,3a" ,384 ,(11'17 ,31 8 .128ô
= .;
residua-' mean square!
=
degrees of freedomFIGURE 3. (je;" C PI'!" l l'lé."!Ç
r
!NTEPVALS RASEn ON TWO.WAY ANOVACWJTE.P!ON S
CATCHME;NT flllRANCF: RIVf,R (FRANCE)
COMPLETE YEAR
CALIRHATroN PtRIOO VERJFICATJON PERIOD
CPITEPIO~i VILIIEI' CRTTERYON VALUES
0,0 0,1 1).2 0.3 Cl.O 0,'; 0,0 0.1 0,8 O,!:) 1.0 0,0 0,1 0,2 0,3 O,iI 0,5 O,b 0,7 0,8 O,q 1,0
t l' l' l' l' l' ... t l' l' l' l' l' t l' t l' l'
,
t t tU~r:
*.v**
UMe••••• v ••••
UAtCEr~
•• V*.
(éD••••• V ••••
CEGEt:II~
•• V ••
ERM•••• V •••••
ER'"NAM
*.v.*
NAM••••• v •••••
NA'"TAN
*.*V**
TAN••••• v ••• **
TANHRII
*.v***
HBII****\1*.***
HeVS5A
**v**
S5A•••• *V ••• *.
SUpRM
**V* ••
PRM• •• *.v* ••••
PRMNotS
**11**
Nj<jS.* •• v.*.**
NWSDAV
**v***
nAY*****v* •• *.
DAY1
--'
W
1
SNQWMFLT SEASON
CALIARITTON PERJn~ vERIFICATION P(RIOD
CPlTEPIn~1 VALlIES CRIHR!ON VALUES
0,0 0,1 0,2 0.3 0,/,1 0.'5 O.b 0.7 0.8 O,q 1.0 0,0 0,1 0,2 0.3 O,iI 0.5 O,b 0,7 0,15
a,.
1,0t l' l' l' l' l' l' l' l' t l' t t t t t t l' t t t t
URe
***V**
uee.***.v******
uee
CEll
**v***
ct
(~***.**v •• **.*
CEGER~l
**v***
F:RM••• **.v*.** ••
ER'"
NH1
**V***
NAM* ••• *.v.**.**
NAMTHI
**V***
TAN*****.V* ••• *.
TAN
fiA V
**V***
HBV* •• * •• v •• *.**
HBVSSA
*.*v*.
S5A• •••• V* •• * ••
SUpRM *.~
•• *
PRM•••••• V
••••••
pR'"NWS
.**v**
NWS•••• **\1*****.
NWeFIGURE 4.
MOllO. GRNiPf\ BASFD rHI Ctl/IF T[)~ NCE INTFRVALS CALCUlATED RY fIllO .. WAY ANOVACRITERION NTQ
CATCHMF.NT DUt"ANCf RIVER (~'RHICf)
CO"'PI.ETE YFAt"
CALIRAATTON PEPInD VERIFICATION PERIOO
Ff./" nAY Pp,.. CErJ HRV TAN NA'~ IIRC N"S SSA DAY ER~ PR'" uee CEQ NA'" TAN SRM S5A MBV Nil/a
5Sb
*
*
11: ", n NWS""
*
*
*
*
*
*
*
0 ~hlS*
1ft 1ft 0 MaV*
*
""
*
*
*
*
0uuc
*
*
*
(l SSA*
'"
*
'"
*
*
0 ~AM*
'"
n SRM*
'"
*
* *
0 TAIJ*
0 UN*
* *
'"
0 HHV..
..
0 NAM*
*
•
0 CEr)*
n CEQ""
'"
0 PRM*
0 URe*
0 DAY 0 PRM 0 ERM 0 ERM""
0 1 DAY 0 --' -1'> 1 SNOIoiMELT SEASONCALIBRATTON PERlnr VERIFICATION PERlon
r'lAY F:RM PPM HRV CEn TMI S5A N,"~ \Ise NAM ERM DAY PR", use CEQ TAN SSA Nil/a SRM MBV NAM
NAM [) NAM
*
*
'"
*
*
*
'"
*
0 UMC*
..
..
*
(JHav
*
*
'"
*
*
*
*
0 N\I/!;""
..
""
0 SRM*
*
*
*
*
*
0 55A*
*
LI NIII!*
*
*
*
*
0 TA IJ*
!) S8A.. ..
:/1•
0 CUl..
*
0TA
III*
:/1*
0 HBV""
..
0 CEG..
*
0 PM'"*
Cl UBe*
0 ER'~ (l PRM 0 DAY () l'lAY*
0 FRM 0II"'"
FIGURE 5. "'OOft r,PPUI'S ~ASf[) (IN rONfTI.lEt~CE INTFRVAlS CALCULATED AV TWO-wAV ANOVA
CPIHR10N 5
C A TCHHF~IT [)URA~JCE RIVE~ ("RA~!CE )
CO~PLETE. VI'.AR
r:AUHf.iATTO~1 PfRI(1f) VERIFICATION PERlOn
FR~ nAv PR~ CEn ~RV TAN ~A~ llAC ~5A Nw5 OH ERM PRM
!Jac
CEg NAM 5RM 55A TANHav
NWSN .. ~ ,., ,.,
..
,., n NWS,.,
..
,.,,.,
,.,
,., ,., 055A ,., ,.,
..
a
HBV ,.,,.,
,.,
,.,,.,
..
0IJHC
..
,.,
..
f] TAN,.,
,.,..
,.,,.,
0NA""
•
jIo () 5SA•
,.,• •
0TAN
•
0 5R~•
,.,,.,
0 HBV ,., ,., 0 NAM•
,.,
0 C(1l..
0 CEG•
0 l'pM ,., () lIRC 0 DAV 0 PRM 0 ER'~ (J ERM•
0 1 DAY 0 --' c.n 1 5NOWMEL T SF. ASONCALIARATtON PERIOO VERIFICATION PERlOO
DAV ERM PRM HHV CE~ 55A TAN lIHC N\<oIS NAM DAY ERM PPM
uec
S5A CEQ TAN SRM HBV NiN! NAMl'jAM
,.,
,.,,.,
,., 0 NAM•
,.,• •
•
,., 0l'jW5 ,.,
,.,
,., ,., 0 NWS ,., ,.,,.,
•
•
01)Br:
,.,
,.,•
()Hav
,.,
• •
jIo jIo 0TAN jIo ,., 0 SRM
•
,.,,.,
,., (155"
•
0 TAN jIo jIo•
0CEJl ,., jIo 0 CEQ jIo
•
0HHV ,.,
..
0 S5A..
•
0PRM ,., (! URe ,., 0
Efm ,., 0 PfI'" 0
I)AV 0 FRM
..
0-16-2.2 Jackknife statistic
The Jackknife statistic is a refinement of methods of direct assessment
of sample variability (Mosteller and Tukey, 1977). This technique is based
on the subdivision of the sample in a number of subsamples and the
computa-tion of the statistic by omitting each subsample in turn.
The statistic
thus obtained has a t-distribution and therefore can be used to compute
confidence intervals for the values of the verification criteria.
In this connection, it must be noted that the Jackknife statistic is
generally valid for independently and identically distributed observations.
The use of this statistic in the present context is justified by the lack of
autocorrelation of annual flows since the groups used in the computation of
the statistic consist of the daily flow for individual years.
The procedure for computing the Jackknifed estimates and the
corre-sponding confidence intervals for the values of the verification criteria
consists of the following steps:
1)
Given the observations:
compute the value of the verification criterion Vall
=
f(Zh ... , zn)
-17-2)
Subdivi de the data i nto
11.groups where
11.i s the number of years in the
calibration or verification periode
3)
Let V(j) be the value of the criterion cOll\1uted from the portion of the
sample that omits the j-th group.
Compute the "pseudovalues"
j
1,2, •••
,11.4)
The "Jackknifed" value of Vis
-18-5}
To form confidence intervals for V*, use the t-distribution with
(R.-1)
degrees of freedom.
Table 4 shows the results for the criterion NTD for the Durance River
including the 95% confidence intervals. The tables for all the criteria are
shown in Appendix C.
Figure 6 shows in graphical form the confidence intervals of Table 4.
The graphs for all the criteria are shown in Appendix D.
It must be noted that the symbol Vin the graphs represents the
jackknifed value V*.
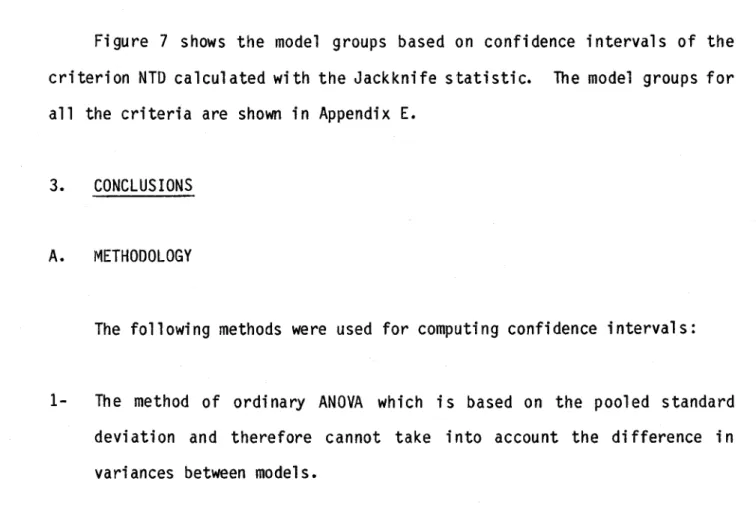
Figure 7 shows the model groups based on confidence intervals of the
criterion NTD calculated with the Jackknife statistic. The model groups for
all the criteria are shawn in Appendix E.
3.
CONCLUSIONS
A.
METHODOLOGY
The following methods were used for computing confidence intervals:
1-
The method of ordi nary ANOVA whi ch i s based on the pool ed standard
devi ati on and therefore cannat take i nto account the di fference in
variances between models.
TABLE 4. Q5% rn~J~ TDFH:E INTERVAI.S !:,ASEO ON ,1 A C K K NIFE. ST"ATT5TIC rRIHRloN NTO
rATCHMENT OUR ANCE RIVER (FIUI.ICf)
COMPLETE YEAR CALIBRATION PERloo
URC n:fl rR~! NAM TAN HBV SRM 55A PRM NW$ OAY
0* ,°1 01\ ,01.1°7 ,n3117 ,02 02 ,0225 ,01.105 ·1,0000 ,0068 ,CI/JZe ,OlCJb ,024Q
V* - te.975.d)ô* ,A71J ,71/\ ,h5C1 ,A/J7 ,832 ,753 -1,000 ,882 ,717 ,858 ,72&
V* .Clot ,A/J" ,71.1A .f\Q9 .A90 ,AS7 .. 1,000 .900 ,827 ,908
,no
v* + te.975.rl)ô* ,Q2Q ,97/J .A37 ,C/51 , Q 1.17 ,<lbl -1,000 ,917 .937 ,95'1 ,8S4
VERIFICATION PERlOO
0* ,03 70 .01111 ,O~'5n ,OlAl ,031.14 ,031& ,0250 .°28 9 ,0&27 ,0075 ,Ob71
v* - te.975.d)ô* ,75/J ,AB ,'511l ,A08 ,782 ,H7 ,788 ,795 ,558 ,910 .355
V* ,1172 ,A91 ,"8Q ,Ab5 ,892 ,1197 ,/lbl\ ,887 .75 7 .934 .5b8
v* + te .975.d)ô* ,<16 9 ,<I/JA ,"'6 4 ,Q23 l ,001 ,<l9a • <HI 1 ,919 .957 ,ClS8 .781
1 --'
1..0
SNOWME:LT SF.A50N 1
CALI BfU TI ON PERlOt)
0* ,0212 ,1042 ,Ob"ib ,034b ,0321 ,OQ21 ·1,0000 ,022 Q ,0880 ,03'58 ,05b8
v* - te.975.d)ô* ,7Qe ,48'5 ,"i2'" ,7 C1é ,11.1b ,481.1 .. 1,000 ,7&5 ,1.181 ,7U ,451
v* ,"'53 ,753 ,hCl6 ,"'85 ,112<1 ,72t -1,000 ,82/J ,107 ,85'5 ,5CJ7
v* + te.975.d)ô* ,908 1,021 ,Ab" ,<171.1 ,<111 ,<157 ·1,000 ,883 ,913 ,947 ,743
VERIF ICATION PERlOO
0* ,o31J5 ,0171.1 ,0811'> ,0218 ,Obl.lb ,0277 ,0552 .OMIS ,0:572 ,0160 .0cH 1
V* - te.975.d)ô* ,73/J ,AS? ,267 ,8b3 ,651 ,IIOA ,71l1 ,b08 ,b45 ,885 .117
V* ,I\41J ,Q07
.r:,n
,°32 ,857 ,A9b .SqO ,826 .'763 ,QU .406V* + te.975.d)ô* • qSlj .tlb? .787 1,01)2 1,Ob2 ,<le/J 1.0b'5 t,O/J1I .882 .<187 .b96
0* =
1
Var(V*)URe CF.Q ERM "IAM TAN HAV 55A PRM NWS DAV USC CEf) ERM NA~' THI
HRV
S5A pRt-1 NWS DAY 0.0 '!' 0.0 '!' 0.1 '!' 0,1 t 1),2 l' 0,2 tFIGURE 6. qS% cnNFlnE~CF TNTEPVALB PAsto ON JACKKNIFE STATISTIC NTD
("PERlON
CATr.tH'r. NT
nURANCE RIVEl' (FRANCE)
cnMpLr:TF VEAR
CAL 1 R RAT TI) ~I P E rq n [)
C"PéPIN! VALII(S 0,3 0,4 n,~ D,b l' , '!' t 0,1 t 0./1, t 0.1) t l ,0 t
*V""
*""****V,,,,******
****V*****
***V***
**V***
*""***11*****
*V*
*****V*""****
**V***
***V""***
UMC CEQERM
NAM
TAN
HBV 55A PRM Nw5 DAV 0,0 t SNOWMfLT SEAsnN CALIRRATTON Pf.RIOD CRITERI(1N VALUES 0,3 0,4 0,5 O,b t t t t 0,7 t 0.8 t 0.'1 t 1.0 t***V**
""**",,**********V************
*********V********
****V*****
****1/*****
************V************
***V***
*~*********V*****************V****
**,.****11*******
UBe CECil FRM NAM TANHav
SSA PRM Nw5 DAV 0,0 t 0,1.,.
0,1 t 0.2 t 0,2 l' VERIFICATION PERIOO CRtTE'RtON VALUES 0.3 O,U 0.5 o.~ (J.7 t t t t t 0,8 t o,~ tt,o
t******V*****
**""v**
********V*********
***v***
******V***""*
*****V*****
****V*****
*""*""******V**********
**********V***********
VERIFICATION PERIOO CRJTERTON VALUES 0,3 O,U 0,5 0,6 0,7 t t t t t 0.8 t**v*
°tc, t 1,0 l'*****11******
*_V***
*********_***V**_**********
-_**V***
**********V***_**I
*****V****
*******",,***V********I
******V******
***V**
************.*1/***************
uac
CEG
ERM NAMTAN
l'IAIIsu
PRM Nlt/S DAYuse
CEG
ERM NA".UN
HBV
SU PRM Nit/a DAY 1 N o 1FIGURE 7. '·'(int 1 r,Rr>I.'rS lUS.!' UN rcmF TllfNf:F. INTfRVAL5 CALCUlATED ~Y JACKKNIF~ 5TATISTlt CRITERJON NTp
OTCH'~fNT nURANCE RIVER CFRAt\JCEl
f:OMPLE H. YEAR
C A LI A PAT T
m'
P E RI (Ill V~RIFICATlnN PERlOOEHf-' '">AY Pp~' CFrl HfW TA~I f,;A'-' !'>SA "HC NWS "AY fRM PRM NA'" SRM UBC 55A CEQ TAN MBV NWS
Ni'i!'\
...
*
•
'"
n NWS 0use
."'"
*
() HfW*
*
...
'"
'"
..,
0 55A ... ... Cl TAN..,
'"
*
*
'"
0 NA'"..,
*
0CEn
'"
'"
*
..,
0 TAN ...'"
0 55A'"
'"
..,
0 HBV'"
'"
*
0 IIBC..,
",*
0 CEfJ*
*
*
(l SRM ", 0 PR'" ...'"
Il NAM 0 DAY*
0 PRM*
*
0 ER'" 0 fRM*
0 1 DAY 0 N SNO,"MEl. T 5F.ASONCALI8RATJON PERIOO VERIFICATION PERlOn
nAY ER'" PRM ~iflV CEO S5A TAN 1113r. NW5 NAM nAY ERM PRM 55A use TAN SRM Mev eEQ NAM NWS
NA'"
*
",...
'"
(1 NWS*
*
",'"
0 NI'IS...
'"
...
U ~IAM*
*
..,
0 UHC*
*
(J CEG ",*
'"
0 TM) ",...
0 HBV ",'"
",*
0 55A 0 SRM*
'"
", ", 0 CU~'"
*
'"
'"
0 TAN*
'"
'"
0 H8V*
*
'"
0 IIBC'"
*
0 PH'"'"
'"
(l 55A !lit 0 ER" ." Cl PRM 0 IlAY Il FR'"...
0 OAY 0-22-2-
Fri edman ' s non-parametri c two-way ANOVA based on ranks, whi ch i s not
sufficiently sensitive in discriminating between models.
3-
The Jackknife stati sti c whi ch can take i nto account the di fferent
variabilities of the models but cannot provide non-symmetric confidence
intervals which are more realistic in sorne cases.
In addition, the
Jackknife i s val id only for i denti cally and i ndependently di stri buted
random variables. Consequently, it was necessary to subdivide the data
into complete years, which reduced the number of groups used in the
computation of the Jackknife statistic.
Despite this 1 imitation, it
was decided that the Jackknife statistic is to be preferred to the two
other methods.
B.
RESULTS
1-
An examination of the tables and graphs of the verification criteria
indicates that there is an overlap between criterion values and
consequently it is desirable to estimate confidence intervals.
2-
The confidence intervals of the criterion values based on the jackknife
statistic indicate that the models can be classified into groups within
which the performances are not significantly different.
In this case,
model performance must be evaluated on the basis of factors other than
the numerical verification criteria.
-23-REFERENCES
EFRON, B. and GONG, G.
(1983).
liA leisurly look at the bootstrap, the
Jackknife and cross val i dati on".
The Ame
ri
can Stati sti ci an, February,
37(1).
HOLLANDER,
M.
and WOLFE,
D.A.
(1973).
"Non-parametric statistical
methods ". John Wi l ey
&
Sons, New York.
MILLER, R.G.
(1974).
"The Jackknife - a review".
Biometrica, January,
vol. 61.
MOSTELLER, F. and TUKEY, J.
(1977).
"Data analysis and regression".
Addi son-Wesl ey.
QUENOUILLE, M.
(1949).
"Approximate tests of correlation in time series".
Journal of the Royal Statistical Society, Serie B, vol.
11.
QUENOUILLE, M.
vol.
43.
(1956).
"Notes on bi as in estimati on".
Biometrica,
WMO.
(1982).
"WMO project for the intercomparison of conceptual models of
snowmel t runoff".
Hydrol ogi cal Aspects of Al pi ne and Hi gh Mountai n
Areas (Proceedi ngs of the Exeter Symposi
um,
July
1982).
IAHS Pub
1.
AN~JlJ Al CRITErHON VALUfS R
CATCHMfNT DURANCE RIVER (FRANCE) COMPLETE YEAR
URe CF(l ER'1 N4M TAN HAV SRM S5A PRM NWS DAY
CAL bQ-10 •• 07~ -,103 ,0 'I .032 ",124 -,018 .. 1,000 ,001 .,0 88 -.013 -,125
CAL 70.71 -,050 ,OAI ,100 ,130 ,0 03 ,OH -1,000 ,105 ,077 ,045
·,13q
CAL 71-72 .05b ,002 .113 ,l' 7 .. ,045 -,073 -1,000 ",Otq -,OOq ",OflO ,135
CAL
n ..
73 -.OS/) ,080 -,00;& ,04Q ,107 o12J ,,1,000 ,021.1 ,045 .. ,035 .. ,Ot4CAL 13.74 ,1 4 1 ,001 -,0 7 0 -,O?I.I .. ,011 ",03b .1,000 ".11 fi .. ,005 .. ,Ofl2 ,077
CAL 11.1.15 ,057 ,002 .1~7 .030 ,004 ,029 ,020 "',0&5 .. ,021 .. ,075 .1411
VER 75-7/) .07q .0&9 .lA7 ".01& ,019 ,007 .,041 5 -,055 -,032 .. ,022 ,1.131
VER 7b-17 •• 033 .Oll2 -.2bS .104 -,030 ,123 .0bO ,013 ,013 ,022 ",4113
VER 71-78 .108 .075 -.30ll ,t99 ... 088 -.020 -.Ob& -.021 el 04 -.002 ... :510
VER 78-79 ... 009 ,OAC) .03') ,337 .001i •• 032 ,OH , 114 ,23& ,141.1 ",018
1
N ...
1
SNOWMEL T SF.ASON
CAl. ,.,Q.70 -.lt1 -.lto -.OALI .006 -.127 .. ,051 _1.000 .012 -.010 .. ,OC'l4 ",lbl.l
CAL 70-71 -.094
• o
'Sc; • 0 1 () .039 -,03b ,Obi -1,0 00 ,115 .139 .070 -.161.1CAL 71 .. 72 .0114
. °
13 .2 70 .OlH -.022 ... 0&4 .1.000 -,011.1 ,085 -,015 ,l'50CAL 12_73 -.033 .0'!2 .158 -.001 .11 0 .232 .. 1.000 .104 ,2U2 _.OflO ,004
CAL
n ..
7lI .O~l -.115 ,2413 -,107 ... 1'55 ·,131.1 ·1,000 ... 141.1 .015 ... lUq .078CAl. 7U- 75 .l3U .053 .2A7 -.002 .026 -,025 ,031 ... 02S .173 ... 053 ,22C'1
VER 75-7& .OA7 .017 .657 -.09b -.072 ,017 ,042 .008 ,150 _,000 .708
VER 1t:.-77 -.040 ·.Ob5 -.2 9 1
-.ua]
-,11.13 ,039 .03& "'.053 -.0 9 1.1 ,011 -.1.100VE~ 77 .. 76
...
o~" -,lJ7 -.3~6 -,Olq ·,137 -,022 -,0'52 ".01.12 ".lb2 _.07& .... 311.1ANNUAL CRrTERIoN VALUES NTD
CATCHMENT DURANCE RIVfR (FRANC~)
COMPLETE YF.AR
URe CfLJ ER~' '~AM UN HRV SRM SSA PRM NWS DAY
CAL flQ-70 ,Q2q .9?1 ,1'\12 ,954 .S9b ,'n1 .. 1.000 .904 ,920 ,9tH ,844
CAL 10-11 .fl9 b .910 .815 .894 ,935 .8bO -1.000 .881 ,830 ,910 .793
CAL 71-72 .Il A1 ,q?S .7~O ,901 ,'128 ,891 -1.000 .90& ,853 ,909 ,198
CAL 1?-73 ,Qt2 .&41 .oq2 .637 .130'1 ,0Bh .. 1.000 .921 ,&85 .921 .700
CAL 73 .. 74 .875 .7A4 .637 ,883 .919 ,8Stl -1.000 .8'10 ,880 .8&3 ,804
CAL 74.75 .862 .834 .61.12 .677 .823 ,875 .934 ,893 ,&84 .808 ,732
VER 75.76 .357 .31& -.780 ~ 7AQ ,b1\8 ,81.15 ,837 .838 .323 .142 .1,009
VER 7&-77 .B73 .8R4 .700 .8&0 .881.1 ,61h ,60S ,897 ,75& .939 ,4&2
VER 77-76 .604 .81,7 ,50S .620 .625 .922 ,8 9 3 ,822 ,tl21.1 ,920 ,485 VER 7S-H .961 .935 ,7°7 .875 .972 .922 ,845 .91& ,880 ,929 .774 1 N (Xl 1 SNOwMEL T SE ASON
CAL &9.70 .817 .921.1 ,833 .977 ,8&2 .911.1 .. 1,000 ,633 .8 9 7 ,928 ,&97
CAL 70 .. 71 .852 .837 .807 .83b .847 ,578 .. 1,000 ,6C/6 ,567 ,'180 ,1.138
CAL 71 .. 72 .737 .889 .5&1 .873 .888 ,750 .. 1,000 .780 ,72Q
• seo
.522CAl. 12·73 .S8/J .39" .621 .827 ,71.11) ."1.11 -1,000 .880 .417 .8CJO ,I.I/)q
CAL 73 .. 71.1 .80:;0 .691 ,584 .833 ,8&2 .719 .. 1.000 ,H3 ,7 9 1) ,758 ,b9S CAL 7/J .. 15 .709 .696 .3(:,3 .826 ,586 .7&2 .907
.6,n
.437 .1:160 ,391 VER 7'5.76 ... B98 ... 371 -4.617 .727 .321 ,821 .611.1 .732 •• 728.379
-l,flli vE~ 7&-77 .bS" .81'11 .282 .93b ,832 ,75Q ,811.1 .822 ,flZ2 ,924 .. ,159 VER 77-78 .82b .8 8 1 .39Q .889 ,731.1 ,90t ,925 .693 ,ô 9 O ,901.1 ,328 VER 78 .. 19 ,9~q .952 .7bl.l .91.13 .9(:,3 ,883 .72b ,872 ,835 ,9ô7 ,581AN/HIA!.. CRTTfRfON VALUFS S
CATCHMfNT DURANCE RtVFR (FRANCE ) COMPLETE YEAR
URe
cr::Q
t. R~' NAM TAN HElV SRM SSA FRM NWS DAYCAL 01:1 .. 70 .21.15 .20;1:1 .401 .I<1Q .21:16 ,232 .. 1.000 ,285 .2&1 .192 .'sb4
CAL 70.11 .271 .2Cj2 .3hl .213 .215 .31S .. 1.000 .21:10 .3 4 1 .253 .382
CAL 71 .. 72 .303 .21.11 .UllO .278 ,230 ,21:10 .. 1,000 .270 .338 .lbb .39&
CAL 72 .. 73 .20b .537 .1.1<17 .3b2 .3 C1 8 .503 "'1.000 ,252 ,503 ,252 ,4C11
CAL 13-74 .310 .408 .5?Q .500 .250 .333 -1.000 .30Cl ,105 .325 .36C1
CAL 1ll.7e; .313 .343 .503 .21:15 ,354 ,21:18 ,210 ,215 .413 .lMI ,435
VER 1'5 .. 10 .502 .'518 .835 .21:11 .350 .246 .2'53 .252 .515 .118 ,881 VER 7b·77 .21\7 .275 .41.11 .301 .215 ,340 .35b .251:1 ,3C1a .199 .51:11 VER 71·U, .3Q8 .327 .572 .31\2 ,370 ,251 .294 ,380 ,551 ,255 .b45 VER 7/'..7<1 .220 .21\2 • 4 CI CI .31:13 ,184 ,310 .u17 ,122 ,384 ,2!Jb ,S?? 1 N ~ 1 SNOWMELT ·SFASON CAl. bl:l·70 .20A .11:>1.1 .243 .01:10 ,221 ,174 -1,000 ,Z43 ,1 C1 1 ,15 C1 ,321
CAL 70 .. 71 .171 ,lA5 .202 .180 ,17C1 ,2C18 .. 1.000 .253 .302
.ZIS
,344CAL 71 .. 72 .2QI.l , 1 Q 1 .3AO .201.1 .1 C1 2 .287 .. 1.000 ,2&CI ,2 C1q ,1I~CI ,:SClo
CAL 12·73
.2n
.511 • III 0 .217,Bo
.41:15 -1.000 .231 ,482 ,2?1 ,480CAl 73·74 .2/J7 .3'55 .1.112 .2bl .237 ,33C1 -1.000 ,2C11 ,288 ,114 ,353
CAl 7ll-75 .2 78 .2ALI .IH 1 .215 .332 ,251 .151 .218 ,387 ,]00 .402
VER 1-;.70 .5b6 ./H\ 1 .QQ, .214 ,336 .174 ,117 .213 ,540 .324 ,882
VER 7b·77 .2bl .1bO .3Q3 .117 ,1QO ,227 .lb5 .II:1S .285 ,U8 ,4QCl
VER 77·78 .304 .252 .5b/) .2a3 ,370 ,22Q .200 ,404 ,40b ,22t1 ,SQ8
ANNIJAL CRITl'.RION VALUfS
NS
CATCHMFNT DURANCE RIVER (FRANCE) COMPLETE YEAR
URe CFQ E~~ NAM TAN HAV SRI" 5SA PRM NWS DAY
CAL b9.70 .54b ,/.IQ3 -,212 ,702 .330 ,59/.1 ·1.000 ,385 .487 .722 0,000
CAL 70.71 ./.IQ1 ,5b7 ,lOb ,/.11'9 ,blHI .321 .1.000 ,/.123 .205 ,5b3 0,000
CAL 71·72 ,1.1 \3 , bt)C~ -,23t. ,506 .b4b .4b3 .1.000 .533 .273 .51.19 0,000
CAL 72-73 ,7 0 7 -,1 9 & -,026 ,45b .345 -.OU7 -1.000 .737 -,01.19 ,737 0,000
CAL 73-7/.1 .30& ·,099 .,6
a
b ,40b ,58& ,Zob -1.000 ,368 ,387 ,303 0,000CAL 7h75 .4 8 4 ,31\0 ·.330 ,5/.10 .340 .531 ,753 ,bOl .. , .61 ,,z84 0,000
VER 75-7& .&80 ,6159 .114 .893 ,8/.15 ,923 ,IHI1 ,Q19 ,6B • 8 Té! 0,000
VER 7&-17 .7&4 .78/.1 ,/.IU2 ,741 ,184 ,6158 .637 ,608 ,5 4& ,887 0,000
VER 17-78 .&18 ,71J2 .21/.1 ,649 ,659 ,8/.19 .7 9 2 .6'511 ,2&9 ,844 0,000
VER 78-H ,820 .714 .104 ./.IIJS ,878 .b5S ,315 ,&27 .1.111
.""6
0,0001 W 0 1 SNOWMELT SF.ASON CAL b9-70 .S95 .751 ,450 ,921.1 .543 ,717 .. 1.000 .1.150 .b61 ,761 0,000 CAL 10.71 .73b .711 .0Sb .709 .728
.2U9
·1.000 .459 .22Q ,"09 0,000CAL 71 .. 72 .111.11) .7bl .080 .735 ,7b5 .47ô .. 1.000 .53 9 .432 .7u8
o,ono
CIIL 72 .. 13 .782 -.131.1 .21\b ,b75 ,521
-,OUI
.. 1.000 .774,ou
,7CJ3 0,000CAL 13 .. 71.1 .509 -.014 ... 3bl.l .4'53 .51.19 ,080 ·1.000 ,320 ,333 ,208 0,000
CAL 71.1 .. 15 .5~1 .501 ... Ollb .711.1 .320 ,b10 .8117 .707 .075 ,4u2 0,000
VER 70:;.7& ,5 A9 .703 ",lb1 .9ul .853 ,961 .CJ60 .9U2 .625 .8b5 0,000
VER 76 .. 17 .727
,a
q7 .3AO .9u5 ,855 .792 ,891 .BQ1 ,b7U ,934o,ono
VER 77.76 .7/Jl
.Bn
.lO/) .635 .b05 .853 .686 .SU4,sn
.8'51 0,000ANNLJAL CRITER!QN VALUES R
CATCHMENT W3 • WATERSHED (USA) COMPI.ETE YfAR
UsC CEQ ERM NAM TAN HSV SRM UA pRM NWS DAY
CAL "S .. b9 .~OJq •• 0110 "1.000 ~ObO ,008 ,009
·,124
.,003 •• 122 •• 033 .,049CAL 69.70 ~028 ,009 ·1.000 .108 ,005 .083 • ,192 .,009 .,033 .,001 ,231
CAL 70·71 ,0 93 ,Ob7 ·1.000 :247 ,OU .130 ·,050 ·,004 ,055 .~OlCJ .aCJ'
CAL 71.12 •• 010 •• OT7 ·l~O(lO ~ 074 •• 057 ,0.,7 ·,081 ·,045 •• 101
.t
011 ,lUCAL 72 .. 73 .ot2 ,037 ·1,000 ,147 ~031 ,052 .,OZ4 .,001 ,010 ,015 •• 151
CAL 73.74 .~OOZ .003 ·l~OOO ,ll5 .,005
,on
·.101
,048 .,025 .019 •• 224VER 7h75 '.11a .1U ·l~OOO ~lbé»
,on
.l08 •• 1 if, .081 .041 ,060 .166VER 1S.Té» .~041 .,017 ·1',000 ~OH -,023 .,000 .,092 .,065 .,024 .~016 .,U1
VER 7&.77 ~014 .040 ·1.000 ~056 • ,051
,14o
• ,lj!( • .,044 •• OU ,009 ,017VER 71to7S .011 ·.008 ·1.000 .050 .,092 , 038
•• an
,0:51 .,0'9 ,030 •• 094w
SNOWMELT SEASON
CAL o8eb9 .~ 139 ·.0110 .1;'000 .,.059 ,018 ,003 .~O'O ,007 .,083 ~007 _,110
CAL bq.70 .~Obo .,005 ·1.000 •• 133 .,073 .,08b .,Ob7 ·,OTS •• 178 ",Ill ,284
CAL 70.71 •• 004 -.0!3 -1.000 .~044 ,040 .,015 ,057 .,Ob6 ·,Ili .,049 ,093
CAL 7t.12 •• 041 ~004 ·1.000 .,145 .,040 .,015
•• on
.,044 .,08b .,032 .042CAL 72.13 •• 009 .093 ·1~OOO ~ 013 ,055 ,098 ~o:u .038 .,048
,lla
,041CAL
n.74
•• 015 .091 ·1.000 •• 083 .,OU .,057 ·.077 .~OOl .,079 .010 •• 153VER 7Il0075 ~075
. °
tél -1.000 •• 070 .018 ,040 ·,087 ,104 ,004'ou
,1 .438VER 71h1O -.159 •• Ob4
·1.000 .:2A2 ·,133 -.lCt7 ,007 -,09a
.,115
•• 0/J8 .,124VER 7"-17 .040 ,0119 -1.000 .~049 ,044 ,025 -~1'lS
,ou
_,01'
on
,158ANNUAL CRITERION VALUES NTO
CUCHMENT W3 '" WATERSMED (USA' COMPLETE YEAR
USC
CEQ
ERM NAMTAN
HBV SRM lUfil"'"
NWSOAY
CAL &h&q ~874 .7&0 -1.000 ~ 714 .cUq .820 .871 .784 .841 ~'S4 ,&'7
CAL &9.70 ,tHO .809 .1,000 ~82S • CHIS ,871 .808 .'30 .8h .914 .5'5
CAl. 70 .. 71 ,8b4 .733 ·1.000 ,848 .952 ,891 .8U ,'05 .810
,'67
,&57CAL 71.72 ~938
,8'&
·1.000 .908,cnz
.931 .861 .'14 .83& ,9ft7,'93
CAl. 72-73 ~8bl .503 -1.000 ,774 ,cn2 .811 .109 .861
,Ut
,921
.iOSCAl.
n.74
.840 .033 ·l~OOO .81ô .8ll ,819.n.
.U8 ,188 ,'04 ,548VER 74.15 '.7bÔ .702 ·1~000 .&CJS .7h .711 .720 ,761 ,rCJ4 ~ee4 ,3b4
VER 15.7& ~802 .774 ·1~000 ~n4 .723 ,825 .1CJS ,832 .7CJI> .8afl .077
VER 7h71 .754 .&&2 -1.000 ~777 ,8ftl .Tl4 .b75 ,804 .712 .CJS4 .,205
VER 7h78 ~7U .335 -1~OOO ~841 .877 .ftS! .bOCJ
.us
.801>,'13
.UôW N SNOWMELT SUSON CAl. M-(,9
'. a
l ' .bft8 -1~OOO :119 .947 ,777 .858 .723 .814 ~'93 l U ' CAL (,1"-70 ~909 .853 -1.000 ~8CJ7 .948 ,934 .8417 ,928 ,825,'19
.581
CAL 70.11 .899 .8U -1.000 ,CJ27 .q34 ,908 , CJ1f> .877 • 84ft,'5'
• U8 CAL 71-72 .Q41 .8R4 -1.000,'11
.'1&
.'14 ,850 ,CJ40 .79a
,'1>4 ,532 CAl. T2-73 ~bl0 .524 -1.000 .7U.73S
.304 .ôCJ7 ,449 .1>74 ,077 -.801> CAL T:h74 .8b7 .bS. -1.000 .TCJ8 ,ô31 ,84ft ,702 .837 .ôU .841 ,51>5 VER 711-75 ~q14 .748 -1.000 ~839 .~77 ,8b5 .714 ~1>33 .C,28 .840 .408VER 75-10 ~ 733 .711 -1.000 ,.ô58 .528 .80' .84CJ .7U .Tb4
'us
-,3bSVER
Tb.n
.714 .7QC, -1.000 ,837 .824 .7111 ,70l .ft8ô .773 :a.CJ -"CJoANNUAL CRtTERION VALUES S
CATtHMENT W3 - WATERSHEO (USA' COMPLETE YEAR
use
CEQ ERM NAM TAN HBVSRM
SU PRM NWS DA'/'CAL bS.ÔC, ~5t8 .71'5 -1.000 ~bqll .300 .ôlC, ,520
,uc,
.581
,1121 .803CAL bq·70 '.458 .5150 -1.000 ~SlO ,2'1 .1145 ,557 ,330 ,544
.:sn
.808CAL 70-71 ~oOb .848 -1.000 .041 .301 .542 ,S'8 ,507 .7to
,soo
.'ftlCAL 7h72 ~lql .500 -1,000 ' 470 .408 • lU 1 .5U ,4011 ,U!!
,zu
1,001CAL
72-13
.457 .810 -1.000 '1$83 fi .319 ,533.oô!
.1153 .404 ,331 1.0llSCAL 73-711 .42C, .0Uq -1.000 .45C, .1152 .372 ~S48 .444
.",,,
.nl
.720VER 7""75 ~5*,8 .0UO -1'.000 '048 ,543 ,031 .021 .5'74
,sn
~400,'U
VER 75.7& ~IIq3 ,520 -1.000
~571
.583."61
.su
,4116 .500,:sn
1,004VER 70-17 1'510 .028 -1.000 ~5tO .403
.SU
~oU, ."78 ,51ft ,318 1.180VEFl 7h78 .582 .887 -1.000 '.4311 .381 ,040 ,080 .UIf
,'ln
.:uo
,88ftw w
IINOWIo1ELT SUSON
CAL bhoC, ~32q .545 ·1~000 • 501
,218
,'III*, .350."'8
,40a ' lft' ,577CAL bh70 ,3 05 .380 -1.000
~323
.22Q,258
,l'" ,~70 .U2~&!8ft
,ft92CAL 70-71 ,321 .1110 -1.000 ~272 ,260 .301 ,ilql .355 .3'7
,ao?
.550CAL 71-72 ,280 .401 -1.000
:.31q
.34l
.304 .455 .288.sa,
,us
.80ftCAL 12.73 .340 .310 -1.000 ,.2'3
.281
.455 ,300 ,405,:s
11
~3S0 ,133CAL 73 .. 74 .2&0 .4 i!1 -1.000 .329 .4114 .288 .400 ,2'5 .1125
,a'2
.'182VER 74-15 . 2&3 .11'50 -1,000 ,3'59 ,509 .3n ,419 ,543 .240 ~:S158 .fl89
VER 75-70
'H7
.413 -1.000 ,1149 .527 .335.l"
,375,312
, 312
~n.,
VER
1&-17
' 1132,
,405 -1.000 ,327.nq
,4t2 ,441 .453 .385,l'3
1.021ANNlJAL CRITERION VALU!S NS
CATt;MMENT
wl
- WAT!RSMEO CUSA) COMPI.ETE YEARURt; CEQ ERM NAM
TAN
MBV SRM SU PRH HW8 DAYCAL b8-69 ~S85 .2(\6 -1.000 ~25:S .798 ,400 .S80 ~Z8S .4 17 ,718 0,000
CAL b9_70 .b79 ,527 -1.000 .569 ,8bS .091 ,525 ,821 ,5 4ft ,788 0,000
CAL 10-71 ~o03
.Z21
-1.000 ~SSS ,659 lô82 ~U3 .'122 .445 ,903 0,000CAL 71-72 ~81.17 .71.114 -1,000 ~7U ,814 ,831 ~o58 .837 ,!S97 , If 19 0,000
CAL 72-73 .625 .450 -l~OOO .715 ,9tS ,76a IU4 ~828
.8H
,If 08 0,000CAL 73-14 ~b45 .188 -1.000 .593
."0.
,'133 • 4U....
,5:10 .78' 0,000VER 7(1.75 ~ôll .532 -1~000 .521 ,bU ,546 ,5&0 ,U4 ,,,'1,
,811
0,000VER 75-70 ~7h .755 "1.000 ~71Z ,700 ,811 ,778 .818 ,779 .87b 0.000
VER 7&-77 ,7 9ô .720 -1.000 ~815 ,884 .77 t
,no
,8ll! ,8ll ,928 0,000VER 77-78 ~50q
-,OOl
"1~000 .7&0 ,815 ,418,411
,41f" ,707.U.
0,000w
~
SNOWMELT SUSON
CAL 6S.69 :615 .10ô -1,000 ~Z45 ,857 .400 ,ô18 ,254 ,499 ~7t3 O~OOO
CAL 69.70 ,782 .649 -1.000 ~ 754 ,877 ,843 .ôn ,U9
,SU
,a07 0,000CAL 70.71 .b66 .1456 -1.000 • hO ,781 ,"95 ,'122 .591 ,490 ,a61 0,000
CAL 71-72 ~874 .752 -1.000 :822 .820 ,858 ~ fil 0 .872
,slta
,U4 0,000CAL 72-n .. 784 .137 -1'.000 ~841 ,853 ,bU ~ua ,ft95
,au
,au
0,000CAL 13-74 .095 .215 -1.000 .536 ,l'51 ,é45 .l14 ,ft25 ,224 .U4 0,000
VER 74.75 '.654 ,513 -1~OOO ~728 ,453 ,773 ,517
,n9
,8'1' ~ 730 0,000VER 7S-h ~805 .1f18 -1.000 ~750 .055 ,8bO
• en
,825,Ble
,874t 0,000VER 7&-17 .821 .843 -1.000 .SQ8 .8QO ,838 ,813 ,803 ,858 ,4t18 0.000