ORIGINAL PAPER
On the electrochemical activity of
β-lead dioxide in sulfuric acid
solution: a comparative study between the chemical
and electrochemical routes
I. Derafa1&L. Zerroual1&M. Matrakova2
Received: 21 September 2017 / Revised: 5 December 2017 / Accepted: 9 December 2017 # Springer-Verlag GmbH Germany, part of Springer Nature 2017
Abstract
β-Lead dioxide is prepared by chemical and electrochemical routes. The chemical sample is obtained by dissolving lead tetra-acetate in distilled water at room temperature. The electrochemical sample is prepared by oxidizing cured plates in sulfuric acid with 1.05 g cm−3specific gravity. The two powders are indexed asβ-PbO2. The sample prepared by chemical route presents smaller crystallite size. When cycling the two powders up to 100 cycles between 0.5 and 1.5 V versus Hg/Hg2SO4reference electrode, the electrochemical sample presents higher values of anodic and cathodic peak current densities and higher discharge capacity. Thermal analysis and electrochemical techniques are used to explain this difference in activity between the two samples. Keywords Lead dioxide . X-ray diffraction . Capacity . Crystallite size . Structural water
Introduction
Anodically formed dioxide coatings on lead and its alloys comprise a mixture of two polymorphic forms of PbO2: or-thorhombicα-PbO2and tetragonalβ-PbO2[1,2]. In the con-ventional process, the formation of PbO2starts at the interface grid/electrolyte in the corrosion layer then advances in the cured paste. The relative amounts of the two polymorphs of PbO2depend on the conditions of manufacture, i.e., positive paste density, specific gravity, and temperature of the forma-tion acid, as well as formaforma-tion rate.
The stability ofα- and β-PbO2in sulfuric acid was deter-mined by Rüetschi et al. [3]; orthorhombicα-PbO2was found to be considerably less stable than tetragonalβ-PbO2. Both modifications readily reduce electrochemically to PbSO4, and the discharge capacity ofα-form is lower than that of β-PbO2.
Many studies have been reported in the literature concerning the electrochemical activity of both chemical and electrochemical positive active material. Compared with chemically prepared PbO2, which is reputed to be chemically less active form, material prepared by electro-chemical formation of positive plates of lead/acid batteries exhibits high electrochemical activity. It was found that in general electrochemically prepared lead dioxide is non-stoi-chiometric, whereas chemically prepared PbO2is nearly stoi-chiometric [4,5].
The origin of the electrochemical activity of lead dioxide was largely documented in the literature. Caulder et al. [6] studied the effect of thermal decomposition of formed and cycled lead dioxide electrodes on the capacity loss and battery failure. They made in evidence the existence of an electro-chemically active amorphous form of PbO2. When cycled to failure, it is converted to an electrochemically inactive form of PbO2. This later form of PbO2gives DTA results similar to those obtained on chemical reagent PbO2. Turner et al. [7] confirmed that chemically prepared PbO2can be used to give capacity with a utilization similar to that of commercial elec-trochemically formed plates. Taylor et al. [8,9] proposed a process for making positive battery plates not requiring curing or formation and using high surface area chemically prepared lead dioxide mixed with TTB or lead sulfate. Successful use of chemically prepared PbO2is demonstrated.
* L. Zerroual [email protected]
1 Laboratoire d’Energétique et Electrochimie du Solide (LEES),
Faculté´ de Technologie, Université´ Ferhat ABBAS, 19000 Sétif, Algeria
2
Institute of electrochemistry and energy systems (IEES), Bulgarian Academy of Sciences, 1113 Sofia, Bulgaria
Moseley and Bridger [10] showed that chemically prepared PbO2can be used for both flat and tubular plates. In the case of flat plates, the function of the curing process will need to be replaced by a binder to hold the active material in place, but for tubular cells, it should be possible to pour neat powder in the separator bags, which will retain the active mass in position.
Other researchers comparing chemically and electrochem-ically prepared PbO2found amorphous parts of lead dioxide in the electrochemically prepared sample [11]. The decrease of positive plate capacity was related to the conversion of the active amorphous lead dioxide to the inactive crystalline form during cycling. Tokunaga et al. [12] found that when aniso-tropic graphite is added to the positive paste, the porosity of the positive active mass increased. In addition, its capacity increases remarkably and also cycle life was improved.
Rüetschi [13] studied the effect of crystal structure and interparticle contact on the capacity of chemically prepared samples ofα-PbO2andβ-PbO2mixed with various quantities of graphite. He concluded that electrodes ofα-PbO2with high degree of structural disorder presented a higher discharge per-formance than those of well-crystallizedβ-PbO2. A new con-cept which views the structure of PAM as a gel-crystal system with electron and proton conductivity has been proposed by Pavlov [14]. The same author in collaboration with his co-workers [15] found that gel zones represent more than 30% of the surface layer of PbO2.
Monahov et al. [16] made in evidence the existence of hydrated structures in the anodic layer formed on lead elec-trodes in H2SO4solution. At a given potential, Pb4+ions are formed on the electrode surface. These are unstable in aqueous solutions and form Pb(OH)4. The Pb(OH)4is dehydrated par-tially or completely giving PbO(OH)2and PbO2. The elec-trode surface is covered by a layer of PbO2, PbO(OH)2, and Pb(OH)4, which layer has gel-like properties.
Pavlov [14] proposed that during the discharge of the pos-itive battery plate, the reduction of PbO(OH)2to PbSO4 pro-ceeds in two stages. The first is electrochemical and occurs in the bulk of the agglomerates and particles and gives Pb(OH)2 according to Eq. (1):
PbO OHð Þ2þ 2Hþ þ 2 e−→Pb OHð Þ2þ H2O ð1Þ
During the second stage, PbSO4 formation takes place through a chemical reaction between Pb(OH)2and H2SO4. It can be expressed by Eq. (2):
Pb OHð Þ2þ H2SO4→PbSO4þ 2H2O ð2Þ
In a previous work [17] using an all solid-state system exempt of H2SO4and combining the kinetic tests and coulo-metric measurements, we showed that the mechanism of PAM reduction includes two electrochemical stages (one electron is consumed during each stage) taking place in the gel zones
according to a proton-electron mechanism or a double-injection process as indicated in Eqs. (3) and (4):
PbO2þ Hþ þ e−→PbOOH ð3Þ
PbOOH þ Hþ þ e−→Pb OHð Þ2 ð4Þ
In the light of these findings, it follows that such a mechanism may be possible only if PbO2is both electron and proton conductive. The role of structural water in the activity of the positive active material has been empha-sized by many authors. Hill et al. [18] examined PbO2 samples taken from positive plates of lead-acid batteries and reported that hydrogen is incorporated by surface hy-drolysis during crystal growth. In their studies on the role of hydration water in the reduction process of α- and β-lead dioxide on the capacity loss, Fitas et al. [19–21] showed that the removal of the OH− groups from β-PbO2 needs an energy twice that of the α-form. In addi-tion, the capacity decreased when structural water is re-moved. This loss of capacity is important when α-PbO2 samples are considered.
In our previous work [22], we used an all solid-state system and estimated the proton diffusion coefficient for both fresh and heat-treated α- and β-PbO2samples. We demonstrated that the removing of structurally bonded water affects consid-erably the electrochemical properties of PbO2and leads to a decrease in the value of the proton diffusion coefficient. A new mechanism of PbO2reduction was proposed.
In their work, Morales et al. [23] prepared lead dioxide samples with particles ranging from nanometric to micrometric size and tested them as positive active material in lead-acid cells. They showed that the combination of nano-structured particles and the presence of water strongly bound to the PbO2lattice are essential to ensure a high utilization and cycling performance of positive active material.
Recently, Yang et al. [24] combined capacity tests and XPS analysis and found a good correlation between the cycle life of positive active material and hydrated PbO2content.
Much speculation regarding the activity of lead dioxide exists in the literature. The majority of the authors who treated this subject concluded that chemically prepared PbO2is high-ly crystalline and less active than electrochemicalhigh-ly prepared PbO2which is partially crystalline and more active. No com-parative data between the two samples concerning the contri-bution of hydrogen in the mechanism of PbO2reduction are found in the literature.
In the present work and through a comparative study be-tween two PbO2samples obtained by chemical and electro-chemical routes, we try to understand the difference in the activity of the two samples and the contribution of hydrogen in the mechanism of PAM reduction in sulfuric acid solution. Different techniques of investigation were used.
Experimental
Preparation of samples
Chemical lead dioxide was obtained by dissolving lead tetra-acetate in distilled water. A 4.43 g of lead tetra-tetra-acetate was dissolved in 25 ml of distilled water and stirred during 30 min at room temperature.
Electrochemical lead dioxide was prepared using the con-ventional process. Positive paste with a density of 4.2 g cm−3 was prepared by mixing lead powder with water and sulfuric acid of 1.4 g cm−3specific gravity (5 wt% (w/o) with respect to lead powder). This paste was applied on grids (123 × 143 × 1.6 mm) cast from Pb-Sb-Se alloy. The positive plates made from this paste were subjected to saturated steam at 65 °C and 80% of relative humidity for 1 day then air dried for another day. The plates have a porosity of 51% and the water content afterBdrying^ is not exceeding 0.2%. Cured plates having an active mass of 106 g were first soaked for 72 h in1.40 g cm−3 H2SO4and then formed for 20 h under a constant current of 0.5 A/plate in1.05 g cm−3H2SO4.
The two samples of lead dioxide powders were washed in distilled water for several hours to remove the excess of elec-trolyte and then dried at 110 °C. They were ground in a mortar, homogenized, and set to X-ray diffraction, chemical analysis, thermal analysis, and SEM examination.
XRD characterization
The positive active materials were characterized by XRD analysis using an APD-15 Philips 2134 diffractometer with Cu Kα radiation (k = 1.54178 nm). The changes in relative intensity of the X-ray characteristic diffraction lines for the different phases in PAM were adopted as a measure of the phase changes in the positive active material. It is defined as the ratio of theBI^ phase characteristic reflection intensity and the sum of the intensities of the characteristic diffraction lines of all phases. Radial scans were recorded in the reflection scanning mode with 2Θ being changed from 20° to 40°.
Bragg’s law, defined as nλ = 2d sinΘ, was used to compute the crystallographic distance (d) for the examined samples. The average crystallite size was calculated from the full width at the half maximum (FWHM) using Scherrer equation.
Thermal analysis
Thermogravimetric analysis (TGA) and differential scanning calorimetry (DSC) tests were performed using instruments supplied by Metler Toledo: TGA/SDTA 851eand DSC 822e, respectively. All measurements were carried out in a nitrogen atmosphere at a gas flow rate of 80 cm3min−1for DSC and 50 cm3 min−1 for TGA at a constant heating rate of 10 K min−1.
Electrochemical investigations
Electrode preparationA conductive carbon rod with a surface area of 1 cm2was em-bedded in a Teflon tube. Neat positive active material powder without additives was poured in the cavity of the electrode and hand-pressed to form a compact film of PAM around 1 mm in thickness, the film is covered with a micro-porous separator.
Electrochemical tests
All electrochemical tests were carried out in a three-electrode cell. The working electrode is at 1 cm distance from a plati-num rectangular-shaped counter electrode having an apparent surface area of 5 cm2. Hg/Hg2SO4/saturated K2SO4is used as reference electrode. Galvanostatic discharge, cyclic voltamm-etry, and electrochemical impedance spectroscopy were used as techniques of investigation. All experiments were carried out at room temperature in 1.28 g cm−3H2SO4solution.
The electrodes were discharged at a constant cathodic current of 20 mA g−1, and the potential versus capacity curves were recorded. The capacity of the PbO2electrode is determined.
The potential-current curves were recorded after cycling the electrodes in the potential range 1.5 to 0.5 V at a sweep rate of 50 mV s−1. The capacity expressed in mAh cm−2is determined by integrating the surface area of the cathodic peak corresponding to the reduction of PbO2to PbSO4.
For each impedance measurement, a fresh PbO2electrode is prepared and immersed in the electrolyte. After a rest of 15 min in the solution, impedance scans were performed in the frequency range from 100 kHz to 10 mHz at a signal amplitude of 10 mV. The corresponding Nyquist plots were recorded at open-circuit potential and under cathodic polari-zation (900 and 800 mV, respectively).
Results and discussions
Chemical analysis
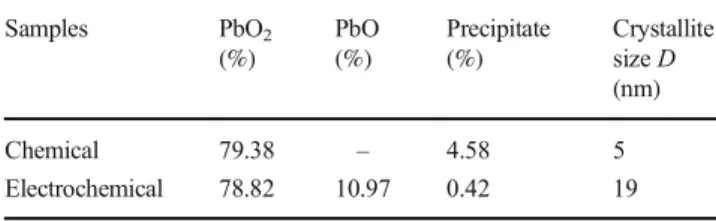
Table 1 summarizes the obtained data for the chemical composition of PbO2 samples prepared by chemical and
Table 1 Results from chemical analysis and crystallite size calculated from FWHM method for chemical and electrochemical PbO2
Samples PbО2 (%) PbO (%) Precipitate (%) Crystallite size D (nm) Chemical 79.38 – 4.58 5 Electrochemical 78.82 10.97 0.42 19
electrochemical routes, respectively. The data indicate that the content of PbO2 in the two samples is the same. It
represents around 80% of the total mass. The residue in the electrochemical sample is metallic lead, lead sulfate, and other additives. For the chemically prepared sample, the residue is lead oxide (not determined).
XRD analysis
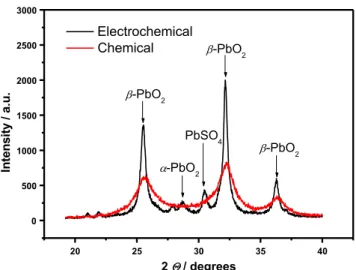
As shown in Fig.1 for both chemical and electrochemical samples, changes in peak intensity and width are observed depending on the conditions of preparation. The XRD data indicate that both samples comprise β-PbO2crystal phase. The XRD patterns of chemical lead dioxide powder showed that all detected peaks were identified to beβ-lead dioxide. In addition of the β-phase, small amounts of α-lead dioxide (13%) and PbSO4crystals (21%) were detected in the electro-chemical sample. Chemical PbO2yields broader peaks with low intensity, such diffractograms may be attributed to amor-phous part in the phase and to H2O incorporated in PbO2 structure. This is also indicative of smaller crystallites. PbO2
20 25 30 35 40 0 500 1000 1500 2000 2500 3000 PbSO4 -PbO2 -PbO2 -PbO2 -PbO2 . u. a / yti s n et nI 2 / degrees Electrochemical Chemical
Fig. 1 XRD patterns of PbO2powders prepared by electrochemical and
chemical routes
a
b
c
d
Fig. 2 Scanning electron micrographs of PbO2powders
prepared by a chemical route, b electrochemical route, and c, d corresponding micrographs at higher magnification
prepared by the electrochemical route seems to be highly talline with sharp and high intensity peaks. The average crys-tallite size was calculated from the full width at the half max-imum (FWHM) of [110] diffraction line using Scherrer equa-tion. The difference in crystallite size value (nm) thus calcu-lated for the different samples is reported in Table 1. The electrochemical sample yields a crystallite size (19 nm) almost four times that of the chemical PbO2(5 nm).
SEM examination of the microstructure of PbO
2samples
Figure2 presents SEM micrographs of PbO2particles and aggregates of PAMs prepared under different conditions. At high magnification, both chemical and electrochemical sam-ples comprise PbO2particles grouped in small agglomerates, which coalesce into an aggregate. The shape and size of PbO2 particles change from one sample to another depending on the conditions and methods of preparation. Smaller and closer interconnected PbO2particles in agglomerates with individual nanoparticles still distinguished are observed in the SEM ex-amination of the chemically prepared sample (see Fig.2c). Larger and clearly pronounced individual PbO2particles are obtained by the electrochemical route (see Fig.2d).
Based on the results of SEM data, it can be generally con-cluded that the synthesis of lead dioxide by electrochemical or chemical methods in aqueous solution follows a precipitation-crystallization mechanism.
Thermogravimetric analysis of PbO
2samples
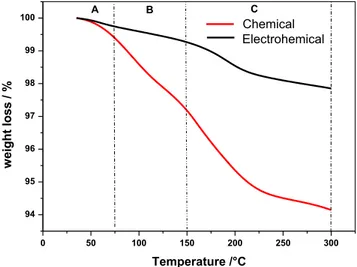
The thermal analyses were performed within the temperature range from 35 to 300 °C, as the aim of these analyses was to determine the hydrated parts of the samples. Figure3 illus-trates the measured weight losses respectively forβ-PbO2 samples prepared by chemical and electrochemical routes as
a function of heating temperature. Three temperature zones of weight loss, related to the dehydration of the amorphous parts of PAM, can be distinguished. A-zone: from 35 to 75 °C, in this temperature interval, the measured weight losses are due to evaporation of weakly bound (physisorbed) water. B-zone: from 75 to 150 °C, in this temperature interval, weight losses correspond to the release of H2O from the hydrated (gel) part of PAM particles and agglomerates. C-zone: from 150 to 300 °C, weight losses at these temperatures are due to evapo-ration of the water that is strongly bound (chemisorbed) to the lead dioxide particles. Table2gives weight losses for different temperature regions and total weight loss for the investigated samples. It seems that the chemical route facilitates the hydra-tion of the PAM and larger amounts of water are obtained for chemical β-PbO2compared to the electrochemical sample. For instance, the total water content in the chemically pre-pared sample is 5.84% and that of the sample prepre-pared by the electrochemical route is only 2.15%.
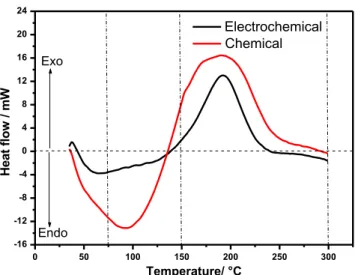
To better understand the difference in the activity between the two samples, additional data from thermal analyses were obtained. Figure4presents the measured heat flow as a func-tion of the temperature for chemical and electrochemical PAM samples. For both samples, this range of temperature corre-sponds to the evaporation of the surface adsorbed and for strongly bounded water within the gel zones of the PAM. It is clearly seen from the thermal profiles that the endothermic and exothermic processes depend on the conditions and the method of preparation of the samples.
The endothermic peak corresponds to the departure of the water molecules adsorbed at the surface of PbO2particles, where-as the exothermic peak is related to the dehydration of the amor-phous parts of PbO2. When heated, amorphous lead dioxide lat-tice is reordered under oxygen evolution and combined water. This exothermic reaction is associated with a reduction of Pb4+to Pb2+according to Eqs. (5) and (6), respectively:
OH−þ OH−→1=2O2þ H2Oþ 2e− ð5Þ
Pb4þþ 2e−→Pb2þ ð6Þ
The thermal profile for chemical PbO2is characterized with broad peaks corresponding with its high amorphous micro-structure and larger content of water in the sample. For elec-trochemical PbO2, representative thermal profile is character-ized with sharp peaks with low intensity related to its low amorphous structure and lower content of water.
0 50 100 150 200 250 300 94 95 96 97 98 99 100 ElectrohemicalChemical C B A % / s s ol t h gi e w Temperature /°C
Fig. 3 Weight losses of chemical and electrochemical PbO2
Table 2 Weight losses of PAM prepared by chemical and electrochemical routes
Weight loss (%) A-zone B-zone C-zone Total
Chemical 0.61 2.20 3.03 5.84
Electrochemical investigations
Galvanostatic dischargeThe discharge curves of chemical and electrochemical PbO2 are presented in Fig.5. We report the change in potential versus the capacity of the electrode expressed in mAh g−1. From the zoom insert in Fig. 5, we can see that chemical PbO2presents an open-circuit potential slightly higher (Ei = 0= 1025 mV) than that of PbO2prepared by electrochemical route (Ei = 0= 993 mV). Consequently, this yields to a poten-tial plateau that corresponds to the reduction of PbO2 to PbSO4slightly higher. This is due to the difference in the micromorphology and crystallite size of PbO2particles. It is commonly known that the capacity of lead dioxide depends on the water content, but although the chemical sample ex-hibits small crystallite size and amorphous character, we no-tice that the capacity of the electrochemical sample is much higher (70 mAh g−1) than that of the chemical sample (50 mAh g−1).
Cyclic voltammetry
In Fig.6, we report the evolution in current density versus the electrode potential after 100 cycles at a sweep rate of 50 mV s−1. From these voltammograms, it is clearly deduced that PbO2prepared by the electrochemical method presents higher cathodic and anodic current densities that correspond respectively to the reduction of PbO2to PbSO4during dis-charge and to the oxidation of PbSO4to PbO2during charge. The capacity versus the number of cycles for both samples is illustrated in Fig.7. We can see that the increase in capacity for PbO2prepared by the electrochemical process is more impor-tant compared to that of the sample chemically produced. The capacity values of the two samples determined for the 100th cycle are equal to 15.1 and 22.2 mAh g−1, respectively, for chemically prepared and electrochemically prepared PbO2.
Consequently, the electrochemical route seems to facilitate the production of positive active material with higher performance cycling. In contrast, the chemical method exhibits lower PAM cycling.
Electrochemical impedance spectroscopy
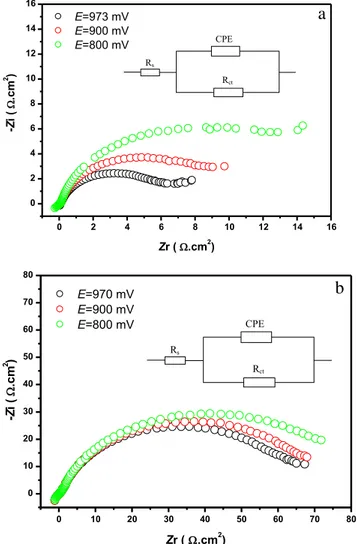
Typical Nyquist diagrams were obtained at open-circuit po-tential (OCP) and under cathodic polarization for both sam-ples prepared by chemical and electrochemical routes. The experimental plots and their corresponding equivalent electri-cal circuits are represented in Fig.8.
At open-circuit potential, one semicircle is observed at high frequency corresponding to charge transfer resistance and double-layer capacitance formation. Under cathodic polariza-tion, it can be observed that chemical PbO2electrode shows an important increase in the diameter of the semicircle and ca-pacitance value as compared to electrochemical PbO2 elec-trode (see Fig.8a, b).
0.4 0.6 0.8 1.0 1.2 1.4 1.6 -400 -200 0 200 400 600 800 Chemical Electrochemical V= 50 mV/s 100th cycle m c. A m / yti s n e d t n er r u C -2 Potential vs Hg/Hg2SO4 / V
Fig. 6 Cyclic voltammetry curves for the 100th cycle of chemical and electrochemical PbO2 0 50 100 150 200 250 300 -16 -12 -8 -4 0 4 8 12 16 20 24 Exo Endo W m / w olf t a e H Temperature/ °C Electrochemical Chemical
Fig. 4 DSC curves of chemical and electrochemical PbO2
0 10 20 30 40 50 60 70 80 -0.2 0.0 0.2 0.4 0.6 0.8 1.0 1.2 0 10 20 30 40 50 60 70 80 0.95 0.96 0.97 0.98 0.99 1.00 1.01 1.02 1.03 1.04 Electrochemical Chemical Potential vs Hg/Hg 2 SO 4 / V
Discharge capacity (mAh.g-1)
chemical Electrochemical g H/ g H s v l ait n et o P 2 SO 4 / V
Discharge capacity / mAh.g-1
The EIS data of the electrodes tested at different potentials fit the circuit equivalent Rs(Rct, Q), where Rsis the solution
resistance, Rctis the charge transfer resistance of the PbO2 electrode, and Q is the constant phase element (CPE). The corresponding simulated data are summarized in Table3.
The data present the variation of the charge transfer resis-tance with the cathodic polarization applied to both PAMs. It is clearly seen that chemical PbO2with small crystallite size and high water content presents small values of charge transfer resistance. Both samples show an increase of the charge trans-fer resistance with the increase of the value of the potential of polarization. This could be explained by the fact that under polarization amorphous particles, surfaces are partially con-verted to PbSO4leading to higher resistance.
The data of the increase of the charge transfer resistance (expressed in percentage (%) with respect to the initial value of the resistance measured at OCP) with the potential of polarization are reported in Table4. The data show clearly the remarkable effect of cathodic polarization on the activity and electrical prop-erties of the two samples. In fact and although chemical PbO2 particles are smaller and exhibit more amorphous character, i.e., high structural water content, as compared to electrochemical PbO2ones but during discharge, they yield low electrical con-ductivity and smaller value of capacity. This is in disagreement with the data published in our previous work [22]. In this paper, we showed that the mechanism of PbO2reduction could be expressed as a double-injection process of electron and proton according to the following equation:
<> þHþ þ e−→ < H > ð7Þ
where < > and <H> denote the free and hydrogen occupied sites, respectively.
We demonstrated also a good correlation between the ca-pacity of PAM and the content of structural water. When heating lead dioxide, the departure of water affects not only the capacity of PAM but also its electrical properties. This leads to a capacity loss and a decrease in the values of DH+ (proton diffusion coefficient).
0 2 4 6 8 10 12 14 16 0 2 4 6 8 10 12 14 16 CPE Rs Rct
a
E=973 mV E=900 mV E=800 mV -Z i ( .cm 2 ) Zr ( .cm2 ) 0 10 20 30 40 50 60 70 80 0 10 20 30 40 50 60 70 80 CPE Rs Rctb
-Z i ( .cm 2 ) Zr ( .cm2) E=970 mV E=900 mV E=800 mVFig. 8 Nyquist diagrams at open-circuit potential (OCP) and under cathodic polarization for PbO2 samples: a chemical and b
electrochemical. Inset equivalent electrical circuit
0 20 40 60 80 100 0.4 0.5 0.6 0.7 0.8 0.9 m c. h A m / yti c a p a c e gr a h c si D -2 Cycle number Electrochemical Chemical
Fig. 7 Cycling performance of investigatedβ-PbO2samples versus cycle
number
Table 3 Simulated data of the EIS parameters for chemical and electrochemical PbO2electrodes
Rs(Ω cm2) Rct(Ω cm2) Q (Ω−1cm2sn) n Chemical PbO2 E = 973 mV 0.10 06.48 0.083063 0.82 E = 900 mV 0.13 09.15 0.084747 0.86 E = 800 mV 0.12 15.27 0.081832 0.85 Electrochemical PbO2 E = 970 mV 0.71 65.93 0.0054814 0.81 E = 900 mV 0.44 72.03 0.0054519 0.80 E = 800 mV 0.64 79.45 0.0084016 0.81
From these findings, one can suggest that the electrochemical route based on a longtime process yields a PAM with a gel-crystal microstructure and a homogeneous and ordered repartition of the hydroxyl groups and/or water molecules. These facilitate the diffusion of the protons during discharge and charge of PAM and favorite the increase of the capacity of PbO2during cycling. In the contrary, the chemical method based on a short-time pro-cess leads to a PAM with an amorphous part in the crystal micro-structure and a heterogeneous and disordered distribution of the hydroxyl groups and/or water molecules. Obviously, chemical PbO2is less active than the electrochemical sample. To our knowledge, this is the key point that could explain the difference in electrochemical activity betweenβ-PbO2prepared by chemi-cal and electrochemichemi-cal route.
Conclusion
The experimental basis gained from this manuscript is the combining of thermal analysis with the different electrochem-ical techniques to try to explain the difference in electrelectrochem-ical performance for the two samples. The activity of lead dioxide in sulfuric acid depends not only on the quantity of structural water but also on the way these hydrogen species are arranged in the amorphous part of PbO2.
Electrochemical lead dioxide is more active in sulfuric acid than that prepared by chemical route. Thermal analysis and elec-trochemical impedance spectroscopy are the key techniques in-vestigated in this work to better understand this difference in activity between the two samples. More precisely, this activity may be probably due to the well and homogeneous repartition of the free hydrogen sites within the structure of electrochemical PbO2. These free hydrogen sites facilitate the diffusion of the proton and lead to PbO2with high capacity.
In contrast, the heterogeneous and randomly repartition of the free hydrogen sites within the structure of chemical PbO2 limits the diffusion of the proton and consequently gives a PAM with low capacity.
These findings explain why the chemical phase is less ac-tive and yields small capacity with cycling compared to PAM prepared by the conventional process.
References
1. Rüetschi P, Cahan BD (1957) Anodic corrosion and hydrogen and oxygen overvoltage on lead and lead antimony alloys. J Electrochem Soc 104(7):406–413.https://doi.org/10.1149/1. 2428614
2. Burbank J (1957) Anodization of lead and lead alloys in sulfuric acid. J Electrochem Soc 104(12):693–701.https://doi.org/10.1149/ 1.2428455
3. Rüetschi P (1963) Stability and reactivity of lead oxides. Electrochim Acta 8(5):333–342. https://doi.org/10.1016/0013-4686(63)80063-8
4. Bagshaw NE, Clarke RL, Halliwell B (1966) The preparation of lead dioxide for X-ray diffraction studies. J Appl Chem 16:180–184 5. Duisman JA, Giaugue WF (1968) Thermodynamics of the lead storage cell. The heat capacity and entropy of lead dioxide from 15 to 318.degree K. J Phys Chem 72(2):562–573.https://doi.org/ 10.1021/j100848a030
6. Caulder SM, Simon AC (1974) Thermal decomposition mecha-nism of formed and cycled lead dioxide electrodes and its relation-ship to capacity loss and battery failure. J Electrochem Soc 121: 1546–1551
7. Turner AD, Moseley PT, Hutchison JL (1984) Utilization of active material in PbO2electrodes. Proc Electrochem Soc 84-14:267–276
8. Taylor EJ, Shia GA, Peters DT (1984) A precharged positive plate for lead-acid automotive battery: I. Positive plate allowing direct incorporation of PbO2. J Electrochem Soc 131(3):483–487.https://
doi.org/10.1149/1.2115613
9. Taylor EJ, Shia GA, Peters DT (1984) A precharged positive plate for lead-acid automotive battery: II. Effects of various PbO2types and
paste formulations on precharged positive plate performance. J Electrochem Soc 131(3):487–491.https://doi.org/10.1149/1.2115614
10. Moseley PT, Bridger NJ (1984) Lead-acid battery cathodes incor-porating chemically prepared PbO2. J Electrochem Soc 131(3):
608–610.https://doi.org/10.1149/1.2115634
11. Hill RJ, Jessel AM (1987) The electrochemical activity of PbO2. A
nuclear magnetic resonance study of hydrogen in battery and chem-ically prepared material. J Electrochem Soc 134(6):1326–1330.
https://doi.org/10.1149/1.2100667
12. Tokunaga A, Tsubota M, Yonezu K, Ando K (1987) Effect of an-isotropic graphite on discharge performance of positive plates in pasted-type lead-acid batteries. J Electrochem Soc 134(3):525– 529.https://doi.org/10.1149/1.2100503
13. Rüetschi P (1992) Influence of crystal structure and interparticle contact on the capacity of PbO2electrodes. J Electrochem Soc
139(5):1347–1351.https://doi.org/10.1149/1.2069410
14. Pavlov D (1992) The lead-acid battery lead dioxide active mass: a gel-crystal system with proton and electron conductivity. J Electrochem Soc 139(11):3075–3080.https://doi.org/10.1149/1. 2069034
15. Pavlov D, Balkanov I, Halachev T, Rachev P (1989) Hydration and amorphization of active mass PbO2particles and their influence on
the electrical properties of the lead-acid battery positive plate. J Electrochem Soc 136(11):3189–3197.https://doi.org/10.1149/1. 2096424
16. Monahov B, Pavlov D (1993) Hydrated structures in the anodic layer formed on lead electrodes in H2SO4solution. J Appl
Electrochem 23:1244–1250
17. Fitas R, Chelali N, Zerroual L, Djellouli B (2000) Mechanism of the reduction ofα- and β-PbO2electrodes using an all-solid-state
sys-tem. Solid State Ionics 127(1–2):49–54.https://doi.org/10.1016/ S0167-2738(99)00266-0
18. Hill RJ, Houchin MR (1985) Incorporation of hydrogen in lead dioxide by a surface hydrolysis mechanism. Electrochim Acta 30(4):559–561.https://doi.org/10.1016/0013-4686(85)80047-5
Table 4 Variation of the increase in charge transfer resistance (%) with the change of the potential of polarization calculated from impedance values of PAM prepared by chemical and electrochemical routes Potential of polarization (mV) Increase in charge transfer resistance (%) chemical PbO2 Increase in charge transfer resistance (%) electrochemical PbO2 900 41.2 9.25 800 135.6 20.5
19. Fitas R, Zerroual L, Chelali N, Djellouli B (1996) Heat treatment of α- and β-battery lead dioxide and its relationship to capacity loss. J Power Sources 58(2):225–229. https://doi.org/10.1016/S0378-7753(96)02372-5
20. Fitas R, Zerroual L, Chelali N, Djellouli B (1997) Role of hydration water in the reduction process of PbO2in lead/acid cells. J Power
Sources 64(1-2):57–60.https://doi.org/10.1016/S0378-7753(96) 02502-5
21. Fitas R, Zerroual L, Chelali N, Djellouli B (2000) Thermal degra-dation ofα- and β-PbO2and its relationship to capacity loss. J
Power Sources 85(1):56–58. https://doi.org/10.1016/S0378-7753(99)00382-1
22. Zerroual L, Fitas R, Djellouli B, Chelali N (2006) Relationship between water departure and capacity loss ofαandβ-PbO2usinganall solid-state
system: estimation of proton diffusion coefficient. J Power Sources 158(2):837–840.https://doi.org/10.1016/j.jpowsour.2005.11.011
23. Morales J, Petkova G, Cruz M, Caballero A (2006) Synthesis and characterization of lead dioxide active material for lead-acid batte-ries. J Power Sources 158:831–836
24. Yang S, Li R, Cai X, Xue K, Yang B, Hu X, Dai C (2017) Influence of hydrated PbO2content on the cycling performance of lead-acid
batteries. J Electrochem Soc 164(9):A2007–A2011.https://doi.org/ 10.1149/2.1261709jes