O
pen
A
rchive
T
OULOUSE
A
rchive
O
uverte (
OATAO
)
OATAO is an open access repository that collects the work of Toulouse researchers and
makes it freely available over the web where possible.
This is an author-deposited version published in :
http://oatao.univ-toulouse.fr/
Eprints ID : 4897
To link to this article : DOI:10.1016/j.palaeo.2011.02.008
URL :
http://dx.doi.org/10.1016/j.palaeo.2011.02.008
To cite this version :
Develle, Anne-Lise and Gasse, Françoise and
Vidal, Laurence and Williamson, David and Demory, Froiçois and
Van Campo, Elise and Ghaleb, Bassam and Thouveny, Nicolas
A 250 ka sedimentary record from a small karstic lake in the
Northern Levant(Yammoûneh, Lebanon) Paleoclimatic implications.
(2011) Palaeogeography, Palaeoclimatology, Palaeoecology, vol.
305 (n° 1- 4). pp. 10-27. ISSN 0031-0182
Any correspondence concerning this service should be sent to the repository
administrator:
staff-oatao@listes-diff.inp-toulouse.fr
A 250 ka sedimentary record from a small karstic lake in the Northern Levant
(Yammoûneh, Lebanon)
Paleoclimatic implications
A.-L. Develle
a,⁎
, F. Gasse
a, L. Vidal
a, D. Williamson
b, F. Demory
a, E. Van Campo
c, B. Ghaleb
d, N. Thouveny
aaCEREGE. UMR 6635. Europôle de l'Arbois, BP80, 13545 Aix en Provence Cedex 4, France
bLaboratoire d'Océanographie et du Climat: Expérimentations et Approches Numériques. UMR 7159 CNRS/IRD, France cECOLAB, UMR 5245 (CNRS-Université de Toulouse-INPT), BP 24349, 31062 Toulouse Cedex 9, France
dGEOTOP, université du Québec à Montréal, Case postale 8888, succursale A, Montréal, Québec, Canada H3C 3P8
a b s t r a c t
Keywords: Lake Carbonates Sedimentology Paleomagnetism Eastern Mediterranean Glacial–interglacial variabilityThe Levant, influenced by both the Mediterranean Sea and the Saharan–Arabian deserts, is a key region for understanding climatic changes in response to glacial/interglacial boundary conditions that have greatly affected regional hydrology. Here, we present the first long-term paleoenvironmental record from the northern Levant, presently much wetter than the southern Levant. Our record derives from the multi-proxy study of a sediment core (36 m long) retrieved from the small intra-mountainous, tectonic basin of Yammoûneh (Lebanon), which is mainly supplied by karstic springs.
Sediments consist of a thick accumulation of brownish to greenish clayey silts, interrupted by intervals of whitish marls composed of CaCO3rich material. The core chronology is based on radiometric dating (
14
C and U/Th) and paleomagnetic techniques. The sedimentary sequence spans approximately the last two glacial–interglacial cycles (~250 ka). Carbonate content is relatively high throughout the profile due to a perennial input of detrital calcite from the watershed, but varies significantly. The marls are mostly composed of authigenic and biogenic calcite and reflect lacustrine environments with high carbonate productivity during peaks of interglacial periods. Their occurrence suggests low physical erosion of the basin slopes which were covered by arboreal vegetation, and intense karstic water circulation under warm and relatively wet conditions, in agreement with pollen data. The clayey silts are dominated by quartz and clay minerals, and a few amounts of K-feldspars and dolomite. They are characterized by high concentration in magnetic particles, and high relative concentrations of Si, Al, K and Fe considered as strictly of detrital origin. Due to the carbonated nature of the watershed, quartz and K-feldspars are attributed to eolian origin from a distal source. The clayey silt intervals generally suggest palustrine conditions with abrupt flows responsible for runoff-derived material, or subaerial environments and low local water availability in particular during the Last Glacial Maximum. High Si/Al and K/Al ratios, during interglacials, are attributed to relatively high eolian dust contribution due to the decrease of local detrital inputs.
Our study reveals significant differences between Yammoûneh and lake records from the Dead-Sea basin (southern Levant), the latter showing high/low levels during glacial/interglacial periods. These hydrological differences might reflect either changes in the North–South (NS) rainfall gradient in response to the development of the northern ice sheet and the southward migration of the westerly belt, or local factors, i.e., a decrease in efficient precipitation and water availability at Yammoûneh during the coldest glacial periods (e.g., the Last Glacial Maximum), due to water storage by ice caps on the Mount Lebanon range and frozen soils in the Yammoûneh basin.
1. Introduction
The Levant (Fig. 1) exhibits a large variety of landscapes resulting from (i) its climatic setting at the transition between the temperate Mediterranean domain and the subtropical desert belt, and (ii) its steep topographic gradients. The region experiences a Mediterranean
climate, with cool-wet winters and hot-dry summers. Winter rainfall comes from Atlantic-Mediterranean fronts steered eastward by the mid-latitude westerlies (Ziv et al., 2010) (Fig. 1a), but precipitation diminishes with latitude from north to south, and from west to east due to the orographic effect of the mountain ranges running parallel to the Eastern Mediterranean Sea coast and distance from the sea coast (Fig. 1b). Water resources are vulnerable and climate changes seriously impact human societies. The Levant has experienced a long history of cultural dynamics since the Paleolithic (Henry, 2003),
⁎ Corresponding author. Tel.: + 33 381 666 431.
which has often been associated with climatic changes (Bar-Yosef, 2003; Migowski et al., 2006; Staubwasser and Weiss, 2006; Vaks et al., 2007; Waldmann et al., 2010). Reconstructing past environmental conditions is essential for understanding the response of Eastern Mediterranean (EM) regions to global climatic changes and the varying environmental contexts where ancient human groups evolved. However, the variability of the terrestrial water cycle is not fully established in this region of sharp climatic gradients. In the southern Levant (Israel mainly), paleolake and speleothem studies have already provided well-dated, high resolution records spanning
several glacial/interglacial cycles, while no long-term paleoclimatic reconstruction is available from the northern Levant (Syria, Lebanon). Furthermore, interpretations of the records are sometimes difficult to reconcile. Lakes and paleolakes from the Dead Sea-Jordan Valley basin experienced generally high stands attributed to increased precipita-tion during glacial periods, and arid condiprecipita-tions during interglacials (Enzel et al., 2008; Waldmann et al., 2010). In the rain shadow of the Judean Mountains, speleothem growth tended to stop during interglacials indicating a P-E deficit (Vaks et al., 2003, 2006), as in the Dead Sea lakes. Nevertheless, interglacial periods were
Fig. 1.(a) Eastern Mediterranean map showing the localisation of the Northern Mediterranean sites cited in the text: Lake Ohrid (Albania,Lézine et al., 2010); Tenaghi Philippon basin (Greece;Tzedakis, 1993) and Lake Urmia (Iran;Djamali et al., 2008). Scheme of the major wind trajectories over Eastern Mediterranean. (http://iridl.ldeo.columbia.edu/
maproom;Alpert and Ziv, 1989; Saaroni et al., 1998): In blue: mid-latitude westerlies responsible for the winter precipitation. In Red: occasional wind storms coming from the
Sharav cyclone. In green: occasional wind called Sharqiya. (b) The Levant. Isohyetes showing the NS and EW precipitation gradients (CL: Cyprus Low). Location of Yammoûneh and Levantine sites of Late Pleistocene-Holocene paleoclimatic records cited in the text, and numbered 1 to 15: (1) Ghab valley (Wu et al., 2007), (2) Ammiq-Bekaa valley (Hajar et al., 2008), (3) Jeita cave (Nader et al., 2007;Verheyden et al., 2008); (4) Peqiin cave (Bar-Matthews et al., 2003); (5) Jerusalem west cave (Frumkin et al., 1999, 2000;Frumkin and Stein, 2004); (6) Soreq cave (Bar-Matthews et al., 1997,2003); (7) Ma'ale Dragnot, (8) Tsavoa and (9) Ma'ale Efrayim caves (Vaks et al., 2003, 2006, 2007, 2008); (10) Lakes of the Dead Sea basin (Waldmann et al., 2010); (11) ODP 967 (Emeis et al., 2003); (12) MD9501; (13) SL 112 (Hamann et al., 2008), (14) MD94-632 (Essallami et al., 2007) and (15) MD9509. Records derived from marine studies (in white), lake level reconstructions (in blue), speleothems (orange stars), pollen (yellow stars). Note that the area of paleolake Lisan (Dead Sea basin) shown here is that of its maximum extent (26–24 ka;Bartov et al., 2003).
punctuated by wet pulses, also recorded by travertines and spe-leothems in the Negev Desert, and attributed enhanced Atlantic-Mediterranean cyclones (Vaks, 2007; Vaks et al., 2008), or to intrusions of moisture from southern sources (Waldmann et al., 2010). In northern and central Israel, isotope records of speleothems located west and north west of the Dead Sea Basin have been interpreted as indicator of rainfall amount, suggesting wet/dry interglacial/glacial periods, e.g., at Soreq and Peqiin Caves ( Bar-Matthews et al., 1997, 2003), or as reflecting the isotopic composition of the moisture source (the EM basin) based on Jerusalem West Cave and Lake Lisan aragonite isotope records according toFrumkin et al. (1999)and Kolodny et al. (2005), respectively. The later interpreta-tions are in better agreement with the lake level fluctuainterpreta-tions in the Dead Sea Basin (DSB). Clearly more information is needed to assess a more robust picture of the hydrological variability in this region.
Here, attention is paid to late Quaternary terrestrial environmental and climatic changes in Lebanon on the glacial/interglacial time-scale. The present paper provides a new paleoenvironmental record from Lebanon spanning approximately the past 250 ka. This record partly fills the North–South disparity in spatial data coverage in the Levant region, and may help understand the spatial heterogeneity, if any, of the paleoclimatic patterns. Our record comes from a 36 m-long sediment core retrieved from a small, intra-mountainous lake basin (Yammoûneh). Although located at only 100 km from Mt Hermon (the head water area of the Jordan-Dead Sea basin), this lake strongly differs from those in the Dead Sea Basin by its very small size, its higher elevation and its rapid throughflow. We focus on sedimento-logical indicators with four main aims: (1) identify the major sedimentary changes from a multi-proxy approach including X-Ray Diffractometry, elemental X-Ray Fluorescence analyses and sediment magnetic properties; (2) establish the chronology of past environ-mental fluctuations (14C, U/Th dating, magnetostratigraphy); (3) examine the potential processes responsible for sedimentary changes and (4) discuss the impacts of site-specific factors versus those of regional and global climate changes through comparison with other long-term records from the region.
2. Modern setting
The Yammoûneh basin (34.06°N–34.09°N, 36.0°E–36.03°E), 1360 meters above sea level (m a.s.l.), 6 km long, 2 km wide, is located on the eastern flank of Mount Lebanon, approximately 37 km from the Mediterranean Sea shore. Since at least Roman times (Besançon, 1968), a shallow seasonal lake occupied the southern part of the basin (Fig. 2b). The lake was drained in the early 1930s following the construction of an underground duct designed to transport water for irrigation of the Bakka plain located eastward (Fig. 2a). Before this man-made drainage, the lake developed in March–April for a mean duration of 5 months and may have reached a depth of 2 m (dry years) to 10 m (wet years) (Besançon, 1968). The rather flat basin floor is today entirely cultivated.
2.1. Geology and geomorphology
The major structures of the Levant are related to the Levant Fault System (LFS;Le Pichon and Gaulier, 1988), which connects the NW tip of the Red Sea to the SW end of the East Anatolian Fault. South and north of Lebanon, the Levant Fault System activity have generated the large tectonic basins of the Dead Sea (Dead Sea-Jordan Valley-Lake Tiberias) and the Ghab Valley (Fig. 1b). The Lebanon structure is more complex since the Lebanese section of the Levant Fault is divided into several branches and veers to the right, forming a restraining bend responsible for the high reliefs of Mount Lebanon (Daëron et al., 2007). The main geomorphic features of Lebanon run roughly parallel to the Mediterranean coastline (SSW–NNE) and consist of a narrow
coastal plain, the Mount Lebanon range with its peak at 3083 m a.s.l, the Bakka plain (ca. 900 m a.s.l.) and the Anti-Lebanon mountains (2000 m a.s.l).
The Yammoûneh basin is a small tectonic (pull-apart) depression along the Yammoûneh Fault, one of the major branches of the LFS (Fig. 2b). Its long axis strikes SSW–NNE. The basin is inset between thick subtabular sequences of intensively karstified Cenomanian dolomitic limestones (Dubertret, 1975; Hakim, 1985). West of Yammoûneh, the karstic Jabal Mnaïtra plateau abruptly rises to 2100 m a.s.l (Fig. 2a). To the East, the Yammoûneh plain is separated from the Bakka (Fig. 2a) by gently sloping hills (Jabal el-Qalaa, 1500 m a.s.l.; Fig. 2b). In its southern part, patches of whitish lacustrine deposits indicate the ancient lake area, while reddish coarse material in the north represents the alluvial deposits of the small Aïnata river flowing from the eastern flank of Mt Lebanon. Using the Rivertools (Peckham, 2003) and SWAT2005 (Arnold et al., 1998) softwares, the area of the basin's surface watershed was estimated from digital elevation models at 103–109 km2(Fig. 2b). Lithological
formations outcropping in the watershed are Cenomanian limestones and red fersiallitic soils described as typical across Lebanon (Lamouroux, 1972). The alluvial fans that border the western border of the basin are composed of a mixture of these red soils, detrital carbonates particles derived from the bedrock and calcareous concretions.
2.2. Climate
Winter rainfall in the Levant is controlled by the Mediterranean Sea and the dynamics of the mid-latitude cyclones that developed over the Sea during winter (Sharon and Kutiel, 1986; Gat et al., 2003; Ziv et al., 2010). Cold air masses arrive from the Atlantic and northern Europe and tend to propagate eastward. These air masses travel over the relatively warm Mediterranean and become saturated by moisture. The dynamics of the Mediterranean cyclones imply the intersection of the northwesterly–westerly flows (Fig. 1a) with the EM shoreline and, later on, with the mountain ridges and result in intensive rainfall over the Levant (Ziv et al., 2006). Rainfall spatial and temporal variability is related to the activity and position of the Cyprus Lows generally located south of Turkey (Fig. 1). In summer, when the westerly belt is shifted to the north and the EM sea level pressure is reinforced, the region experiences hot and dry conditions. On the southernmost Levant, only, exceptional rainfall events occur in fall and spring in the southern Levant and are most commonly linked to a stronger Red Sea Low (Kahana et al., 2002; Ziv et al., 2005).
Precipitation and temperature vary considerably in relation to topography and distance from the sea. In Lebanon, mean annual precipitation (MAP) ranges between 700 and 1000 mm along the coast to N1400 mm in Mount Lebanon; it decreases to 400 mm in the Bakka plain. Above 2000 m a.s.l., precipitation is essentially niveous (Service Météorologique du Liban, 1973; Abi-Saleh and Safi, 1988; Karam, 2002). At Yammoûneh, the rainfall regime resembles that of the western flank of Mount Lebanon (MAP: 900–1000 mm/year, as snow falls over about 30 days/year), but continentality is marked by large diurnal and seasonal variations in temperature and air humidity. While mean annual temperature is about 15 °C, means of temperature minima of the coldest month and of temperature maxima during the warmest month are −4.2 °C and 34.6 °C, respectively. Freezing occurs over 3 months/year. Relative air humidity varies between about 70% in winter and 45% in summer. The wet-cold season takes place from November to March and the dry-warm season lasts 5 months (May– October).
Most wind storms over the Levant occur in winter and follow the dominant direction of the westerlies (Fig. 1a). Occasionally, more local winds influence the region. The Sharav cyclone, typical of the spring season, originates over Libya and Egypt and moves eastward along the North African coast (Winstanley, 1972; Alpert and Ziv, 1989). When approaching Sinaï, it sometimes turns to the north, following the
direction of the EM coastline (Fig. 1a). Winds resulting from this cyclonic activity, commonly called Sirocco or Khamsin, sometime cause warm and dry conditions associated to heavy sand and dust storms in the region (Alpert and Ziv, 1989; Stanley and Wingerath, 1996; Saaroni et al., 1998; Goudie and Middleton, 2001).Saaroni et al. (1998)also described strong easterly winds, called Sharqiya, which develop during winter and early springs over the Near East and bring dust storms from Arabia to the Levantine area (Fig. 1a), and sometimes converge with the Sharav winds. Winds crossing Lebanon are consistent with these general circulation trends, although during winter cold northerly winds may exert a greater influence than southward winds.
2.3. Hydrological setting of the Yammoûneh basin
Besides direct precipitation (b1.2.106m3/year), the Yammoûneh
basin largely depends on precipitation over the western highlands. The Jabal Mnaïtra plateau is incised by gullies that terminate with alluvial fans nearly to the basin floor. The surface network captures rainfall and snowmelt water from the Jabal Mnaïtra heights and redirects it into the basin through runoff. Water inputs from the eastern slopes are relatively small as most of the wadis formed from the Jabal el-Qalaa are drained toward the Bakka plain. The most important water inflow to Yammoûneh comes from perennial karstic springs (35–70.106m3/year;Besançon, 1968; Hakim, 1985). Beneath
the Jabal Mnaïtra plateau, subterranean karstic networks collect snowmelt-water feeding a dozen springs along the western edge of the basin. Studies of nearby aquifers show that water residence time in such systems (1 season to 2–3 years ;Aouad et al., 2004; El-Hakim, 2005). The spring discharge, reaching its maximum over late spring and early summer, delivers relatively cold (average temperature: 7 °C), calcium-rich, circumneutral freshwater all year round (Hakim, 1985). Following the smooth slope of the basin, sinuous channels drain the spring and runoff water into karstic sinkholes along the opposite eastern border. The karstified, intensively fissured and faulted basin floor is highly permeable. Leakage through the lake bottom has always reduced the lake water residence time, water
depth and salt content. Despite the absence of surface outlet, the basin is hydrologically open with rapid throughflow.
3. Material and methods 3.1. Material
This paper concerns the upper 36 m of one of the sediment cores (YAM04C′, 73 m; sediment recovery: ~80%) collected in 2004 from the central part of the Yammoûneh paleolake (Fig. 2b). The coring was performed using a SEDIDRILL drilling machine equipped with Mazier and cable corers. This coring came after detailed geoelectric investigations (A. Sursock and R. Jomma, pers. comm., 2004) and neotectonic studies of the Yammoûneh Fault (Daëron et al., 2004, 2007; Daëron, 2005), for which two trenches (Fig. 2b) were dug throughout the fault in 2001 (TR01, 5 m-deep, 75 m-long) and 2002 (TR02, 9 m-deep, 50 m-long) and were14C-dated (Daëron et al., 2007, and pers. comm). These trenches were stratigraphically correlated with the upper part of the core (Develle et al., 2010) and are only considered here for stratigraphical control.
A simplified stratigraphic log of the upper 36 m of YAM04C′ is presented inFig. 3. A more detailed description is given in Appendix A. Based on macro- and miscroscopic (smear slides) observations, the profile can be schematically divided in 10 major lithological units, noted I to X (Fig. 3).
Four units (Units I, IV, VI and IX), each a few meters thick, consist of light lacustrine carbonate having a powdery or sandy texture and rich in remains of aquatic calcareous organisms. We found diversified species of ostracods (Ilyocypris inermis, Ilyocypris gibba, Candona neglecta or Fabaeformiscandona balatonica…), gastropods (Gyraulus sp., Valvata aff. piscinalis, Succineidae…) and bivalves (Pisidium sp.), fish otoliths below 33 m, and algal remains (charophyte gyrogonites and calcified stems, Phacotus sp., loricae). All encountered biogenic taxa are typical of freshwater, shallow environments. These whitish units show a gradual transition at the base and passes abruptly to greenish silty clays at the top.
Fig. 2.(a) Main structure and surface watershed of the Yammoûneh basin estimated from a Digital Elevation Model using Rivertools (red) and SWAT2005 (black) softwares. Stars indicate the positions of the soils (black stars) and bedrocks (blue stars) analyzed in this study). (b) The Yammoûneh depression and approximate paleolake area (in white) with location of the sedimentary profiles TR01 and TR02 (trenches) and YAM04C′ (piston core). The black dashed line is the surface trace of the Yammoûneh Fault; black arrows show the direction of lateral movement along the fault (modified fromDaëron, 2005). YF: Yammoûneh fault.
Between these carbonate-rich units, darker clayey silts predom-inate. Units III, V, VII and VIII consist of finely banded olive gray or brownish gray clayey silts, almost devoid of aquatic faunal and algal remains, besides ostracods sometimes abundant but poorly diversi-fied (Ilyocypris spp.). Layers rich in plant debris are frequent and generally form very dark millimetric beds interbedded in coloured silty clays. Some thicker dark bands (a few cm thick) show a lumpy texture and evoke paleosoils. Millemetric dark-light laminae occur occasionally. Limestones gravels and calcareous or ferruginous concretions are often organized in beds. Unit X is a peaty marl rich in fish rests and suggesting an accumulation of hydrophytes fragments in a productive marl. Unit II contrasts from others by its
reddish brown to ocher colour. This unit shows numerous strongly oxidized and indurated beds which suggest desiccation phases, and coarse limestone gravels.
U-channel sections collected along the entire core were used for paleomagnetic and X-Ray Fluorescence (XRF) scanner measurements at a resolution of 1 cm. Discrete samples were taken for other sedimentological analyses at variable intervals (from 2 to 15 cm) according to the main lithological features. In the watershed, 3 bedrocks and 4 soil samples (Fig. 2a) were collected for the characterization of the runoff-derived detrital fraction that has contributed to the lake sedimentation. Analyses were performed at CEREGE, otherwise it is specified in the text.
Fig. 3.Simplified stratigraphical log of YAM04C′. The gaps between sections are due to coring problems (lost of sediments at the base of core sections, or no sediment recovery). Rectangles: levels with radiocarbon (red) and U/Th (blue) ages. See lithofacies details in Appendix A.
3.2. Major components of core sediments 3.2.1. Mineral composition
X-Ray Diffractometry (XRD) analyses were performed on core sediments (160 samples) and on watershed samples for a semi-quantitative estimate of the major mineral phases. Samples were dried and crushed in an agate mortar. The powder was sprinkled with a 100 μm sieve on circular silicium slides of 3 cm in diameter, in order to obtain a deposit of about 0.5 mm of thickness. Note that, in our analyses of bulk sediments, the relative proportions of clay minerals may be underestimated when mixed with well-crystallized grains, e.g., quartz or calcite.
The mineral composition of the clay fraction was analyzed for 8 levels from different stratigraphical core units (at 66, 400, 782, 963, 1506, 1761, 2634 and 3246 cm). Bulk samples were disaggregated by means of a 5–10% H2O2solution. Carbonate was removed by 10% HCl.
The suspensions were mounted as texturally oriented aggregates and solvated with ethylene–glycol vapor at a temperature of 50 °C.
All XRD analyses were performed on a Philips PW 1729 X-Ray diffractometer with a cobalt tube at 40 mA–40 kV.
Measurements of carbonate and organic matter contents were conducted on the same core sample set as for XRD (160 samples). Carbonate concentrations were obtained using a «Dietrich-Frühling» calcimeter. The method is based on the measurement of the CO2
volume released during the reaction of the sediment with acid. The total carbonate content is calculated taking into account pressure, temperature, the sample weight, and the volume of released CO2.
Contents in total organic matter (TOM) were estimated by loss on ignition (Dean, 1974) (weight lost of dry sediment by heating 2 h at 550 °C).
3.2.2. Element composition
The relative contents of major elements were measured by X-Ray Fluorescence (XRF) analyses. Measurements were performed every 1 cm on the core U-channels, using a XRF Avaatech core scanner (University of Bordeaux I, EPOC Laboratory). X-Ray beam was generated with a rhodium anode and a 125 μm beryllium window which allow voltage range of 7 to 50 kV and a current range 0 to 2 mA. The analytical settings were adjusted at 10 kV–400 μA in order to detect Ca, Si, Ti, Al, K, Mn and Fe. Each individual power spectrum was transformed by deconvolution process into relative contents (intensities) expressed in counts per seconds (cps). Element ratios (Si/Al, K/Al) could be used as indicators of the particle source and transport and weathering intensity (Zabel et al., 2001; Croudace et al., 2006).
3.2.3. Principal component analysis
Principal component analysis (PCA) was performed on the two sets of variables resulting from XRD and XRF analyses, using the R statistical software package (Ihaka and Gentleman, 1996; version 2.7.2). The goal was to reduce the number of observed variables to a smaller number of factors, providing insight into the structure of the variance of the parameters and to identify which set of variables form coherent subsets that are relatively independent of each another. Variables that are correlated with one another and which are largely independent of other subsets of variables are combined into factors. Factors were then related to the underlying sedimentary processes recorded in the sediments.
3.2.4. Sedimentary magnetism and paleomagnetism
Magnetic properties were used to trace surface erosion processes in the watershed (Thompson et al., 1980; Thompson and Oldfield., 1986). The low field magnetic susceptibility κLF, was measured on
U-channels at 2 cm interval on the MS2C loop sensor connected to the Bartington susceptibility meter MS2. The natural, anhysteretic and isothermal remanent magnetizations (NRM, ARM, and IRM, respec-tively) were measured on a pass-through superconducting rock
magnetometer (2G model 760R) and demagnetized in alternating fields (AF) up to 60 mT using the on-line degaussing coil system. The ARM was imparted after nearly complete demagnetization of the NRM, by applying a 80 mT AF and a 50 μT steady field along the z axis of U-channels (ARM80
0.05) and then stepwise AF demagnetized up to
60 mT. The IRM was imparted by passing U-channels through permanent magnets (Halbach cylinders) developing a 1 T transverse field (Rochette et al., 2001).
The low field susceptibility κLF, is primarily determined by the
concentration of ferromagnetic (s.l.) minerals, but secondarily influenced by paramagnetic minerals (weak positive κLF) and by
diamagnetic minerals (weak negative κLF). The ARM800.05is mainly
carried by ferromagnetic (s.l.) minerals of low coercivity (e.g. the magnetite — Ti-magnetite series). The IRM1Tincludes contributions of
higher coercivity minerals (hematite, goethite and iron sulfides). For a given concentration of ferrimagnetic minerals, all three parameters are grain size dependent: κLFand IRM are generally increasing with
increasing grain size, while ARM is decreasing with increasing grain size.
Paleomagnetic tests were first performed on carbonate-rich and clayey-silty samples. Stepwise AF demagnetization diagrams exhibit remarkably stable direction up to 60 mT (demagnetization diagrams; Appendix B). The median destructive field (MDF) of the NRM ranges from 12 to 30 mT; and the 40 mT AF step leaves 15 to 40% of the initial NRM (Appendix B). The 35 mT demagnetization step was therefore selected to reconstruct profiles of inclination variations (declination profiles are hampered by coring artefacts). Intensities of the ARM35mT
and IRM1Twere taken as appropriate normalizers of the NRM35mTin
order to reconstruct profiles of the relative paleointensity of the geomagnetic field, RPI (Johnson et al., 1975; Lund and Banerjee, 1979; Tauxe, 1993).
In order to trace sedimentary fabric disturbances, the anisotropy of the magnetic susceptibility (AMS) was measured on standard paleomagnetic cubic specimens extracted from layers characterized by anomalous NRM inclination, using a Kappabridge MFK1 magnetic susceptibility meter (AGICO). The orientation of the AMS ellipsoid, characterized by 3 orthogonal axes Kmin, Kint. and Kmax, follows the statistical orientation of shape anisotropic magnetic grains and therefore characterizes the sedimentary fabric (Stacey et al., 1960; Hrouda, 1982; Martin-Hernandez et al., 2004). Namely, an oblate ellipsoid with a Kmin axis vertical (90°) is typical for compacted sedimentary fabric. Significant deviations of this axis reflect sedimen-tary disturbances (e.g. slumps, sampling disturbances) potentially associated with anomalous paleomagnetic directions.
3.2.5. Additional analyses on discrete samples
In addition to routine smear slides observations along the whole sequence, selected carbonate-rich (66, 1048, 1770, and 3264 cm) and silty-clayey samples (750 and 815 cm) were observed in detail using a Nikon 50i polarizing optical microscope and a Hitachi S3000 Scanning Electron Microscope (SEM).
Grain size analysis was performed on core sediments from depth intervals covering transitions between stratigraphical units, and sampled every 15 cm between 45 and 200 cm (Unit II/I), 870–1020 cm (Unit IV/III), 1700–1900 cm (Unit VI/V) and 3060–3340 cm (Unit IX/VIII). Measurements were first performed on total sediment, then on samples decarbonated with 10% HCl. We used a Malvern Mastersizer S laser diffractometer and three successive measurements were systematically performed for each sample. The Malvern software provides a size spectrum ranging from 0.06 μm to 878.67 μm. The stable isotopic composition of carbonates from the watershed and core sediment samples was measured in order to differentiate two end-members, detrital carbonates (derived from clastic inputs), and authigenic carbonates (precipitated in the lake), through their respective isotopic signatures. Analyses were performed on 7 samples from the watershed (soils and bedrock;Fig. 2a) representative of the
detrital end-member, and on 4 calcite-dominated core samples (taken at 66, 1767, 3264 and 3406 cm). For core samples, measurements were conducted on both bulk material and different size fractions (b25 μm, 25–63 μm and 63–150 μm), and on the best preserved in situ ostracod valves taken from the fraction N150 μm. Ostracod values were corrected for vital effect (Develle et al., 2010) to obtain values coeval of authigenic calcite precipitated at equilibrium in the lake water (authigenic end-member). The determination of the carbonate δ18O and δ13C values was performed on CO2 resulting from the reaction of the carbonate with H3PO4 acid at 70 °C, with a Finnigan Delta
Advantage mass spectrometer. Analytical precision of δ18O and δ13C is ±0.04‰ and ±0.02‰, respectively, based on repeated analyses of a NBS-19 limestone standard (−2.2‰ and +1.95‰ for δ18
O and δ13 C, respectively).
3.2.6. Age assessment
The chronology of the upper 535 cm of the core was established by 14
C dating. Below this depth, the U/Th disequilibrium dating method was attempt on bulk samples or size fractions of core sediments containing ≥ 80% of calcite. In addition to radiometric dating, paleomagnetism has been used to provide additional control on the age model.
4. Results
4.1. Sedimentological analyses
We first consider the results from the bedrock and soil samples collected in the watershed for understanding the contribution of local detrital inputs (including carbonates) to the paleolake sedimentation. We then characterized the typical carbonate-rich and siliciclastic intervals observed in the sediment core.
4.1.1. Bedrock and soils from the Yammoûneh watershed
The local bedrock mainly consists of calcite. The mineral assemblages of soil samples are mainly composed of three major mineral phases: calcite, quartz and clay minerals (mainly smectite and kaolinite) in varying proportions. For exemple, YamSol3 and Aïnata samples contain 50% of calcite, 30% of quartz and 20% of clay minerals (hereafter, all percentages are given as dry sediment weight %); YamSol2 shows a lower calcite content (7%) and higher percentages of quartz (~60%) and clay minerals (~33%). In soil samples, microscopic observations show calcite grains occurring mostly as aggregates, and eroded round and matt quartz grains (b20–50 μm) associated with iron oxides filling surface dissolution cavities.
4.1.2. Core sediments
Major sedimentological results on core YAM04-C′ are illustrated in Figs. 4 to 8. Calcimetry and XRD (Fig. 4), and XRF intensities (Fig. 5) show that the carbonate fraction is important all along the sequence, mainly represented by calcite. All variables show significant variations within individual stratigraphical units and gradual transitions between some of them (especially from Units VII to VI and Units III–II to I). Nevertheless, carbonates clearly predominate in Units I, IV, VI and IX, whereas siliciclastic components prevail in clayey-silty Units II, III, VII and VIII.
As expected in a karstic basin with rapid throughflow, sediment components throughout the sequence indicate freshwater conditions in the Yammoûneh waterbody. This agrees with biological remains which also reflect shallow or even sub-aquatic biotopes.
4.1.3. Main characteristics of the carbonate component
In carbonate-rich Units I, IV, VI and IX, calcite represents more than 70% of the sediment and up to 85–100% in Units I, VI and IX (Fig. 4). The very low aragonite contents in layers rich in mollusc shells or fish otoliths suggest recrystallization of this unstable mineral in calcite. TOM content reaches its minimum values (2–5%;Fig. 4). Magnetic
susceptibility is low and/or negative and low ARM intensities (b0.5 · 10−1A·m−1, Fig. 5) confirm the weak concentration of ferromagnetic particles probably due to the strong dilution by carbonates. Grain size analysis of bulk sediments shows a multi-modal particle distribution dominated by sand-size particles (not shown). SEM observations reveal abundant romboedric calcite crystals (authigenic) up to 30 μm long (Plate Ia). The coarser particles include calcitic rests of aquatic organisms and algal precipitation (Plate Ib, c), but also carbonate aggregates (Plate Ie) which might have derived from the bedrock erosion or soil reworking. Stable isotope measure-ments performed on 4 core samples (bulk and different size fractions) retrieved in carbonate intervals (Units I, VI, and IX) show δ18
O values of ca −9 to −11‰ and δ13C values ranging from −2 to −6‰. When plotted on a δ18O versus δ13C diagram (Fig. 6), these values are significantly lower than isotope values of the watershed samples indicator of the detrital carbonate end-member, and close to those of ostracod valves retrieved from the same samples (once corrected from the vital effect), regarded as representative of the authigenic calcite end-member. These results suggest that carbonated units mainly consist of authigenic calcite, but a minor contribution of detrital calcite and of recrystallized aragonite cannot be excluded.
0 6 8 4 2 14 12 10 16 20 22 18 30 28 26 24 36 34 32 Calcite Dolomite Quartz Clays Mineral phase (%) I II III IV V VI VII VIII IX X Carbonates (%) 0 5 10 15 20 Organic matter (%) Depth (m) Others Chronological markers (ka BP) 1.5±0.1 19.6±0.2 47±3 124±17 0 20 40 60 80 100 0 20 40 60 80 100
Fig. 4. Major components of the Yammoûneh core sediments: carbonate content (calcimétrie), organic matter contents (loss on ignition) and major mineral phases (XRD analysis). Rectangles indicate stratigraphical position of14
C (red) and U/Th (blue) ages.
Relatively high carbonate contents (7–55%) are also present in the silty-clayey units (as defined inSection 3.1) and mainly consist of calcite in the form of rounded aggregates or limestone gravels. In these units, calcite romboedric crystals and biogenic calcified remains
are rare, although some levels are relatively rich in calcite and in ostracod valves.
4.1.4. Main characteristics of the clayey-silty components
XRF relative abundances of Si, Al, K and Fe roughly mirror Ca-intensities and reach their maximum values (Fig. 5) in stratigraphical Units II, III, V and VIII. These units are characterized by high contents of quartz associated with silicate minerals in lower amounts, and mixed with carbonates. Quartz contents vary around 30% and reach 60% in Unit III (Fig. 4). Quartz grains are round and matt, with a size of 20 μm in average but may reach 50 μm, and closely resemble those from the watershed samples (altered, partly dissolved and intimely mixed with iron oxides;Plate If). Angular K-feldspars and plagioclases crystals have approximately the same size but are better preserved (Plate Id). TOM content is N5% and peaks at 15% in the peaty marls at the Units IX–X transition (Fig. 4). The clay fraction is composed of smectite (60–70%), kaolinite (25–30%) and a few percents of illite. Low amounts of dolomite occur by times. Downcore variations in magnetic particles concentra-tions, recorded by the magnetic susceptibility (κLF) and ARM (Fig. 5), run
parallel to those of siliciclastic elements and minerals. High κLFand ARM
values are associated with high amount of ferrimagnetic particles. The high amplitude of proxy variations between carbonated and clayey-silty layers is partly due to dilution by contribution of carbonates. Nevertheless, other processes, like changes in mineralogy assemblage linked to a change in detrital sources and/or early diagenesis processes
Fig. 5.Down-core sedimentological variations based on: concentration in magnetic particles (κLF, ARM), major element intensities and element ratios (Si/Al, representing quartz
versus other silico-clastic minerals, and K/Al, indicator of catchment weathering or of wind-blown K-rich minerals.
-6 -5 -4 -3 -2 -1 0 1 2 -12 -11 -10 -9 -8 -7 -6 -5 watershed 66cm 3406cm 3264cm 1767cm YAM04C' sediment fractions Authigenic calcite Ostracod values δ13C (‰ vs PDB) Vital effect δ 18 O (‰ vs PDB)
Fig. 6.Isotopic composition (δ18
O, δ13
C) of bedrock and soil samples collected in the watershed (blue symbols), and of carbonate-rich lacustrine deposits from YAM04C′ (black, gray and white symbols). δ18
O values of authigenic calcite are estimated from the δ18
O of ostracod valves corrected from the vital effect.
may be also responsible for these variations. Interestingly, the element ratios Si/Al and K/Al (Fig. 5) reveal peaks occurring within the carbonate-rich units suggesting that the reduced detrital fraction in these intervals is mainly composed of quartz and K-feldspars (Fig. 5). Whatever the unit, grain size analysis of decarbonated samples show a well sorted silt-size peak with one mode centred at 15 μm.
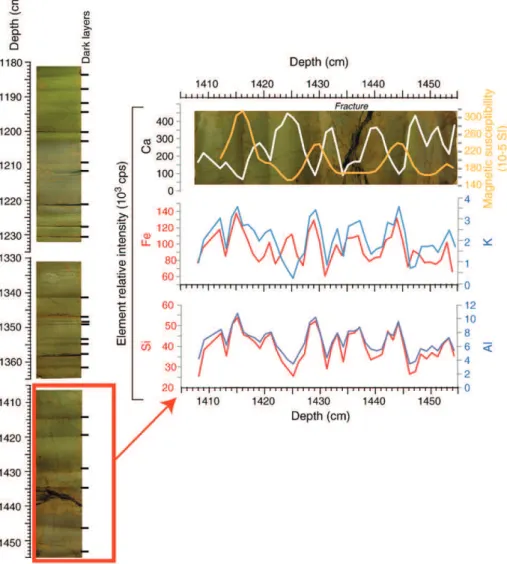
The clay-silt units are far from being homogeneous. High frequency variability in sedimentary conditions is particularly clear in the occurrence of finely banded greenish intervals. As an example, Fig. 7illustrates the fluctuations of κLFand element intensities (Ca, Si,
Al, K and Fe) in the interval 1100–1650 cm (Unit V), in agreement with subtle changes in colour, grain size and content in plant debris which decrease from the base to the top of individual bands. However, the discussion will be focused on long-term changes in the sedimentary components.
4.1.5. PCA-results
Main sedimentary features of these two types of sediments are synthesized using PCAs. The sampling resolution differs depending on the analysis. We thus performed individual PCAs for XRD and XRF (hereafter noted PCAXRDand PCAXRF;Fig. 8), and then compared their
outputs. Only factors having Eigen-values N1 or just below 1 are considered. Factors 1 and 2 are noted F1 and F2. In PCAXRD, two factors
explain 62% of the total variance. F1XRD (37% of the total variance) is dominated by high contribution of quartz and moderate loadings of feldspars, clays and dolomite (Fig. 8b). These components are
negatively correlated to calcite and aragonite. F2XRD (25% of total variance) is positively correlated with clays. In PCAXRF, F1XRF(78% of
total variance) is mainly explained by the high positive loading of calcium which is negatively correlated to all other elements (Fig. 8b). The first component projections of these PCAs (Fig. 8) highlight the antiphasing between calcite and aragonite which are partly authi-genic, and typical detrital components derived by runoff from the watershed or wind-transported to the lake (quartz, clays, feldspars, dolomite, Si, Ti, Al, K, and Fe).
4.2. Chronological framework
The ages proposed subsequently are related to Marine Isotope Stages (MIS) as defined byMartinson et al. (1987).
4.2.1. Radiometric dating
The chronology of the upper 535 cm of the core was established by 14
C dating of partially carbonized wood fragments, relatively abundant in the trenches but rare in the core. The age model for the last 21,000 years (ca 250 cm in the core YAM04C′) has already been established using 12 calibrated14
C ages from the 2 trenches (Daëron et al., 2007, and pers. comm.) and from the core. The core-trench stratigraphic correlation was based on remarkable lithofacies, magnetic susceptibility, oxygen isotope records and 14C dates
(Develle et al., 2010). An additional14C age was obtained at 535 cm in the core.
Ti
−1.0 −0.5 0.0 0.5 1.0 F1 F2Al
Si
K
Ca
Mn
Fe
Relative elemental contents (XRF)
−1.0 −0.5 0.0 0.5 1.0 −1.0 −0.5 0.0 0.5 1.0 −1.0 −0.5 0.0 0.5 1.0 F1
F2 Calcite DolomiteQuartz
Clays
Feldspars Aragonite
Major mineral phases (XRD)
-1 -0.5 0 0.5 1 Al Si K Ca Ti Mn Fe Factor 1 Factor 2 Factor 1 Factor 2
(a)
(b)
Variable contribution -1 -0.5 0 0.5 1 Variable contribution Quartz Calcite Dolomite Aragonite Clays FeldsparsFig. 8.Principal Component Analyses (PCAs) of major sedimentological data. (a) PCA F1/F2 projection of variables scores in PCA-XRD, PCA-XRF. (b) Contribution of the variables and their association with the factors F1 (white) and F2 (black).
Plate I.SEM pictures of the major particles and minerals identified in the YAM04C′ core. (a). romboedric calcite grains,
(b). ostracod rests, (c). algal precipitations, (d). K-feldspars, (e). calcite aggregates and (f). quartz grain.
According to available14
C dates, Unit I represents the Holocene period (MIS 1), truncated in the core at about 6 ka likely due to plowing; Unit II includes the lateglacial, the Last Glacial Maximum (LGM), and possibly part of MIS 3. The14
C age of 47±3 ka (535 cm) also places the top of Unit 3 in MIS 3. This age should be regarded with caution as it reaches the limit of the radiocarbon dating method applicability.
Below 535 cm, an attempt was made to apply the U/Th disequilibrium dating method. U-series analyses were performed on bulk samples or size fractions of core sediments containing ≥80% of calcite. Most samples appear unsuitable for U/Th dating for mainly three reasons: (i) a too high contamination by detrital fraction, highlighted by high232
Th values (Table 1) and also detrital carbonate from the drainage basin; (ii) multiple sources of detrital carbonate supplies (e.g., watershed and wind-blown particles of unknown origin); (iii) the system did not remain closed. Only one level (1770 cm; Unit VI; calcite content close to 100%) has provided apparently acceptable results from TIMS measurements and yields an uncorrected age of 139.6 ± 13.4 ka (Table 1). However, the measured 230
Th/232
Th ratio (5.8 ± 0.3) indicates that this initial age is too old and should be corrected for the contribution of a detrital fraction by using the detrital230Th/232Th ratio, which is unknown at Yammoûneh. One way to estimate the detrital fraction is to use the isochron methods. Using an Holocene sample dated at 5.5 ka in the trench TR02, this tentative failed (U/Th age 12 ka older than the14C age) likely due to a mixture of carbonate detrital particles from several sources. Another way is the analysis of pure detrital material. Analyses (α-counting) of two carbonate-poor layers of the core (1696 and 4100 cm, dominated by clay and plant debris) suggest a detrital 230
Th/232
Th ratio ranging between 0.8 and 1.9 (not shown), consistent with the values most commonly found in the literature. Taking theoretical detrital230Th/232Th ratios of 0.63, 1, 1.3 and 1.7 for correction (Kaufman, 1993and references therein), re-calculated ages (mean: 124±17 ka) fall within the last interglacial maximum, the MIS 5–5 (Eemian) whatever the ratio used (Table 1and Appendix C). Despite large uncertainties, stratigraphical Unit VI, which closely resembles the Holocene, can be assigned to MIS 5–5. 4.2.2. Magnetostratigraphy
Along the sequence, normal inclination values of the NRM35mTin
YAM04C′ samples oscillate between 40° and 60° (Fig. 9a), in conformity with the record of a paleomagnetic secular variation, as reconstructed from other late Pleistocene sequences studied in northern mid-latitude sites. The average inclination (51°) is consis-tent with the inclination of the field vector generated at the site latitude (34°N) by a geocentric axial dipole.
Variations of the relative paleointensity (RPI) of the geomagnetic field were reconstructed using the NRM35mT/ARM35mTand NRM35mT/IRM1T
ratios profiles (Fig. 9b and c). These are essentially similar, although the NRM35mT/ARM35mTratio exhibits two unexplained spikes in the upper
parts of intervals VII and VIII. InFig. 9d, the PISO 1500 stack based on marine cores (Channell et al., 2009) and the regional RPI-stack from the Portuguese margin (Thouveny et al., 2004) are plotted as global and regional reference records.
Below the14
C-dated section of the core, four depth intervals (noted 1 to 4) present low or negative inclination values. Three of these anomalies correspond to low RPI values documenting events of low dipole field. These intervals (Fig. 9) can thus be interpreted as records of geomagnetic excursions. This allows us some chronological anchor points to be proposed along the 36 m sequence.
Interval 1 (340–370 cm, clayey silt Unit II) is marked by a RPI low and inclination deviation of ~40°, centred at 365 cm. It likely coincides with the Laschamp event, dated at 40.4 ± 1.1 ka by 40Ar/39Ar dating at the “Puy de Laschamp”(Guillou et al., 2004). An age of ~41 ± 1 ka is attributed to Interval 1, in relatively good consistency with the bracketing14C ages. Interval 2 (1590–1660 cm, clayey silty, Unit V) is characterized by a sharp negative inclination peak at 1610 cm. The same signal was also recorded in core YAM04C (not shown) collected few meters apart YAM04C′. This large deviation is attributed to the Blake geomagnetic event recorded at 115–120 ka BP in the PISO and Portuguese margin stacks. This event was dated between 114 and 120 in Chinese loesses (Fang et al., 1997). We adopt an age range of 114–120 ka for Interval 2, in stratigraphical agreement with the Eemian age obtained from U/Th dating for the underlying Unit VI.
The excursional behaviour of the paleomagnetic signal in the Yammoûneh section corresponding to the Blake event is remarkable. To confirm this signal and to rule out possible sedimentary disturbances, we measured the anisotropy of magnetic susceptibility (Appendix B). The magnetic fabric is characterized by a short axis Kmin of the magnetic ellipsoid close to vertical (90°) imaging a non-deformed sedimentary fabric confirming the validity of this signal.
Below 1800 cm, the geomagnetic signals are less clear partly due to gaps in the core sediment recovery. The RPI and inclination deviations centred at ~2735 cm (Interval 3; clayey silt Unit VIII) may reflect the Iceland Basin event placed at 190–194 ka in marine records (Thouveny et al., 2004; Channell et al., 2009) and well identified in continental sites (e.g., Lake Baikal,Oda et al., 2002; Demory et al., 2005b). The negative inclination deviation around 3460 cm may coincide either with the Pringle Falls excursion (~211 ka;Herrero-Bervera et al., 1994; Channell et al., 2009) or with the Mamaku excursion, dated at 230± 12 ka in lava flows of New Zealand (Shane et al., 1994). We consider the entire time interval 211–240 ka between these two excursions and attribute a mean age of 230 ka at Interval 4. Nevertheless, this part of the sequence suffers from (i) the lack of chronological constraints below 3460 cm and (ii) many gaps between sections. This part of the sequence has thus to be considered with caution.
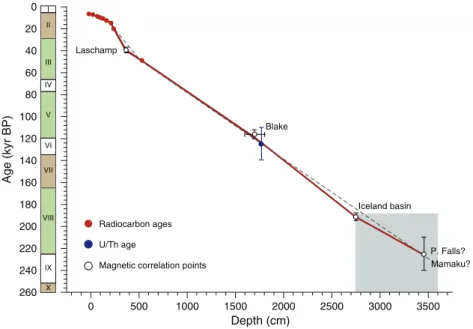
4.2.3. Age model
Taking into account the 1314C ages from the upper 535 cm, the U/Th date around 124±17 ka at 1770 cm, and the four age control points based on paleomagnetic events (41 ka at ~365 cm; 114–120 ka around 1635 cm; ~190 ka at 2735 cm; ~230 ka at 3460 cm), the 36 m sequence of the YAM04C′ core spans approximately 250 ka. We are not able at that stage to constrain changes in sedimentation rates between the few dated points, except an increase between Units II (ocher clayey silt) and I (powdery carbonate) in the upper 3 m. Furthermore, sedimentation hiatuses may have occurred, as identified during the early stages of
Table 1
Uranium and thorium concentration measured in the Yammoûneh sample at 1770 cm. Uncorrected and corrected ages based on230Th/232Th ratios the most commonly used in the literature (Kaufman, 1993). 238 U (ppb) 232 Th (ppb) 234 U/238 U 230 Th/234 U 23 Th/232 Th Detrital 230 Th/232 Th (*)
Age uncorrected Age corrected
(ka BP) (ka BP) 411.74 ± 2.31 279.52 ± 3.32 1.66 ± 0.01 0.77 ± 0.03 5.8 ± 0.2 0 139 ± 13.4 0.63 131.6 ± 12.3 1 126.5 ± 11.7 1.3 122.2 ± 11.2 1.7 116.1 v 10.5 Sample age 124 ± 17
Termination I (Develle et al., 2010). Therefore, linear interpolations between dated points (Fig. 10), which themselves suffer significant chronological uncertainties, only provide an approximate timing of observed changes. Nevertheless, stratigraphical units I (early Holocene) and V can be assigned with confidence to interglacial stages MIS 1 and MIS 5.5, respectively. Assuming that the penultimate interglacial maximum is also recorded by carbonate-rich sediments (as Units I and VI) and that the mean sedimentation rate between the oldest 14
C-dated level and the sequence base remains almost constant, Unit IX might represent MIS 7 (7–3 or 7–5?).
5. Discussion
5.1. Carbonate sedimentation during interglacial maximum
Units I, VI and IX, assigned to the interglacial periods MIS 1, MIS 5.5 and MIS 7, respectively, show a high proportion of calcite precipitated within the waterbody, in the form of romboedric calcite crystals and shells of aquatic organisms.
Inorganic calcite precipitation in freshwater bodies is favoured by: (i) photosynthesis activity of algae and aquatic macrophytes that consumes CO2 and increases the water pH; (ii) increase in water
temperature; (iii) water saturation with calcium (Bathurst, 1975;
Kelts and Hsü, 1978; Kelts and Talbot, 1990). Strong correlations between calcite precipitation, water temperature and primary productivity were demonstrated for example in Lake La Cruz (Spain; Romero et al., 2006). Open-water precipitation of calcite is common in hard water lakes which often undergo «whiting events» during summer months (Effler, 1987; Mullins, 1998). In karstic systems, springs represent a major source of Ca2+ ions derived from the
dissolution of bedrock limestones that interact with meteoric water. This process is enhanced if water percolates through well-developed soils. Intense biological activity in soils (respiration and microbial activity) results in an excess of soil acidity, a pH decrease of percolating water and thus a more effective limestone dissolution. Carbonate preservation in lakes is positively related to water oxygenation (Dean, 1999). Water in shallow lakes is most commonly well-mixed and well oxygenated by wind-induced turbulence, while CaCO3precipitated in the epilimnion of deep stratified lakes is often
dissolved in the hypolimnion where anoxic conditions cause the decomposition of organic matter and a reduction in water pH.
Favourable conditions for authigenic and biogenic carbonate production and preservation were clearly reached at Yammoûneh during interglacial maxima (Fig. 11a). A good oxygenation through the water column is attested by the rich aquatic biocenose including a benthic fauna and the whitish colour of the sediments. Algal and fish
RPI's Portuguese Margin Inclination (°) 0 0.5 1 1.5 2 2.5 PISO-1500 0 2 4 6 8 10 12 NRM35mT/ARM35mT NRM35mT/IRM1T Age (kyr BP)
Yammoûneh record
(a)
(b)
(c)
1 2 3 4Laschamp
Blake
Iceland basin
P. Falls?
Mamaku?
(d)
0 50 100 150 200 250 -50 0 50 0 1 2 3 0 0.001 0.002 0.003 0 50 100 150 200 I II III IV V VI VII VIII IX X 90 Chronological markers 1.5±0.1 19.6±0.2 47±3 124±17 250Fig. 9.Downcore variations in the magnetic parameters used for magnetostratigraphy along the 36 upper meters of the YAM04C′ core. (a) Inclination. (b and c) RPIs (NRM normalized to ARM and IRM). (c) Comparison with the global stack PISO 1500 variations (Channell et al., 2009), and the Portuguese margin RPI record (Thouveny et al., 2004). Pink areas indicate correlations between magnetic events recorded at Yammoûneh (1–4) and dated global excursions. Rectangles indicate stratigraphical position of14
C (red) and U/Th (blue) ages.
rests suggest high productivity, despite low content in TOM possibly diluted by carbonates and/or oxidized through well ventilated condi-tions. High carbonate production implies high Ca2+ availability,
suggesting an important discharge of karstic springs and an active water circulation in the Mnaïtra aquifer, and thus significant precipi-tation in its recharge zone (Fig. 12a). The low amount of clastic material indicates that detrital inputs from the watershed were either diluted by the lake carbonate production, or considerably reduced. Influx of siliciclastic material from the watershed might be minimized by a dense vegetation cover around the lake, or by local rains too low to drain particles from the basin slopes. Pollen data, illustrated here by the percentage ratio of arboreal versus non-arboreal pollen grains, AP/NAP (Fig. 11b) show that the development of arboreal taxa around the lake culminated in phase with maximum carbonate concentration. Catch-ment erosion was thus limited by the vegetation cover, and related soil development favoured the limestone dissolution in the surface and underground network (Fig. 12a). The tree growth was certainly favoured by the warm interglacial conditions, but also implies relatively high available moisture. We thus favour the hypothesis of wet conditions in both the aquifer recharge zone and in the Yammoûneh basin during interglacial periods.
We note that some of the Si/Al and K/Al ratios peak in the carbonate-rich units, especially around 128 ka. The Si/Al ratio (Fig. 11c) can be considered as a tracer of wind-blown quartz grains. High K/Al ratios may reflect weathering in the watershed, but the positive correlations between: (i) quartz and K-feldspars percentages in XRD analyses and (ii) K/Al and Si/Al ratios (despite small shifts between maximum values), rather indicate eolian influxes of K-rich minerals. The potential sources of windblown quartz and feldspar grains, much more abundant in silty clayey sediments, are discussed below. Their relative high abundance during periods of reduced soil erosion in the watershed suggests direct falls of eolian dust on the waterbody surface, in contrast with intervening periods.
By analogy with interglacial optimum (MIS 1, 5–5 and 7–3? or 7–5?), the carbonate-rich Unit IV is assumed to represent MIS 5–1, despite its higher detrital content (Fig. 4). If this is correct, the top of Unit IV would be a few k-years older than as suggested by our linear age interpolation. Slight increases in Ca content, K/Al, Si/Al and AP/NAP ratios around 15 m (~100–110 ka; Unit V) likely reflect MIS 5–3. We thus assume that the whole interglacial MIS 5 is represented by Units VI, V and IV (ca.
1865–950 cm). The finely banded clayey sediments of Unit V (Figs. 3 and 7) suggest repetitive surges of water loaded with detrital particles induced by rainfall events, and interrupted by wetter periods with enhanced tree growth and in situ carbonate production. The base of Unit VIII, which is relatively rich in calcite, might fit MIS 7–1.
5.2. Sedimentation during glacial periods: Watershed versus eolian inputs The clear relationships between the mineral composition of the watershed soils and that of core sediments indicate that most of the siliciclastic elements are eroded from the surface catchment area and transported by runoff, although authigenic calcite (and possibly neogenic phyllosilicates) and local organic production may contribute to sedimentation by times.
Detrital calcite, dolomite and clay minerals may easily derive from the catchment bedrock weathering and erosion. Conversely, quartz, the dominant siliciclastic mineral, K-feldspars and plagioclases, absent from the basin bedrock, are obviously wind-blown from a remote source. The high quartz contents reflect the significant contribution of wind borne particles to glacial age sediments, by reworking of eolian dust from the basin soils and direct fall on the lake surface. Quartz likely comes from desertic areas from surrounding countries and the large Saharan–Arabian deserts. Saharan dust inputs to the Levantine basin (core ODP 667: Larrasoana et al., 2005; core SL112:Hamann et al., 2008) and in a speleothem from Jerusalem West Cave (Frumkin and Stein, 2004) have been related to the monsoon-modulated climate in the northern Sahara controlled by the precessional forcing. At Yammoûneh, quartz grains are generally too coarse to have been transported from such a distal source (Tsoar and Pye, 1987). Taking into account the quartz grain size and dominant synoptic systems bearing eolian dust (Cyprus low and to a lesser extent Sharav cyclone and Red Sea trough;Dayan et al., 2008), two potential sources can be proposed: (1) the late Pleistocene loess of the Negev desert (~300 km southward) dominated by quartz grains 50–60 μm large, themselves derived from Sinai-Western Negev sand dunes (Crouvi et al., 2008), and sorted through eolian abrasion and transport to Yammoûneh; (2) the exposed Mediterranean shelf when the global sea-level was approx. 100–120 m below the current sea level, exposing the shallow shelf off the northern Sinai coast during glacial stages (Enzel et al., 2008,). K-feldspars and plagioclases may
0 500 1000 1500 2000 2500 3000 3500 260 240 220 200 180 160 140 120 100 80 60 40 20 0 Age (kyr BP) Depth (cm) Radiocarbon ages U/Th age
Magnetic correlation points Laschamp Blake Iceland basin P. Falls? Mamaku? I II III IV V VI VII VIII IX X
Fig. 10.Age versus depth diagram proposed for the upper 36 m of core YAM04C′. Black dashed line: preliminary age model based on14
C ages and U/Th dating. Red line: age model based on14
C ages, U/Th dating and magnetic events identified in the sequence. The gray area represents the part of the sequence which suffers from chronological uncertainties and has to be considered with caution.
have the same origin, but their good preservation suggests a more proximal source (i.e., Mesozoic and Cenozoic basalts outcropping in central and northern Lebanon, respectively) (Abdel-Rahman, 2002; Abdel-Rahman and Nassar, 2004).
In Units VIII, VII (MIS 6) and III (MIS 4 and early MIS 3), accumulations of greenish-brownish clayey silts imply local weath-ering and runoff, and thus rains or melt-water surges in the basin. Although the AP/NAP ratio is lower than during the interglacial optimum, relatively developed arboreal vegetation and abundant plant debris indicate some vegetation growth on the surrounding slopes or the basin floor. Efficient moisture may be enhanced by low evaporation rate under glacial thermal conditions. However, local water availability was too low to allow the development of a diversified aquatic biocenose. The single ostracod specie (Ilyocypris inermis) well survives ephemeral waterbodies. Several layers suggest-ing paleosoils and indicate unstable water balance.
Around 2450 cm (Unit VIII; ~170 ka) and 750–780 cm (Unit III; ~55–63 ka), Si/Al and K/Al peaks coincide with marked shifts in magnetic susceptibility (κLF) and minor increases in Ca values. In
contrast to the peak at 128 ka, the overall rise in Si/Al ratios in upper Unit III and in the reddish-ocher, oxidized Unit II (from about 50 to
13 ka), which run parallel to an increase in detrital carbonate including gravels, undoubtedly occurred during a period of increasing local water deficit. Indeed, both lithofacies (Fig. 3) and decreasing AP/NAP pollen ratio which reaches its minimum values in Unit II between ~35 and 13 ka (corresponding to MIS2), suggest steppe-like vegetation on the watershed (Figs. 11b and 12b) and indicate that end of the last glacial period and Termination 1 coincide with one of the driest episode observed in the whole record. During this period, the Si/Al and the carbonate increases are attributed to intensification of wind-storm frequency or strength and of physical erosion rate in the watershed almost devoid of vegetation.
The local water deficit, documented during MIS2, may be due to a decrease in precipitation but the influence of local factors, such as topography and altitude, should also be considered. At present, freezing occurs three months a year at Yammoûneh. The number of freezing months was likely higher during glacial periods, when the altitudinal temperature lapse rate was enhanced in the Mediterranean regions (Kuhlemann et al., 2008). In the karstic Lake Ohrid (Albania), where the pollen record indicates wet/dry interglacials/glacial periods, respectively (Lézine et al., 2010), Belmecheri et al. (2009) have proposed that the formation of permafrost during glacials has
Fig. 11.Downcore variations of some proxies from Yammoûneh as a function of age: (a) carbonate contents and Ca intensities, (b) AP/NAP ratio and (c) Si/Al ratio. Comparison with some a few key paleoclimatic records from the Levant over the last 250 ka. (d) Soreq and Peqiin cave isotopic records and (e) lakes of the Dead Sea Basin (seeFig. 1for references), (f) seasonal insolation parameters at 34°N and (g) age of sapropel events in Eastern Mediterranean (Emeis et al., 2003) and Marine Isotopic Stages according to SPECMAP (Imbrie et al., 1984).
prevented water infiltration into the kastic network, inducing the interruption of carbonate production. Such a process may have acted at Yammoûneh during cold periods with a temperature departure (relative to modern) of −6 to −10 °C (Develle et al., 2010). The past existence of glaciers in Lebanon has for long remained questionable (Dubertret, 1975; Daëron, 2005). It seems now demonstrated by the study of moraine deposits (currently under36
Cl dating) on the western slopes of Mount Lebanon (L. Benedetti, pers. comm.). Storage of snow-precipitation in the Mount Lebanon range as ice in permanent glaciers and frozen soils may have significantly decreased the liquid water inflows to the Yammoûneh basin (Fig. 12b), water storage by ice does not mean necessarily that precipitation was considerably reduced. As for the interglacial periods, our interpretation of the glacial phases requires further analyses.
5.3. Comparison with some records from the Near East
Large uncertainties on core YAM04C′ age model, especially prior to MIS 5, preclude detailed correlations with other records. Nevertheless, some comparisons can be made for dominant environmental conditions during the last interglacial optimum and full glacial conditions.
Assuming that our interpretations are correct, the Yammoûneh sedimentary record indicates high water availability in the Yammoûneh basin during interglacial optimum when the northern ice sheets and sea ice extent were reduced during periods of maximum insolation in the Northern Hemisphere and of maximum seasonal contrasts (Fig. 11). Phases of silt-clay accumulation suggest drier conditions, especially during MIS 2 and late MIS 3, although water availability was sufficient during MIS 6 and early MIS 4 to drain detrital particles from the watershed toward the basin floor.
For the early Holocene period, our interpretation is supported by other records from Lebanon. An early-mid Holocene wetting was evidenced in Lebanese low altitude areas from pollen data from the Bakka Plain (Hajar et al., 2008) and the 12 ka-speleothem δ18
O and δ13 C records from Jeita Cave, close to Beirut (Nader et al., 2007,Verheyden et al., 2008) (Fig. 1b). Such a wetting was also inferred from the pollen record from the Ghab Valley (Yasuda et al., 2000). This contrasts with the Dead Sea which remained very low (compared to glacial periods) during the Holocene (e.g.,Enzel et al., 2003;Migowski et al., 2006).
On longer time scales, our findings appear in line with the 200 ka pollen record from Lake Urmia (Iran; Djamali et al., 2008) which shows wet-warm conditions during MIS 5 and MIS 1. Our record would be roughly in agreement with the Soreq and Peqiin cave