HAL Id: hal-01611089
https://hal.archives-ouvertes.fr/hal-01611089
Submitted on 7 Nov 2018
HAL is a multi-disciplinary open access
archive for the deposit and dissemination of
sci-entific research documents, whether they are
pub-lished or not. The documents may come from
teaching and research institutions in France or
abroad, or from public or private research centers.
L’archive ouverte pluridisciplinaire HAL, est
destinée au dépôt et à la diffusion de documents
scientifiques de niveau recherche, publiés ou non,
émanant des établissements d’enseignement et de
recherche français ou étrangers, des laboratoires
publics ou privés.
Characterisation of the surface damage of X38CrMoV5
(AISI H11) tool steel at room temperature and 600
degrees C
M. Shah, Catherine Mabru, Farhad Rezai-Aria
To cite this version:
M. Shah, Catherine Mabru, Farhad Rezai-Aria. Characterisation of the surface damage of X38CrMoV5
(AISI H11) tool steel at room temperature and 600 degrees C. Fatigue & Fracture of Engineering
Materials & Structures, Wiley-Blackwell, 2015, 38 (6), p. 742-754. �10.1111/ffe.12280�. �hal-01611089�
Characterisation of the surface damage of X38CrMoV5 (AISI H11) tool
steel at room temperature and 600°C
M. SHAH1,3, C. MABRU2and F. REZAÏ-ARIA1
1Université de Toulouse, INSA, UPS, Mines Albi, ISAE; ICA (Institut Clément Ader), Route de Tiellet, Campus Jarlard, Albi, France,2Université de
Toulouse, INSA, UPS, EMAC, ISAE; ICA (Institut Clément Ader), 10 Av. Edouard Belin, Toulouse Cedex 4, France,3Mechanical Engineering
Department, University of Engineering and Technology, Taxila, Pakistan
A B S T R A C T A novel approach is used to characterise the surface damage of AISI H11 hot work tool steel. The fatigue crack growth rate (FCGR) experiments on thin specimens, considered representative of the surface of tool steels, are carried out. Single edge notched tension specimens of 8 mm width and different thicknesses are used in the study. Initially, the ef-fect of thickness (scale) on the FCGR is investigated to establish if there exists a differ-ence between bulk and near surface properties of the tool steel. Then, the effect of R value on the thin specimens is investigated. All the experiments are carried out at room temperature and 600 °C. These temperatures represent the limits of use of this steel. Paris curves are established. Effect of R ratio on the threshold value of propagation at el-evated temperatures is investigated in detail. A special ascending ΔK experiment for es-tablishing the threshold of propagation at elevated temperatures in small specimens is proposed, and the results are presented. The increase in R ratio increases the FCGR at low temperature, while it has no effect at 600 °C. A reduction in thickness shows a reduc-tion in the FCGR. Increase in temperature increases the FCGR and dramatically in-creases the threshold of crack propagation. The sharp increase in threshold value is studied in detail. Scanning electron microscopy of the specimens is performed to explain some of the characteristics observed in the specimen testing.
Keywords fatigue crack growth rate; high temperature fatigue; J-integral; R ratio; surface damage; threshold.
N O M E N C L A T U R E a = crack length (mm)
C = Paris’ law constant: intercept
da/dN = fatigue crack propagation rate (m/cycle) e = specimen thickness (mm)
E = Young’s modulus (GPa)
E′ = Young’s modulus in plane strain (GPa) f(a/W) = correction factor for KI
g(a/W) = correction factor forqffiffiffiffiffiffiffiffiffiffiffiffiffiJel;plE’ J = contour integral ( J/m2)
Jel = elastic contour integral ( J/m2)
Jel,pl = elastic-plastic contour integral ( J/m2)
ffiffiffiffiffiffiffiffiffiffiffiffiffi Jel;plE’ q
= elastic-plastic crack driving force parameter (MPa.m1/2)
KI = mode I stress intensity factor (MPa.m1/2)
m = Paris’ law constant: Slope
R = fatigue load ratio = (minimum stress / maximum stress) R0.2 = yield stress for 0.2% plasticity (MPa)
Rm = maximum tensile strength (MPa)
SEM = Scanning electron microscopy θ = temperature °C
ν = Poisson’s ratio W = specimen width (mm)
I N T R O D U C T I O N
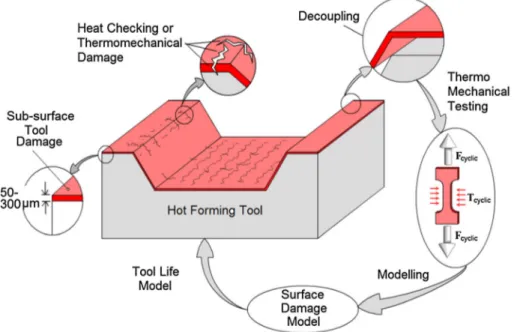
The surface of hot forming tools undergoes severe thermo-mechanical loading as well as corrosion and oxidation due to its exposure to the environment. The damage of tool steels is principally in a thin layer of material near the surface,1,2 up to a depth of between
50 and 300 μm. Oxidation and thermal fatigue effects on the surface are studied in Ref. [3]. Different methods of fatigue/damage characterisation of thin specimens and layers can be found in the literature. The authors in Ref. [4–8] have studied thin films. The techniques used by these researchers, changes the microstructure completely as compared with the bulk material. Characterisation in this case consists of micro-scale and nanomicro-scale damage. Tensile tests are carried out at room temperature on laser surface hardened H13 steels. Small specimens are machined from the bulk material containing only the modified layer up to 500 μm thickness.9 The effect of different coatings on
the thermal fatigue behaviour is studied extensively in Ref. [10–12]. Aluminium immersion experiments with Energy Dispersive Spectroscopy (EDS) measurements around the crack were performed in Ref. [13]. Other methods are based on tribological characterisation of the
surfaces. In most of these, studies the surface microstruc-ture is modified or is attached to the bulk material. In this study, an approach was proposed to machine a thin specimen near the surface of the material and perform fatigue crack growth rate (FCGR) experiments on this thin specimen (Fig. 1). It is considered that this thickness scale represents the scale of surface cracks in tools and dies.1,2,14The machining of thin specimens ensures that
the microstructure of the bulk and thin specimen is the same, as is in the case of surface of tool steels. These ex-perimental results are then compared to draw conclusions on the FCG behaviour of specimens with low thickness. In this study, the effect of R value on different thicknesses is explored. All the experiments are carried out at room temperature and at 600 °C.
Most of the work on fatigue at elevated temperatures is carried out on nickel-based or cobalt-based super alloys. Mechanism-based fatigue life model in in-phase and out-of-phase thermo-mechanical fatigue tests have recently been proposed by R. L. Amaro et al.15for the
single crystal Ni-based super alloys taking into account the anisotropy of the alloy. The fracture behaviour of notched Powder Metallurgy (PM) super alloys under Low Cycle Fatigue (LCF) at 550–700 °C has been stud-ied.16Effect of notch tip plasticity is also discussed, which
reduces the fatigue crack growth rate near the notch. Similar work was perfomed at higher temperatures of 850 °C.17 Non-local invariant method has been
deter-mined to be very effective in collapsing the different TMF data produced as a result of different notch sever-ities and load amplitudes at 900 °C.18Strain energy
den-sity has been used to characterise the cycles to failure in the high cycle regime of a 40CrMoV13.9 steel from room temperature up to 650 °C.19 A comprehensive
treatment of the recent developments of the brittle and quasi-brittle materials tested at high temperature fatigue has been recently published.20
Threshold values of FCGR at 600 °C are found to be excessive. Constraint effects of the starter notch may play an important role in this as well as the effects of thickness of the fracture toughness transferability as discussed in Refs. [21–23]. This paper does not deal with the con-straint effects due to the dimensions of the notch and the specimen. Effect of high threshold values at elevated temperatures is studied in detail in this paper. Threshold value is studied at different thickness, mean stress as well as different R values of 0.1, 0.5 and 0.7. Usually a descending ΔK strategy is used to determine threshold Stress Intensity Factor (SIF) value. In this procedure, an initial pre-cracking is done on a notched specimen. Due to this pre-cracking, a plastic zone ahead of crack tip is created. Once the crack length reaches a specific length, the load is reduced (usually by 20%). Crack propagation experiment is continued until the crack length exceeds the plastic zone generated during pre-cracking. This strategy of reduction in load and subsequent propagation is continued until the desired load and crack propagation speed (threshold range) is attained. The experiment is then continued at a constant load until fracture. The pro-cedure adopted earlier is necessary to obtain valid FCGR data of metallic materials. However, this procedure requires that the specimens have enough width so that after the reduction in load and propagation there is enough ma-terial left for the FCGR experiment. In small specimens, this is not always possible because of the small width.
A procedure of ascending ΔK is used coupled with a stepwise increase in temperature to clearly demonstrate the increase in threshold values at higher temperatures is described in this research.
This work presents an important database of the FCGR of H11 tool steel, which is currently unavail-able in the literature at ambient and at elevated temperatures.
M A T E R I A L A N D S P E C I M E N P R E P A R A T I O N
Experiments are carried out on a hot work martensitic tool steel X38CrMoV5 (AISI H11) delivered free of charge by Aubert & Duval in the form of forged bars of 60 mm square section. It is a low Si and low non-metallic particle content, 5% Chrome steel principally used in HPDC industry. The steel is quenched and double-tempered to a hardness of 47 HRC and R0.2of about
1200 MPa at room temperature. The chemical composi-tion by weight % and the tensile properties at different temperatures are given in Table 1.
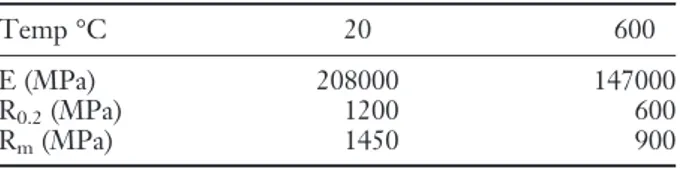
Material properties like E, Rmand R0.2change with
temperature. The evolution of these tensile properties is shown in Table 2.
All single edge notched tension (SENT) specimens are machined by wire cut electro erosion on an Agiecut 100D wire cut machine (GF Machining Solutions, Schaffhausen, Switzerland) as in Fig. 2a. The flat surfaces of the specimens are then ground parallel to the loading axis on an LIP 515 surface grinder. In the last stage, the specimens are polished on a metallographic polisher Buehler® PHEONIX 4000 (Buehler, Dusseldorf, Germany), to obtain the final thickness with a mirror finish using a 1 μm grit diamond paste. A grid of 0.10 × 0.10 mm is engraved on some of the specimens as in Fig. 2b.
Crack propagation experiments were carried out on a servo hydraulic universal testing machine Walter+Bai LFV 40 (Walter+Bai, Löhningen, Switzerland). Speci-mens were heated to 600 ° C using an induction heating system, HÜTTINGER Electronik Axio 5 kW (TRUMPF Hüttinger GmbH + Co. KG, Freiburg, Germany), and temperature was controlled by several thermocouples. Propagation was optically observed in situ with a Questar® travelling microscope (1.2 μm resolution) (Questar, New Hope, PA, USA) without interruptions. Three different thicknesses (2.5 mm, 1 mm and 0.4 mm) were tested to eval-uate the effects of specimen thickness on the crack propaga-tion behaviour at 600 °C.
Table 1 Chemical composition of tested steel (%weight)
Elements C Cr Mn V Ni Mo Si Fe
% Mass 0.36 5.06 0.36 0.49 0.06 1.25 0.35 balance Table 2 Mechanical properties at different temperatures
Temp °C 20 600
E (MPa) 208000 147000
R0.2(MPa) 1200 600
E X P E R I M E N T A T I O N
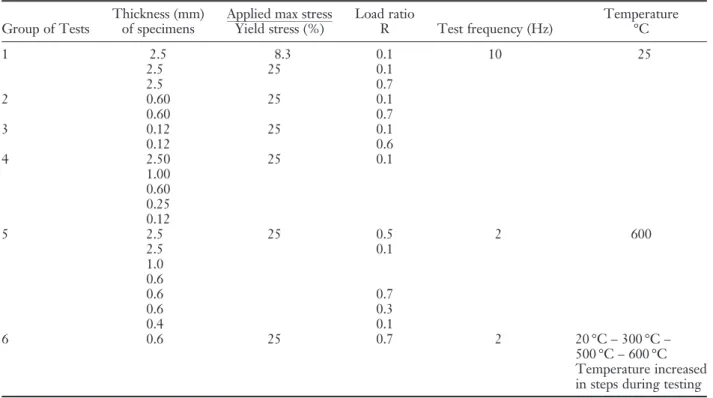
In this section, six sets of experimental parameters are presented in sequence. Experiments are done with a view to show the effect of R ratio and specimen thickness at 25 °C and at 600 °C. The threshold fatigue at 600 °C is also explored. Details of the specimen are given earlier in Fig. 2. Results are presented in the form of Paris curves. Details of the Paris law and the SIF correction factors can be found in.14,24,25Parameters of all the
ex-periments conducted are presented in Table 3.
High temperature tests are conducted at 600 °C. High temperature grips are specially designed and manufactured for these experiments. The grip jaws are
made of IN 100, whereas the shell is made of IN 718. The grips are internally and externally water cooled, with the help of a brass jacket. The jaws are made smooth to avoid any bending or introduction of residual stresses in the thinner specimens.
C R A C K D R I V I N G F O R C E P A R A M E T E R
One of the main concerns in a crack propagation experi-ment on SENT specimens is the accurate evaluation of the stress intensity factor KI. ABAQUS® calculations
(ABAQUS, Inc., Vélizy-Villacoublay Cedex - France) have been performed to determine the J-integral for
Fig. 2 (a) Specimen geometry; (b) engraved grid on specimen surface.
Table 3 Tests for the effects of load ratios on FCGR at different thicknesses
Group of Tests Thickness (mm)of specimens Applied max stressYield stress (%) Load ratioR Test frequency (Hz) Temperature°C
1 2.5 8.3 0.1 10 25 2.5 25 0.1 2.5 0.7 2 0.60 25 0.1 0.60 0.7 3 0.12 25 0.1 0.12 0.6 4 2.50 25 0.1 1.00 0.60 0.25 0.12 5 2.5 25 0.5 2 600 2.5 0.1 1.0 0.6 0.6 0.7 0.6 0.3 0.4 0.1 6 0.6 25 0.7 2 20 °C – 300 °C – 500 °C – 600 °C Temperature increased in steps during testing
different values of a/W, which are used to evaluate KI
using Eq. 1. An expression for correction factor f(a/W) is then established by using Eq. 2. ‘E’ represents the Young’s modulus, ‘σ’ applied stress, ‘a’ crack length and ‘W’ width of specimen. KI ¼ ffiffiffiffiffiffiffiffiffiffiffiffiffiffiffiffiffiffiffiffiffiffiffiffiffiffiffiffiffiffiffiffiffi Jel"E 1=1 # νð 2Þ q (1) KI ¼ f"a=WÞσpffiffiffiffiffiπa (2)
The KIvalues calculated by this procedure have been
verified with the works of other researchers26–28by using
standard rectangular finite element models. The details of this procedure can be found in the works of Shah et al.24,29and the expression used for the correction factor
is24: f a W # $ ¼ 1:0869 þ 0:2383# $Wa þ 1:9830# $Wa 2 #2:8373# $Wa 3þ 2:5771# $Wa 4 (3)
The details presented in24were of finite element
anal-yses on a purely elastic material. This has been found to be sufficient for specimens at ambient temperature. However, at higher temperatures the effects of plasticity are non-negligible (SSY or small scale yielding gives way to LSY or large scale yielding), and thus the use of KI may no longer be relevant. Use of KI in this case
may also give erroneous results on Paris curves of fatigue crack propagation.
A new crack driving force parameter Δ ffiffiffiffiffiffiffiffiffiffiffiffiffiJel;plE′
q
was defined by Sadanada30 to characterise the fatigue crack
propagation of super alloys at high temperatures. The term Jel,plis the J-integral calculated in the finite element
model by using an elastic-plastic material model. How-ever, this parameter is a monotonic parameter and not to be confused with the cyclic J-integral of Dowling.31
E′ is the Young’s modulus for plane deformation defined as:
E’ ¼ E 1=1 # ν" 2% (4)
The use of plane strain conditions in thin specimens may not represent in an accurate manner the state of stress and strain in a thin specimen. However, keeping in view the need for using a coherent and unique damage parameter for comparisons, only the plane strain condi-tion is considered. The advantage of this parameter is that at room temperature, it gives almost the same values as for an elastic analysis because the crack tip plasticity is
very low. However, at higher temperatures this parame-ter shows the effects of crack tip plasticity while same di-mensions (and units) as the KI parameter. The second
advantage is important for comparison of fatigue crack propagation curves at room temperature and elevated temperature. In practice the parameter takes the form25:
ffiffiffiffiffiffiffiffiffiffiffiffiffi Jel;plE’
q
¼ g# $Wa σpffiffiffiffiffiπa (5) At room temperature, the correction factor in Eq. 3 can be used because the effects of plasticity are negligible. However, the expression of the correction factor at 600 ° C is presented in Eq. 6.25 g a W # $ ¼ 1:1321 þ 0:0151# $Wa þ 3:9899# $Wa 2 #5:6491# $Wa 3þ 4:9493# $Wa 4 (6) F A T I G U E C R A C K P R O P A G A T I O N R E S U L T S
As described earlier, the six groups of test described in Table 3 are presented here in sequence in the form of Paris curves.
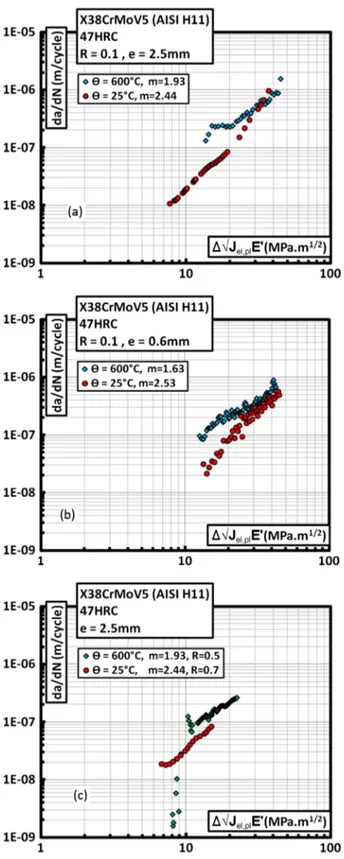
Effect of load ratio R at ambient temperature Effect of load ratios in specimen of 2.5, 0.6 and 0.12 mm shows an increase in crack propagation rate with an in-crease in R as shown in Fig. 3(a), (b) and (c).
An interesting result is seen in the crack propagation curve of 0.60 mm specimen. The specimen tested at R = 0.7 shows a single slope of m = 3.6. However, the specimen tested at R = 0.1 shows two distinct slopes of m = 3.6 for lower ΔK values and m = 2.5 for higher ΔK values. This effect is discussed further in the light of more results later. The increase in crack propagation speed with the increase in R value is almost five times.
The R ratio is also studied for a specimen of 0.12 mm thickness in Fig. 3(c). The R ratios selected are 0.1 and 0.6 (R = 0.7 is not selected due to the limitations of the equipment being used for the testing procedure).
Effect of load ratio exists in all the specimens. How-ever, it can be seen from the results earlier that the highest effect of the load ratios exists in the 0.60 mm specimens.
Effect of specimen thickness ‘e’ at ambient temperature The state of stress and strain at the crack tip is dependent on the specimen thickness. American Society for Testing and Materials standards E647 and E399 impose certain
restrictions on the specimen thickness to ensure a confined plastic zone as well as plane strain conditions (thickness should be >2.5 (KIC/σys)2). For the material
used in this study, the thickness according to this crite-rion would be more than 15 mm. However, because this study deals with the surface and subsurface damage of the tool steels, the specimen thickness is much reduced. This is because in tool steels, the surface cracks appear in the range of 50–300 μm. The concept of using thin specimens for surface damage of tool steels has been pub-lished previously by the authors.24
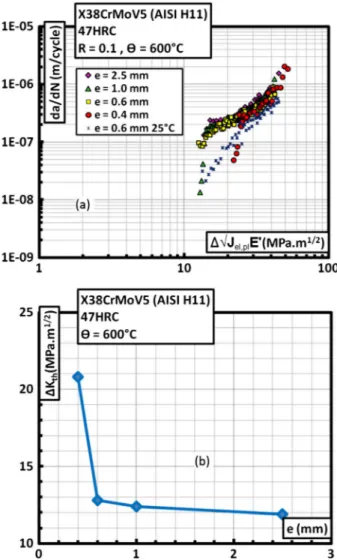
A comparison of FCGR of the 2.5, 0.60, 0.25 and 0.12 mm thick specimens is made in Fig. 4 at an R value of 0.1. It can be seen that the 2.5 and 0.60 mm curves coincide for lower ΔK values, however for higher ΔK (>20 MPa.m1/2), the 0.60 mm specimen shows lesser
FCGR as compared with the 2.5 mm specimen. This gives this specimen its characteristic ‘Two Slope’ FCGR curve. However, it can also be seen that the thinner spec-imens 0.25 and 0.12 mm show slower FCGR as com-pared with the 2.50 mm specimen. However, the slope is parallel and unique as that of the 2.50 mm specimen.
It can be seen that the 0.60 mm specimen shows a transition thickness, where the crack tip conditions pass from the plane strain for ΔK <20 MPa.m1/2 (FCGR co-incident with the 2.50 mm curve) to the plane stress con-dition for ΔK >20 MPa.m1/2 (FCGR coincident with the 0.25 and 0.12 mm curve). The crack propagation in thinner specimens is slower. Due to this transition from plane strain to plane stress condition, the crack propaga-tion rate slows down during the experiment. Due to this, the FCGR curve shows an apparent reduction in the slope. This effect produces the ‘two slope’ effect witnessed in Fig. 3(b) previously.
It is expected that in the thinner specimens, the larger plastic zone creates the crack closure effect, which is eventually responsible for the reduced FCGR with a de-crease in thickness.
Fig. 3 (a) Effect of R ratio, comparison for 2.5 mm, (b) for 0.60 mm
Effect of load ratio R at 600 °C and comparison with ambient temperature
Experiments are carried out at R = 0.1 and R = 0.5 for specimens of 2.5 mm thickness and R = 0.1, 0.3 and 0.7 for specimens of 0.6 mm thickness. All the results of fatigue crack propagation are shown as a function of Δ ffiffiffiffiffiffiffiffiffiffiffiffiffiJel;plE′
q
. This criterion presents a better correlation between tests at 600 °C and at ambient temperature as compared with ΔK. Also, the Δ ffiffiffiffiffiffiffiffiffiffiffiffiffiJel;plE′
q
criterion takes into account the effects of crack tip plasticity at 600 °C.
Fatigue crack propagation at 600 °C in specimens of e = 2.5 mm at different R values seems to show absolutely no effect in the Paris region, Fig. 5(a). However, there seems to be a marked difference in the threshold values of specimens tested at different R ratios. Threshold ∆K value for R = 0.1 is found to be 11.9 MPa.m1/2, whereas
for the specimen tested at R = 0.5 has a lower threshold
value of 7.8 MPa.m1/2. Higher crack closure in the threshold
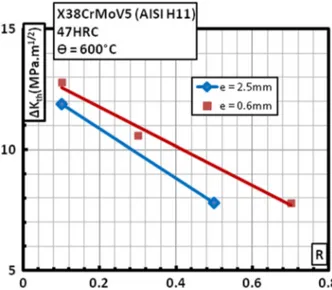
region, for R = 0.1 may be the cause of this difference. Specimens of 0.6 mm thickness have also been com-pared in the same manner with R = 0.1, 0.3 and 0.7 in Fig. 5(b). Effect of R on the threshold value is more pro-nounced for 0.6 mm specimens. Threshold ∆K values are 12.8, 10.6 and 7.8 MPa.m1/2for the R ratios of 0.1, 0.3 and
0.7, respectively. The increase in the threshold value of 0.6 mm specimens as compared with the 2.5 mm specimens may be due to increased plasticity in the thinner specimens (transition from plane strain to plane stress in thin speci-men). This effect is graphically presented in Fig. 6.
Contrary to ambient temperature where no threshold value was detected down to 4.0 MPa.m1/2, ΔK
th clearly
exists at higher loads for specimens tested at 600 °C. This could be attributed to crack closure due to crack tip plas-ticity at high temperature. At ambient temperature, the yield point of this metal is very high, thus the crack tip plasticity at short lengths is very insignificant. However, in a similar material, AISI 4340 heat treated to a yield strength of 1000 MPa, the threshold value has been de-termined at 3.0 MPa.m1/2 in Ref. [32]. Crack closure
may also exist due to crack face mismatch. However, this mechanism exists for high a/W ratios and high ΔK, which is not the case at loads corresponding to ΔKth.
Fatigue crack propagation curves for 600 °C are com-pared with those at ambient temperature. Figure 7(a) shows this comparison for 2.5 mm specimens with elastic and elastic-plastic crack propagation criteria, respec-tively. The crack propagation rate for the specimens at 600 °C is higher for low values of Δ ffiffiffiffiffiffiffiffiffiffiffiffiffiJel;plE′
q
. However, this difference diminishes for higher Δ ffiffiffiffiffiffiffiffiffiffiffiffiffiJel;plE′
q .
Fig. 5 (a) Effect of R ratio in 2.5 mm and (b) 0.6 mm specimen on fatigue crack propagation at 600 °C.
Fig. 6 ΔKth as a function of load ratio R for different specimen thicknesses tested at 600 °C.
Specimens of 0.6 mm tested at these temperatures as shown in Fig. 7(b) show the same behaviour. The dif-ference of fatigue crack propagation rate can be described for low, intermediate and high Δ ffiffiffiffiffiffiffiffiffiffiffiffiffiJel;plE′
q
values as ex-plained subsequently.
It is observed that in general, the material at 600 °C has higher crack propagation rate for low Δ ffiffiffiffiffiffiffiffiffiffiffiffiffiJel;plE′
q values. Slope of the Paris curve ‘m’ is lower at 600 °C; the consequence is that the curves intersect at some inter-mediate value of Δ ffiffiffiffiffiffiffiffiffiffiffiffiffiJel;plE′
q .
Kcat 600 °C seems to be lower than at 25 °C, which
again forces the curves to separate for higher Δ ffiffiffiffiffiffiffiffiffiffiffiffiffiJel;plE′
q values. It is pertinent to mention here that due to large number of points measured in experiments car-ried out on specimens of 0.60 mm thickness, the raw data is presented without cubic spline smoothing techniques.
At higher R ratio, the situation is different. Curves seem to follow a more or less parallel path in the Paris re-gime, with the specimen at high temperature having higher fatigue crack propagation rate, Fig. 7(c).
Threshold values for high temperature specimens are explored in an experiment performed specifically for this purpose in a 0.60 mm thickness specimen for R = 0.1. Under normal conditions of ascending ∆K fa-tigue crack propagation, there is a possibility of confus-ing the threshold value with the notch effect. This is because at low ΔK values, the crack length is low as well, and thus there is the risk that the crack tip is still in the large residual plastic zone of the pre-cracking. The small amount of un-cracked ligament (small speci-men size) renders the exit of crack tip from the plastic zone difficult. Threshold values are thus tested at differ-ent crack lengths, while keeping the evolution of ∆Kmax
limited.
Figure 8(a) shows an experiment performed to deter-mine ΔKthand its comparison with a normal ascending
∆K crack propagation experiment. Stress values indicated are the maximum stress values applied at the specimens. The effects are summarised below as:
• Threshold value in the region of 8 to 12 MPa.m1/2is not an effect of the notch but is reproducible at differ-ent crack lengths. This also goes to show that probably the constraint effects are not very important in this specimen.
• Increase in the R ratio tends to decrease ΔKth. This
in-dicates a presence of crack closure at the threshold region.
• Increase in the maximum stress at 600 °C seems to in-crease the crack propagation rate and reduce the threshold value slightly. This increase could be due
Fig. 7 Fatigue crack propagation at ambient temperature and 600 ° C; (a) e = 2.5 mm, R = 0.1, (b) e = 0.6 mm, R = 0.1 and (c)
to the reduction of the effect of crack closure at higher stresses, which might also explain the apparent insensi-tivity of this material to R ratio when tested at 600 °C at 250 MPa.
• When compared to the specimen tested at 25 °C, it seems that the threshold values for the specimen at 600 °C is higher. In fact, no ΔKthwas determined for
specimens at ambient temperature.
Figure 8(b) shows an experiment of increasing ΔK as well as increasing temperature to confirm the high threshold value at elevated temperatures. In this exper-iment, fatigue crack propagation at 25 °C is carried out in a specimen of 0.6 mm with R = 0.7. An increased R gives an inherent advantage to be able to apply low ∆K values in thinner specimens more conveniently from the testing machine control standpoint. Different steps followed during the experiment and the results are listed as follows:
1 Fatigue crack propagation at 25 °C R = 0.7. This gives a crack propagation curve that is parallel to the other FCGR curve obtained for higher ∆K values with the same loading conditions. The curve follows the simple Paris regime of propagation between 4.4 and 5.0 MPa. m1/2. However for this level of ∆K, there is a fair amount
of scattering in the FCGR data. This is shown as the yel-low data in Fig. 8(b).
2 Specimen heated to intermediate temperature at 300 °C R = 0.7. All the other testing conditions like maximum load, frequency and load ratio are kept the same. The heating is done rapidly. The fatigue crack propagation experiment is continued at 300 °C. Two distinct observations are made. One is that the FCGR increases three times, however the curve remains parallel to the FCGR curve at 25 °C (data in red in Fig. 8(b)). This may be explained by the increase in material damage with a subsequent increase in the temperature. The second observation is a strong reduction in the scat-tering of the FCGR data. Due to an increase in tem-perature, the Young’s modulus decreases. This effect increases the crack opening displacement, which in turn may reduce the effects of crack face roughness and misalignment on the scattering of FCGR data. The propagation is carried out up to 5.7 MPa.m1/2. 3 Specimen heated to 500 °C R = 0.7. This temperature
is 50 °C below the first tempering temperature of the material and is thus expected that no rapid phase trans-formation will occur at this temperature (in particular precipitation). The effects on the FCGR curve would be in principle related to mechanical properties more than metallurgical changes. However at this tempera-ture, we find a crack arrest. It is shown as the data in brown colour in Fig. 8(b). To restart the propagation, the stress level is increased. The FCGR curve for 500 ° C follows closely that of 600 °C. It should be empha-sized that oxidation measurements carried out at 550 °C show a very slow oxidation rate33(even
negligi-ble). Therefore it can be assumed that this crack arrest effect is not related to environmental effects, but to the mechanical behaviour of the material at this tempera-ture. The dashed black line shows the path followed up to this step.
4 Specimen heated to 600 °C R = 0.7. Not much effect is observed on the FCGR curve, and it continues to fol-low the 500 °C curve. This temperature approaches the second tempering temperature of the material, so over tempering and the reduction dislocation density by thermal effects and mechanical cycling may be expected.
Experiment is continued for some increase in the crack length. Then the ∆K is reduced to try to search for the threshold value, which was the principal goal. This
Fig. 8 (a) Determination of threshold value at elevated temperature and (b) effect of temperature variation during fatigue crack propa-gation. Propagation at 25 °C, 300 °C, 500 °C, 600 °C at R = 0.7.
value is found to be near 8 MPa.m1/2, which agrees to
threshold values obtained in other experiments for these ex-perimental conditions (Fig. 8(a) and (b)). The test is then continued up to rupture.
Results in this experiment are presented only as a function of ΔK, because the SIF correction factor for 400 °C and 500 °C have not been determined through numerical simulation. This experiment has established beyond any doubt that the material at high temperature of 600 °C has a higher crack propagation threshold value. It has also been established that fatigue crack propagation curve for 600 °C may cross over the curve for 25 °C near the threshold values. The same observation was made in Ref. [34] in FCGR experiments on 18%CrNb ferritic stainless steels tested at 500 °C. They have explained this effect due to plasticity-induced crack closure at 500 °C as opposed to roughness-induced crack closure at room temperature. Here, the phenomenon may be explained by an increase in the crack tip plastic zone size due to re-duced yield stress and drastic cyclic softening at elevated temperature. This plastic zone is large enough to cause a complete crack arrest.
Effect of specimen thickness on the fatigue crack propagation rate at 600 °C and comparison with am-bient temperature
Decrease in thickness favours the plane stress state tion, whereas in thick specimens,x the plane strain condi-tion prevails. This difference may have an effect on the fatigue crack propagation behaviour of the material. In this section are presented the fatigue crack propagation curves for specimens of different thicknesses all tested at 600 °C.
There seems to be a trend of reduction in crack prop-agation rate in the Paris region with a subsequent de-crease in the specimen thickness Fig. 9(a). This behaviour is less pronounced than tests carried out at am-bient temperature.
The main effect however is seen at the threshold values, with those of the 0.4 mm specimen being 20.8 MPa.m1/2, which is almost twice that of the 1.0 mm
and 0.6 mm specimen Fig. 9(a). Effect on the ΔKthis
ex-plored in detail in the previous section. Evolution of ΔKth
with respect to thickness for R = 0.1 in specimens tested at 600 °C is summarised in Fig. 9(b).
M I C R O S C O P Y
Scanning electron microscopy was carried out on the specimens in the partially cracked specimens and fully ruptured specimens to observe the crack surface. Effect of thickness reduction was in slowing down the fatigue
Fig. 9 (a) Effect of specimen thickness e = 2.50, 1.0, 0.60 & 0.40 mm at 600 °C (b) ΔKth as a function of specimen thickness ‘e’ for R = 0.1 tested at 600 °C.
Fig. 10 Appearance of 45° inclined shear bands on the free surface in a 0.25 mm specimen.
crack growth rate. Usually, this is attributed to the in-crease in the plastic zone size ahead of the crack tip in thinner specimens due to plane stress conditions. This ef-fect was clearly seen by the shear bands created ahead of the crack tip in the 0.25 mm specimen as shown in Fig. 10.
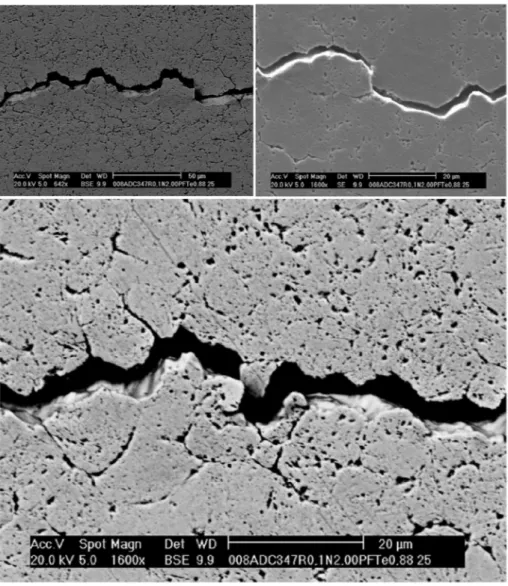
However, SEM images also show that increased plas-ticity causes crack closure due to crack face misalignment as shown in Fig. 11.
All these phenomena are responsible for the crack retardation in thinner specimens. Fracture surface analysis shows a flat surface in the thicker specimens of 2.5 mm and more inclined or curved surface for the thin-ner specimens indicating larger shear damage in thinthin-ner specimens.
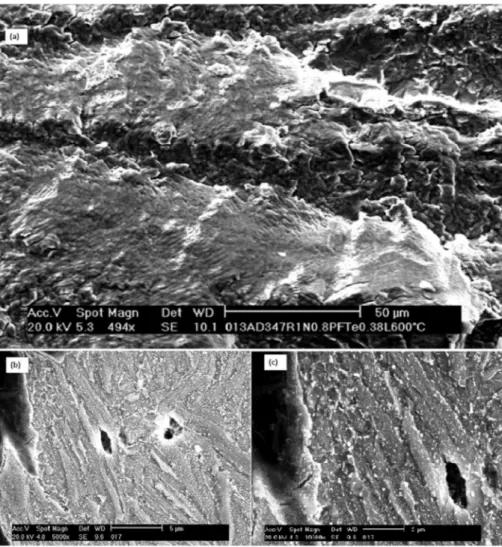
Fractographic analysis of specimens tested at 600 °C shows the presence of an oxide layer with fatigue stria-tions on the crack surface as in Fig. 12 (a). The surface consists of flat and inclined planes along the fracture
surface. Inclined planes signify the shear damage. It is of interest to note that the oxide layer is visible only on the inclined surfaces, indicating higher tendency to oxi-dation of the sheared surface as compared with the flat propagation area. Each plane, however, represents a completely formed crack front.
FCGR curves at 600 °C show no effect of R ratio on the propagation. This is opposite to what is observed on the crack face. Presence of oxide should increase the crack closure and hence the effect of R ratio on FCGR. Absence of this effect is explained by the process of creep. If there is creep deformation in the tension, tension fa-tigue test, that could explain that the two crack faces never come into contact during propagation even at a value of R = 0.1. In one of the experiments, the partially cracked specimen was observed (nearing end of fatigue propagation), and one could clearly see the porosities created by creep deformation ahead of the crack tip as shown in Fig. 12 (b).
C O N C L U S I O N
In this research, an approach to study the surface damage of tool steels is used to identify the effect of thickness on FCGR properties. Effect of load ratio ‘R’ value in H11 tool steel is studied. Tests are carried out at room temperature and 600 °C. These two temperatures usually represent the limits of utilisation of this tool steel. Threshold propagation at high temperatures is also deeply studied.
It is seen that at room temperature, the increase in R ratio causes an increase in the speed of crack propagation. This is usually explained by the presence of crack closure at lower R ratios. At higher temperatures, the effect of R ratio on crack propagation is different in the threshold region and the Paris region. In the stable crack regime there is almost no effect of R ratio. This is due to the ab-sence of crack closure at elevated temperatures in this re-gime of propagation. However, there is a strong effect on
the threshold values. At higher R ratios the threshold values are reduced. It shows that in the threshold regime, strong crack closure effects exist. Threshold values are found to be around 12 MPa.m1/2for R = 0.1 and 8 MPa.
m1/2 for R = 0.7 at 600 °C. This effect of variation in
threshold values seems to increase with a decrease in the specimen thickness. Intermediate temperature of 300 °C simply causes an increase in the crack propagation rate, but no effect on the threshold value is observed un-der the experimental conditions investigated. It has also been demonstrated that the threshold values are not due to stress concentration at notch or pre-cracking but an actual value. Threshold values for ambient tempera-ture have not been established. Crack propagation is seen at SIF values as low as 3.5 MPa.m1/2.
Effect of thickness on fatigue crack propagation has been studied. In general, it is found that the crack propagation speed is reduced with a corresponding reduc-tion in the specimen thickness. This effect exists for both
Fig. 12 (a) Multiple fully developed crack fronts in specimen tested at 600 °C and (b,c) Evidence of porosities created by creep deformation ahead of crack tip at 600 °C.
ambient temperature and elevated temperature. However at ambient temperature, it seems that below 0.6 mm thick-ness, this effect diminishes. Threshold values at 600 °C seem to increase with the decrease in thickness especially for R = 0.1. The reduction of specimen thickness from 0.6 mm to 0.4 mm causes a very sharp increase in ΔKth.
Effect of thickness in reducing FCGR is explained using SEM micrography on partially cracked specimens. It is seen that the high plasticity ahead of the crack tip, in conjunction with crack face mismatch increases the crack closure, thereby reducing the FCGR of thinner specimens. At high temperature, the effect of R ratio is ab-sent, even in the presence of severe oxidation. This is ex-plained by the evidence of creep using SEM micrography. R E F E R E N C E S
1 Persson, A., Bergström, J., Burman, C. (1999) Evaluation of heat checking damage in die casting. 167–178.
2 Ramous, E., Zambon, A. (1999) Dies damage in long term die casting of aluminum alloys. 179–184.
3 Min, Y.-a., Jens, B., Wu X.-c., Xu, L.-p. (2013) Oxidation and thermal fatigue behaviors of two type hot work steels during thermal cycling. J. Iron Steel Res. Int., 20, 90–97.
4 Schwaiger, R., Kraft, O. (1999) High cycle fatigue of thin silver films investigated by dynamic microbeam deflection. Scripta Mater. (USA), 41, 823–829.
5 Kraft, O., Schwaiger, R., Wellner, P. (2001) Fatigue in thin films: lifetime and damage formation. Mater. Sci. Eng. A, 319, 919–923.
6 Hong, S., Weil, R. (1996) Low cycle fatigue of thin copper foils. Thin Solid Films, 283, 175–181.
7 Senger, J., Weygand, D., Motz, C., Gumbsch, P., Kraft, O. (2011) Aspect ratio and stochastic effects in the plasticity of uniformly loaded micrometer-sized specimens. Acta Mater., 59, 2937–2947.
8 Kim, B. J., Shin, H.-A. S., Jung, S.-Y., Cho, Y., Kraft, O., Choi, I-S., Joo, Y-C. (2013) Crack nucleation during mechanical fatigue in thin metal films on flexible substrates. Acta Mater., 61, 3473–3481.
9 Telasang, G., Dutta Majumdar, J., Padmanabham, G., Manna, I. (2014) Structure–property correlation in laser surface treated AISI H13 tool steel for improved mechanical properties. Mater. Sci. Eng. A, 599, 255–267.
10 Persson, A., Hogmark, S., Bergström, J. (2005) Thermal fatigue cracking of surface engineered hot work tool steels. Surf. Coat. Technol., 191, 216–227.
11 Persson, A., Hogmark, S., Bergström, J. (2004) Simulation and evaluation of thermal fatigue cracking of hot work tool steels. Int. J. Fatigue, 26, 1095–1107.
12 Sjöström, J., Bergström, J. (2004) Thermal fatigue testing of chromium martensitic hot-work tool steel after different austenitizing treatments. J. Mater. Process. Technol., 153–154, 1089–1096.
13 Klobčar, D., Kosec, L., Kosec, B., Tušek, J. (2012) Thermo fatigue cracking of die casting dies. Eng. Fail. Anal., 20, 43–53. 14 Shah, M., Mabru, C., Boher, C., Le Roux, S., Rezaï-Aria, F.
(2009) Crack propagation in X38CrMoV5 (AISI H11) tool steel. TOOL 2009 - Tool steels, 02-04 June Aachen, Germany.
15 Amaro, R., Antolovich, S., Neu, R. (2012) Mechanism-based life model for out-of-phase thermomechanical fatigue in single crystal Ni-base superalloys. Fatig. Fract. Eng. Mater. Struct., 35, 658–671. 16 Yuan, S., Wang, Y., Wei, D. (2014) Experimental investigation on low cycle fatigue and fracture behaviour of a notched Ni-based superalloy at elevated temperature. Fatig. Fract. Eng. Mater. Struct., 37, 1002–1012.
17 Shi, D., Hu, X., Wang, J., Yu, H., Yang, X., Huang, J. (2013) Effect of notch on fatigue behaviour of a directionally solidified superalloy at high temperature. Fatig. Fract. Eng. Mater. Struct., 36, 1288–1297.
18 Fernandez-Zelaia, P., Neu, R. (2014) Influence of notch severity on thermomechanical fatigue life of a directionally solidified Ni-base superalloy. Fatig. Fract. Eng. Mater. Struct., 37, 854–865. 19 Berto, F., Gallo, P., Lazzarin, P. (2014) High temperature
fatigue tests of un-notched and notched specimens made of 40CrMoV13. 9 steel. Mater. Des., 63, 609–619.
20 Berto, F., Lazzarin, P. (2014) Recent developments in brittle and quasi-brittle failure assessment of engineering materials by means of local approaches. Mater. Sci. Eng.: R: Rep., 75, 1–48. 21 Pluvinage, G., Capelle, J., Hadj Méliani, M. (2014) A review of
fracture toughness transferability with constraint and stress gradient. Fatig. Fract. Eng. Mater. Struct., 37, 1165–1185. 22 Matvienko, Y. G., Shlyannikov, V. N., Boychenko, N. V. (2013)
In-plane and out-of-plane constraint parameters along a three-dimensional crack-front stress field under creep loading. Fatig. Fract. Eng. Mater. Struct., 36, 14–24.
23 Yang, J., Wang, G. Z., Xuan, F. Z., Tu, S. T. (2013) Unified characterisation of in-plane and out-of-plane constraint based on crack-tip equivalent plastic strain. Fatig. Fract. Eng. Mater. Struct., 36, 504–514.
24 Shah, M., Mabru, C., Boher, C., Leroux, S., Rezai-Aria, F. (2009) Crack propagation in tool steel X38CrMoV5 (AISI H11) in SET specimens. Adv. Eng. Mater., 11, 746–749. 25 Shah, M., Mabru, C., Rezaï-Aria, F. (2010) Investigation of
crack propagation in X38CrMoV5 (AISI H11) tool steel at ele-vated temperatures. Procedia Eng., 2, 2045–2054.
26 Chiodo, M. S., Cravero, S., Ruggieri, C. (2006) Stress intensity factors for SE (T) specimens. Technical Report BT-PNV-68, Faculty of Engineering, University of Sao Paulo .
27 Cravero, S., Ruggieri, C. (2007) Estimation procedure of J-resistance curves for SE (T) fracture specimens using unloading compliance. Eng. Fract. Mech., 74, 2735–2757.
28 John, R., Rigling, B. (1998) Effect of height to width ratio on K and CMOD solutions for a single edge cracked geometry with clamped ends. Eng. Fract. Mech., 60, 147–156.
29 Shah, M., Mabru, C., Rezai-Aria, F., Souki, I., Pasha, R. A. (2012) An estimation of stress intensity factor in a clamped SE (T) specimen through numerical simulation and experimental verification: case of FCGR of AISI H11 tool steel. Acta Metall Sin (English letters), 25, 307–319.
30 Sadanada, S., Shahinian, P. (1980) Elastic-plastic fracture mechanics for high temperature fatigue crack growth. Fract. Mech.: Twelfth Conference, ASTM STP, 700, 152–163. 31 Dowling, N. E. (1976) Geometry effects and J integral approach
to elastic-plastic fatigue crack growth. ASTM Int., 19, 19–32. 32 Liaw, P. K., Leax, T. R., Donald, J. K. (1987) Fatigue crack
growth behavior of 4340 steels. Acta Metall., 35, 1415–1432. 33 Bruckel, P. (2003) Oxydation de l’Acier à Outils X38CrMoV5 à
600-700 °C et en présence de vapeur d’eau. Thesis Ecole des Mines de Paris.
34 Makhlouf, K., Jones, J. (1992) Near-threshold fatigue crack growth behaviour of a ferritic stainless steel at elevated temper-atures. Int. J. Fatigue, 14, 97–104.