HAL Id: hal-02386966
https://hal.archives-ouvertes.fr/hal-02386966
Submitted on 29 Nov 2019
HAL is a multi-disciplinary open access
archive for the deposit and dissemination of
sci-entific research documents, whether they are
pub-lished or not. The documents may come from
teaching and research institutions in France or
abroad, or from public or private research centers.
L’archive ouverte pluridisciplinaire HAL, est
destinée au dépôt et à la diffusion de documents
scientifiques de niveau recherche, publiés ou non,
émanant des établissements d’enseignement et de
recherche français ou étrangers, des laboratoires
publics ou privés.
Anomaly Detection Model Over Blockchain Electronic
Transactions
Sirine Sayadi, Sonia Ben Rejeb, Zièd Choukair
To cite this version:
Sirine Sayadi, Sonia Ben Rejeb, Zièd Choukair. Anomaly Detection Model Over Blockchain Electronic
Transactions. 2019 15th International Wireless Communications and Mobile Computing Conference
(IWCMC), Jun 2019, Tangier, France. pp.895-900, �10.1109/IWCMC.2019.8766765�. �hal-02386966�
XXX-X-XXXX-XXXX-X/XX/$XX.00 ©20XX IEEE
Anomaly Detection Model Over Blockchain
Electronic Transactions
Sirine SAYADI University of Carthage Higher School of Communication of
Tunis (SUP’COM), Mediatron Laboratory, Tunisia [email protected]
Sonia BEN REJEB Mediatron Laboratory Higher School of Communication of
Tunis SUP’COM, Tunisia [email protected]
Ziéd CHOUKAIR Mediatron Laboratory Higher School of Communication of
Tunis SUP’COM, Tunisia [email protected]
Abstract— Electronic transactions with cryptocurrency
systems based on blockchain in our days have become very popular due to the good reputation of this technology. However, that good reputation cannot deny the serious anomalies and the risks that can cause these cryptocurrencies. In this work, we propose a new model for anomaly detection over bitcoin electronic transactions. We used in our proposal two machine learning algorithms, namely the One Class Support Vector Machines (OCSVM) algorithm to detect outliers and the K-Means algorithm in order to group the similar outliers with the same type of anomalies. We evaluated our work by generating detection results and we obtained high performance results on accuracy.
Keywords— Blockchain, Bitcoin, Transaction, Anomaly detection, Machine learning, One Class SVM, K-means.
I. INTRODUCTION
With the great evolution of the Blockchain technology in our days and with many areas of use of this technology such as access control, security of smart home, energy field, Internet of Things and electronic transactions in financial field etc., we are faced with dangerous vulnerabilities such as Distributed Denial of Service (DDOS) attack, selfish mining attack, double spending attack, 51% vulnerability, etc. [1]. That’s why, there are several research works on the anomaly detection over electronic transactions. The generality of these works lacks in their results the accuracy and precision of attack type with a high rate of false positive detection.
Our objective in this paper is to propose a new model for anomaly detection at the Bitcoin electronic transaction using machine learning algorithms on two stages.
In the first stage, we used the One-Class SVM method to detect the outliers and in the second phase, we used the K-means algorithm to regroup the outliers according to a similarity index in order to specify the type of attack.
The rest of this paper is organized as follows: Section II summarizes related work on anomaly detection field and highlight the different method used in those works. Section III describes our proposed model. Section 4 explains experimental steps including data collection and parsing, feature selection, evaluation methods, and experimental results. We devote section 5 to evaluate the performances of
our proposed model. We finish our paper with a conclusion by mentioning some future works.
II. RELATEDWORKS
Several researchers have focused their research on anomalous detection on electronic transactions.
R. Kumari and M. Catherine in [2] use the K-means algorithm for monitoring and clustering malicious activities in the behavior of nodes by separating groups with similar traits from blockchain networks, and then group it to identify the malicious node or any illegal activity. They used the Dynamic Time Wrapping technique to calculate the similarity index and the time taken for a transaction and the quantity of the amount from one node to another as the Behavior Rating Parameters. A. Bogner [3] use an automatic learning approach based on an unsupervised learning algorithm to optimize anomaly detection. They use as features the average number of transactions in a block in time, the time of blocks that are both distributed, the number of transactions according to the gas consumed and the consumption of gas per block over time.
Thai T. Pham and S. Lee [4] propose a method for detecting anomalies on a Bitcoin transaction network by detecting which users and transactions are the most suspicious. They used three unsupervised learning methods; k-means, Mahalanobis distance, and Unsupervised Support Vector Machine (SVM).
M. Signorini and al [5] proposes a Blockchain anomaly detection (BAD) solution exploiting blockchain metadata to collect malicious activity. The idea is to collect the local attacks injected in the form of malicious transactions and reused them later to prevent similar attacks on the untainted nodes.
M. Zhang and al [6] describes the efficiency of the One Class SVM algorithm for intrusion detection over the network with higher detection rate and better performance in terms of accuracy.
A. Feder and al [7] studies the impact of denial of service (DDoS) attacks and other disruptions on the number and distribution of Bitcoin transactions.
Based on the state of the art that suffers from a high rate of false alarms. This paper propose a new model for Anomaly detection using One-Class SVM and K-means algorithms to
optimize detection results. One-Class SVM is used in step 1 for behavioral analysis to detect the outlier’s values of bitcoin transactions. K-means clustering will then be used in step 2 not only to validate the attack but also to group each type of attack together based on the distance between the similarity indices.
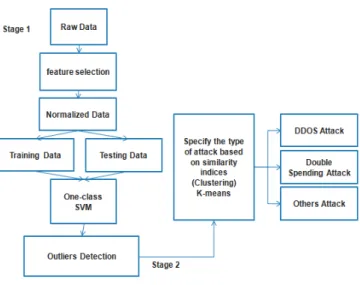
III. PROPOSED MODEL
In order to detect attacks in Bitcoin electronic transactions, we apply two categories of verification.
In the first step, we apply a behavioral analysis in which we use the One-Class SVM algorithm to detect outliers. In Step 2, we apply the K-means clustering algorithm to gather similar attacks in order to specify their types.
Figure 1 shows the different steps that we are going to work on.
Fig.1. Proposed Model
A. Stage1: Novelty Detection using One-Class SVM
The support vector machine (SVM) method for novelty detection is proposed by Schölkopf et al. [8]. This algorithm is the extension of the support vector algorithm to untagged data.
In a space, One-Class SVM makes it possible to separate all the points of data of the origin by maximizing the distance of this hyperplane at the origin. Thus obtaining as a result a binary function that captures the regions of the input space and the probability density of the data in these regions.According to the training data, this function returns +1 in a normal region and -1 elsewhere.
The decision function g(x) for one-class SVMs is defined as follows:
g
(
x
)
=
ω
Tφ
(
x
)
−
ρ
(1)Where
ω
is the vector perpendicular to the decision boundary,φ
(x
)
the transformation function defined by the kernel,ρ
is the bias term and the superscript . refers to the transpose of a vector.Depending on the sign of decision function, normal and outlying points are defined. The magnitude of the decision function is proportional to the distance to the decision boundary.
One-class SVM ( ) simply output a binary label : normal when positive, outlying otherwise. ( ) is defined as follows:
f
(
x
)
=
sgn(
g
(
x
))
(2)B. Stage 2 : Clustering Of Similar Outliers Using K-means
Clustering in k-means is a data partitioning method first used by James McQueen in 1967 [9]. Given points and an integer k, this method is divided into groups, called clusters according to a similarity index to minimize a certain function. We consider the distance of a point to the average of the points of its cluster; the function to be minimized is the sum of the squares of these distances.
We try to partition a set of points
n
(
x
1,
x
2,...,
x
n)
into kclusters
S
=
{
S
1,
S
2,...,
S
k}
with (k ≤ n) by minimizing the distance between the points inside of each partition as defined in equation (3):
= Χ∈−
Χ
k i S i j S i I 1 2min
arg
µ
(3) Whereµ
i is the centroid of points inSi.For our proposition then, we will use only the negative output points of the first stage One Class SVM
)
,...,
,
(
x
1x
2x
nn
for allf
(x
)
<0 as input data for the second stage K-means algorithm in order to regroup these outliers in S clusters.IV. EXPERIMENTATION
In this section, we explain our experimental method starting by data collection and parsing. Then we describe the feature selection and we present our evaluation method and finally, we provide our experimental results.
A. Data Collection and Parsing
We use Bitcoin transaction data obtained by a data source on the Bitcoin blockchain [10]. The dataset contains various bitcoin currency statistics starting from January 3, 2009.
The dataset contains 90514 values in 33 time series such as (Bitcoin days destroyed, Bitcoin days destroyed cumulative, Blockchain size, Costof transaction volume, Cost per transaction, Difficulty, Estimated transaction volume, Estimated USD transaction volume, Hash rate, Market capitalization, Market price (USD), Median transaction confirmation time, Miners returned, My Wallet number of transactions per day, My Wallet number of users, My Wallet transaction volume, Number of orphaned blocks, Number of transactions, Number of transactions excluding popular addresses, Number of transactions per block, Number of unique Bitcoin addresses Used, Total Bitcoins in circulation,
Total output volume, Total transaction fees, Trade volume vs transaction volume ratio, USD exchange trade volume, etc.) [10].
We use this data as a set of normal behavior data for our anomaly detection model.
Because of the lack of bitcoin data transactions datasets containing anomalies, we have created it to validate our proposed model. We analyze the data according to the behavior of the most serious attacks and which can cause great risks of security, credibility, trust and especially financial losses.
For example we chose DDoS Attack, according to [12], « 74% of bitcoin-related sites are affected by a DDOS attack ». We chose Double Spending Attack. According to [13], Double-Spend attack on Bitcoin Gold (a forked cryptocurrency of Bitcoin) caused the theft of an amount of 18.6 million US dollars in May 2018. According to [14], $ 18 million of loss was caused by 51% vulnerability on the Bitcoin Gold cryptocurrency network in the summer 2018. That’s why we chose also 51% vulnerability. We imitate the reactions of these attacks on the normal dataset cited above. For example, Denial of Service attacks is a set of operations executed in a single transaction to congest a network. This follows an increase in the size of the blockchain and in the size and the number of transactions.
Double Spending attack will spend the same amount twice while taking advantage of minor confirmation delays.
51% Vulnerability is possible when a hacker controls 51% of the hash rate on the network.
B. Feature Selection
In order to use One Class SVM algorithm in step one we need data containing attacks that are defined as outliers data. And to use the k-means algorithm to partition these anomalies according to an index of similarity, we need at least 2 types of anomalies.
As already explained above, we will select the features according to the behavior of some types of attacks while at the same time, their reactions on the set of characteristics.
In the dataset mentioned above, we select the following characteristics.
• Blockchain size.
• Difficulty changes over time. Difficulty is a measure of how difficult it is to find a new block compared to the easiest it can ever be.
• Hash rate: The estimated number of giga hashes per second (billions of hashes per second) the Bitcoin network is performing.
• Transaction volume: the total output volume with the addition of an algorithm which attempts to remove change from the total value.
• Median transaction confirmation time: The median time for a transaction to be accepted into a mined block and added to the public ledger.
• Total number of unique Bitcoin transactions per day. • Average block size.
C. Evaluation methods
In order to obtain better training and test results for the detection model, the values of the dataset must be normalized within the same range.
In this work, we choose the range of values between 0 and 1.
We have used the following formula for the data normalization task, where
x'
is the new value,x
is the value given to normalize, andmin(x)
andmax(x)
are the minimum and maximum of all existing values respectively.′ = ( − ( )) / ( ( ) − ( ))
(4)
After the normalization of the dataset. We move to the training stage. Only normal transactions data are in our hands. This explains our choice for an unsupervised machine learning algorithm OCC (One Class Classification) [11] where only positive samples are available.
We used OCSVM (One Class Support Vector Machines) [8] in our work. Because it has shown better performance in several application domains and especially in anomaly detection.
After data normalization, we have split our dataset on training data for the training level of our model and test data in order to detect the outliers over anomaly transactions. A score will be given to the OCSVM anomaly detection model for each type of outputting a decision, (1) if normal data or (−1) if abnormal data.
We afterward used the outliers data with a score (−1) in the k-means algorithm to validate and regroup the similar anomalies, and this by calculating a simulated index between the detected outliers.
Since we test our data in two steps, we can check the validity of our methods by checking whether any suspicious outlier data detected by OCSVM is part of similar groups by suspicious transactions detected by K-means.
D. Exeprimental Results
In order to mount our experiment, we develop our proper program with Python using Spyder programming API with the Framework Anaconda on the first stage and Orange3 API on the stage 2.
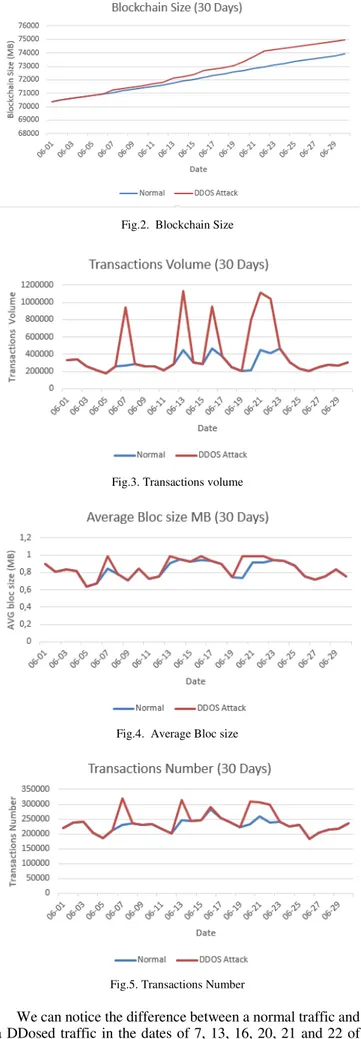
We visualized for each type of attack the change of reaction of the features. For example, for a DDOS attack, we notice in Figure 2 an increase in blockchain size compared to normal transactions. We also notice sharp peaks in the volume of transactions at the DDOS attacks in Figure 3. A slight increase in the average block size in Figure 4 and peaks which explains the sharp increase in the number of transactions in the Figure 5 due to a DDOS attack.
Fig.2. Blockchain Size
Fig.3. Transactions volume
Fig.4. Average Bloc size
Fig.5. Transactions Number
We can notice the difference between a normal traffic and a DDosed traffic in the dates of 7, 13, 16, 20, 21 and 22 of June that we have imitate the reaction of a DDOS attack on
the features of a normal traffic. We can notice an increase in blockchain size in Figure 2, sharp peak on the volume of transactions in Figure 3, increase on block size in Figure 4 and peaks on the numbers of transactions in Figure 5.
For the Double spending attack, we notice in Figure 6 an increase in the median transaction confirmation level on 2, 10, 17, 18 and 19 June where does this attack. This is because the attacker will profit to a long time to confirm a transaction in order to launch another one.
Fig.6. Median Transaction Confirmation
For the 51% vulnerability attack, Figure 7 shows a diminution at the difficulty computation level on 8, 12, 14 and 22 June at the time of this type of attack. The attacker here takes advantage of the ease of difficulty algorithms to insert a 51% difficulty attack.
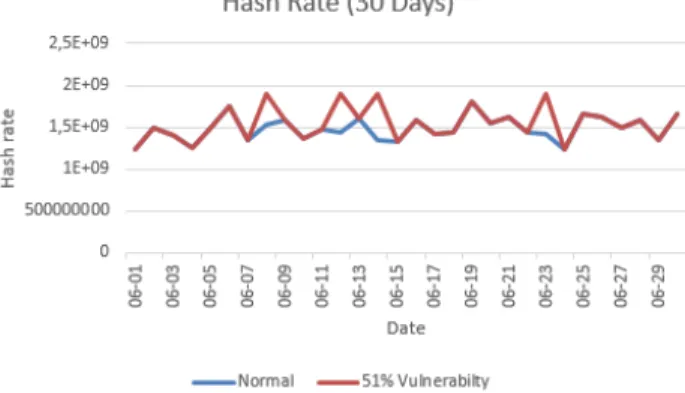
Figure 8 shows an increase in Hash Rate in case of 51% vulnerability on 8, 12, 14 and 22 June. This explains the reason for this attack which is the possession of more than 50% hashing rate.
Fig.8. Hash Rate
We have 16 anomalies made up of 3 types of attacks: 6 DDOS attacks, 6 double expense attacks and 4 attacks with 51% vulnerability. In the first stage, we detected 15 anomalies using OCSVM algorithm.
By using Kmeans in the second stage, we succeeded to cluster the anomalies detected on first stage in 3 clusters with 0.951 as a better result of clustering.
Figure 9 shows the silhouette of the Kmeans algorithm scores.
Fig.9. K-Means scores
We observe in Figure 10 the partitioning of anomalies under 3 clusters.
Fig.10. K-Means Clustering Result
V. PERFORMANCEEVALUATION
For the stage 1, we tested our detection method on the test data set and the dataset containing anomalies. In total, we have inserted 2190 data for training. We used 548 data for test and 16 data containing anomalies.
We show in Table I the confusion matrix to describe our detection results. In this run, we succeed in revealing 15 transactions containing anomalies, generating only 1 transaction as false negatives. However, we detect 54 as false positives.
TABLE I. CONFUSION MATRIXUSING OCSVME
Prediction Anomaly Transactions Normal Trasactions Anomaly Transactions 15 1 Normal Trasactions 54 494
We evaluate in Table II the performance of the OCSVM anomalies detection model. We successively give 0.99 as True Positive Rate (TPR) or precision, 0.21 as true negative rate (TNR), 0.78 as false positive rate (FPR), 0.002 as false negative rate (FNR) and 0.9 as accuracy.
TABLE II. CONFUSION MATRIXUSING OCSVM
TPR TNR FPR FNR Accuracy
0.99 0.21 0.78 0.002 0.9
To evaluate the stage 2 result, the figure 11 shows 3 clusters: C1 with 4 frequency, C2 with 7 frequency, and C3 with 4 frequency.
We draw in the Table III the detection result using K-Means method. We have detected 4 attacks on a total of 6 DDOS attacks, 7 attacks on a total of 5 double spending attacks and 4 attacks on a total of 4 attacks of 51% vulnerability.
TABLE III. DETECTION RESULTS USING KMEANS Attacks Detection Results
DDOS 6 4
Double spending 6 7 51%
Vulnerability
4 4
The Rand index (5) or Accuracy measures the percentage of decisions that are correct:
=
(5)With is the True Positive, is the True Negative detection is the false Positive detection and is the False Negative detection.
According to Table III and equation (5), the accuracy is 0.93 which is a very interesting result of precision.
VI. CONCLUSIONANDFUTUREWORK
Cryptocurrencies in our days become a mechanism of transfer of currencies very used. Which allows two or more participants to exchange bitcoins or any type of cryptocurrency in a very secure way. This is because blockchain has a security technology. But this should not neglect the heavy losses due to this type of money transfer. This represents a real and dangerous threat that affects the credibility of crypto-currencies.
In this article, we propose a promising method for detecting anomalies in bitcoin electronic transactions. We use a dataset containing a set of normal bitcoin transactions and we have created a dataset containing a set of attacked data based on the reactions of these attacks on some features.
We started our methods by the detection of outliers with OSVM which gave good results according to our evaluation of performances.
In addition, we continued our method with the K-Means algorithm to gather similar attacks.
Our experiment shows that both methods have generated good accuracy.
In our future work, we will try to detect other vulnerabilities on blockchain technology by specifying the type of risk trying to minimize the false-positive rate.
REFERENCES
[1] S. Sayadi, S. Ben Rejeb, and Z. Choukair. “Blockchain Challenges and Security Schemes: A Survey,” 7th International Conference on Communications and Networking (IEEE ComNet’2018), pp. 1-7, Nov. 2018.
[2] R. Kumari, and M. Catherine, “Anomaly Detection in Blockchain Using Clustering Protocol,” International Journal of Engineering Research in Computer Science and Engineering (IJERCSE), vol. 4, no. 12, Dec. 2017.
[3] A. Bogner, “Seeing is Understanding – Anomaly Detection in Blockchains With Visualized Features, ” International Joint Conference on Pervasive and Ubiquitous Computing and the ACM International Symposium on Wearable Computers, Sep. 2017. [4] P. T. Pham, and S. Lee, “Anomaly Detection in Bitcoin Network Using
Unsupervised Learning Methods,” CoRR, Fev. 2017.
[5] M. Signorini, M. Pontecorvi, W. Kanoun, and R. D. Pietro, “BAD: Blockchain Anomaly Detection,” CoRR, Jul. 2018.
[6] M. Zhang, B. Xu, and J. Gong, “An Anomaly Detection Model Based on One-Class SVM to Detect Network Intrusions,” 11th International Conference on Mobile Ad-hoc and Sensor Networks (MSN), pp. 102-107, Dec. 2015.
[7] A. Feder, N. Gandal, J. T. Hamrick, and T. Moore, “The Impact of DDoS And Other Security Shocks On Bitcoin Currency Exchanges: Evidence From Mt. Gox,” Journal of Cybersecurity, vol. 3, no. 2, pp. 137-144, Jun. 2017.
[8] B. Schölkopf, J. C. Platt, J. C. Shawe-Taylor, A. J. Smola, and R. C. Williamson, “Estimating The Support of a Highdimensional Distribution,” Neural Computation, vol. 13, no. 7, pp. 1443-1471, Jul. 2001.
[9] J. MacQueen, “ Some Methods For Classification And Analysis of Multivariate Observations,” Proc. of 5th Berkeley Symposium on Mathematical Statistics and Probability, vol. 1, p. 281-297, 1967. [10] https://www.blockchain.com/charts.
[11] T. C. Minter, “Single-Class Classification,” Proc. 1st Sympo. Machine Processing of Remotely Sensed Data, 1975.
[12] https://www.bleepingcomputer.com/news/security/74-percent-of-all-bitcoin-related-sites-suffered-a-ddos-attack/. [13] https://www.zdnet.com/article/bitcoin-gold-hit-with-double-spend-attacks-18-million-lost/. [14] https://www.liteforex.com/blog/for-investors/cryptocurrency-attacks-types-of-vulnerabilities-risks-and-result.