HAL Id: hal-01609015
https://hal.archives-ouvertes.fr/hal-01609015
Submitted on 15 Mar 2019
HAL is a multi-disciplinary open access
archive for the deposit and dissemination of
sci-entific research documents, whether they are
pub-lished or not. The documents may come from
teaching and research institutions in France or
abroad, or from public or private research centers.
L’archive ouverte pluridisciplinaire HAL, est
destinée au dépôt et à la diffusion de documents
scientifiques de niveau recherche, publiés ou non,
émanant des établissements d’enseignement et de
recherche français ou étrangers, des laboratoires
publics ou privés.
Effect of roll compactor sealing system designs: A finite
element analysis
Alon Mazor, Lucia Perez-Gandarillas, Alain de Ryck, Abderrahim Michrafy
To cite this version:
Alon Mazor, Lucia Perez-Gandarillas, Alain de Ryck, Abderrahim Michrafy. Effect of roll compactor
sealing system designs: A finite element analysis. Powder Technology, Elsevier, 2016, 289, pp.21-30.
�10.1016/j.powtec.2015.11.039�. �hal-01609015�
Effect of roll compactor sealing system designs: A finite element analysis
Alon Mazor
⁎
, Lucia Perez-Gandarillas, Alain de Ryck, Abderrahim Michrafy
Université de Toulouse, Mines Albi, CNRS, Centre RAPSODEE, Albi, France
a b s t r a c t
In the pharmaceutical industry, the roll compaction is part of the dry granulation process, densifying fine powders into ribbons that will be later milled to produce granules with good flowability for subsequent die com-paction process. Roll compactors are constructed with a sealing system, limiting the loss of powder from the sides. However, the sealing system may result in unwanted non-uniformity of the ribbon's properties. In this work, a 3D Finite Elements Method (FEM) modeling is used to analyze the roll compaction process and the effect of sealing system designs on the compacted ribbon's density distribution. A density dependent Drucker–Prager Cap (DPC) constitutive model for microcrystalline cellulose (Avicel PH-101) was calibrated and implemented in Abaqus/Explicit. Two different FEM models were investigated, one with a fixed side sealing called cheek plates and another where the side sealing is integrated with the bottom roll called rimmed-roll. Both numerical and experimental results clearly show the non-uniform roll pressure and density distribution for the cheek plates assembly, whereas the rimmed-roll shows an overall more uniformly distributed resultant pressure and density distribution. These results demonstrate the capability of FEM modeling to provide insight and help achieving a better understanding of the roll compaction process.
Keywords: Roll compaction Finite Elements Method Drucker–Prager Cap model Density distribution Rimmed-roll
1. Introduction
In the pharmaceutical industry, the roll compaction process is used for dry granulation, densifying fine powders into large dense granular thus improving flowability for direct compression, avoiding segregation in the powder mix and minimizing dust problems[1]. Densifying the powder is done by passing between two counter-rotating rolls, which applies mechanical pressure on the powder. The friction between the feed material and roll surface pushes the powder to a narrow gap, where the powder is subjected to high stresses leading to the formation of compacted ribbons. The roll pressure in the gap region during roll compaction process has the most significant impact on the porosity of the ribbons. Ribbon's density, i.e., solid fraction, is one of the critical quality parameter of roll compaction process that influences the compactibility of granules during tablet formation. The roll compaction system design and operating conditions have a direct effect on the produced compacted ribbon's quality. In order to ensure the consistency, repeatability and quality of the final dosage form, it is important to ensure the quality and avoid heterogeneity of the produced ribbon.
The roll compactors are constructed with a sealing system, limiting the loss of powder from the sides[1,2]. However, the sealing system may result in unwanted non-uniform properties along the ribbon's width and may also exhibit fractured or incomplete compacted edges. Numerous experimental studies were conducted in order to evaluate
the density distribution of roll compacted ribbons using destructive and non-destructive methods. The studies were conducted on pharma-ceutical powders using laboratory roll compactors integrated with fixed side seals (cheek plates), evaluating the density distribution by ultra-sonic[3], micro-indentation[4], X-ray tomography[3,4], near infrared chemical imaging[5,6] and pressure gauges[7,8]. Results showed non-uniformity along the ribbon's width with lower densification at the edges and higher at the middle of the produced ribbon. Moreover, cheek plates may also have a negative effect on the ribbon with fractured or incomplete compacted edges.
Funakoshi[9]developed a roll compactor with concave-convex roll pair in order to avoid the loss of powder and to reduce the ribbon's heterogeneity. The compaction pressure distribution obtained for convaco-convex rolls showed an overall uniform distribution compared to the flat rolls which obtained higher compaction pressure at the middle and lower at the edges. Based on the same mechanics, several roll compactors offers a rimmed-roll sealing system in order to reduce the cheek plates unwanted effects.
Over the past two decades, Finite Elements Method (FEM) modeling were adopted and further developed to simulate pharmaceutical forming processes. FEM models of powder roll compaction process which started considering a plane strain two-dimensional case[10–12], founded to be comparable and more accurate than the one-dimensional analytical Johanson[13]and Slab method[14,15]models. With the increasing com-putational power in the last years, the development of three-dimensional models provided greater insight on the pressure and density distribution during the roll compaction processes[16,7,17]. Wang et al.[18]found a ⁎ Corresponding author.
variation in the local density for different sealing system using FEM models, however, this numerical study was not fully investigated nor validated experimentally.
The aim of this work is to investigate by FEM modeling the roll com-paction process using both rimmed-roll and cheek plates sealing system design. FEM models may give further insight and help understand the mechanics of complex processes such as the roll compaction process. The simulation results are compared with experimentally measured density distribution of the produced ribbons in order to validate the FEM models.
2. Materials and methods
2.1. Roll compaction design and process parameters
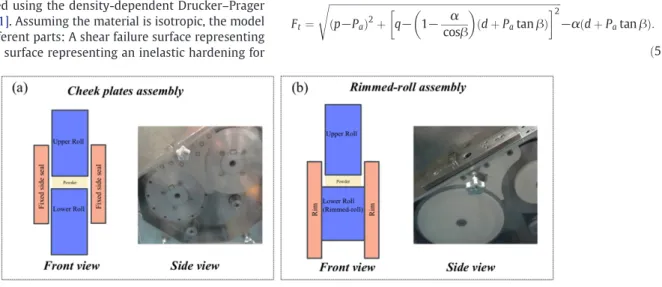
The ribbons were produced in this work by Gerteis roll compactor: Mini-pactor 250/25 (Gerteis Machinen + Process engineering AG, Jona, Switzerland). The Gerteis Mini-pactor roll compactor has two possible assemblies for side sealing: cheek plates or rimmed-roll as can be seen inFig. 1. The most commonly used sealing system is the cheek plates (i.e. fixed side seals), which are fixed and positioned in be-tween the rolls. In order to avoid the problems caused by cheek plates, the Gerteis Mini-pactor also offers a rimmed-roll sealing system. The rimmed-roll is basically a ring, which is mounted on the bottom roll and acts as a sealing in the compaction region. The process parameters set were a controlled gap mode for 1.5 mm, roll speed of 2 rpm and 4 kN/cm roll separation force. The rolls chosen are knurled rolls. 2.2. Powder
The powder used in this work is the microcrystalline cellulose (Avicel PH 101, FMC BioPolymer, Philadelphia, PA, USA). The MCC is one of the most important and widely used excipient in the pharmaceu-tical industry. It has excellent compressibility properties and used as diluent for drug formulations in the tableting process[19,20]. Tablets with MCC show high strength and on the other hand disintegrate quick-ly. The true density of the powder blend was determined using a helium pycnometer (Accupyc 1330, Micromeritics Instrument Corp., Norcross, GA, USA) as ρtrue=1.56 g/cm3. The bulk density was obtained from
the manufacturer, having values of 0.32 g/cm3which correspond to an
initial relative density of 0.2. Magnesium stearate (MgSt) was used as lubricant in die compaction.
2.3. Constitutive model
The behavior of the powder, considered as porous compressible material, is described using the density-dependent Drucker–Prager Cap (DPC) model[21]. Assuming the material is isotropic, the model consists of three different parts: A shear failure surface representing shearing flow, a cap surface representing an inelastic hardening for
plastic compaction and a transition zone between the two surfaces, pro-viding smooth surface to avoid singularities in the modeling (Fig. 2.). The cap surface serves two main purposes. It bounds the yield surface in pure hydrostatic compression and controls the volume dilatancy when the material yields in shear[22].
Experimental calibration of the DPC model for pharmaceutical
[23–28], metallic[29,30]and ceramic[31]powders were extensively conducted in previous studies. The Drucker–Prager shear failure surface can be determined by two of the four experiments for measuring tablets strength: uniaxial tension, pure shear, diametrical compression and uniaxial compression tests. As the maximum loading values of each experiment are positioned on the shear failure line, by using two tests the shear failure line can be determined. The slope of the line represents the friction angle β, and the intersection with q axis represents the cohesion, d. The following equation represents the shear failure line, Fs:
Fs¼ q−d−p tan β ¼ 0: ð1Þ
Where the hydrostatic pressure (i.e. negative mean stress), p and the effective Von mises equivalent stress, q are obtained from the stress ten-sor, σ and defined as follows:
p ¼13tr σð Þ ð2Þ q ¼ ffiffiffiffiffiffiffiffiffiffiffiffiffiffiffiffiffiffiffiffiffiffiffiffiffiffiffiffiffiffiffiffiffiffiffiffiffiffiffiffiffiffiffiffiffiffiffiffiffiffiffiffiffiffiffiffiffiffiffiffiffiffiffiffiffiffiffiffiffiffiffiffiffiffiffiffiffiffiffiffiffi 1 2 ðσ1−σ2Þ 2 þ σð 2−σ3Þ2ðσ3−σ1Þ2 h i r : ð3Þ
The cap yield surface is obtained by analyzing the stress state of the loading and unloading path in die compaction and written as:
Fc¼ ffiffiffiffiffiffiffiffiffiffiffiffiffiffiffiffiffiffiffiffiffiffiffiffiffiffiffiffiffiffiffiffiffiffiffiffiffiffiffiffiffiffiffiffiffiffiffiffiffiffiffiffiffiffiffiffiffiffiffiffiffiffiffiffiffiffiffiffi p−Pa ð Þ2þ 1 þ α−α= cos βRq " #2 s −R d þ Pð atan βÞ: ð4Þ
Where the density-dependent parameters R, d and β are the cap eccentricity, cohesive strength and internal friction angle, respectively. α is the smoothing transition constant that is used to define the smooth-ing transition between the shear failure surface and the cap. In this work, an arbitrary transition parameter of α=0.01 was chosen (typically 0.01bαb0.05) in order to ensure avoiding numerical singularities.
As mentioned previously, in order to obtain a smoothing transition between the shear failure surface and the cap yield surface, a transition surface Ftshould be applied:
Ft¼ ffiffiffiffiffiffiffiffiffiffiffiffiffiffiffiffiffiffiffiffiffiffiffiffiffiffiffiffiffiffiffiffiffiffiffiffiffiffiffiffiffiffiffiffiffiffiffiffiffiffiffiffiffiffiffiffiffiffiffiffiffiffiffiffiffiffiffiffiffiffiffiffiffiffiffiffiffiffiffiffiffiffiffiffiffiffiffiffiffiffiffiffiffiffi p−Pa ð Þ2þ q− 1−cosβα " # d þ Patan β ð Þ $ %2 s −α d þ Pð atan βÞ: ð5Þ
2.3.1. Determination of elastic properties
In this model, a simplified approach considering linear elasticity was implemented. This simplification is due to the difficulties extracting data from the non-linear behavior of the unloading in the experiment and mainly due to computational reasons, solving a linear elasticity. In fact, at low stresses and densities the elasticity is highly non-linear, whereas at high stresses and densities the elasticity shows higher linear behavior. Powder compaction can be adequately simulated by taking into account only the linear elastic part. However, simulating the ejection and extraction out of the die (or rolls) requires the non-linear contribution of the elasticity as well.
From the generalized three-dimensional Hook's law stress–strain relationship, assuming linearly elastic isotropic materials and super-positioning the strain components in a cylindrical coordinates system (z,r,θ), the strain along each axis can be written as:
εzz¼1E½σzz−ν σð rrþ σθθÞ& ð6Þ
εrr¼1E½σrr−ν σð zzþ σθθÞ& ð7Þ
εθθ¼1E½σθθ−ν σð zzþ σrrÞ&: ð8Þ
Considering the cylindrical die as rigid (εrr=0) with axial symmetry
conditions (εrr=εθθand σrr=σθθ) Eq.(7). can be rewritten as:
Δεrr¼1E½Δσrr−ν σð rrþ σzzÞ& ¼ 0: ð9Þ
From Eq.(9), Poisson's ratio ν can be expressed:
ν ¼ΔσΔσrr rrþ Δσzz¼ Δσrr Δσzz Δσrr Δσzzþ 1 : ð10Þ
In the same manner and by knowing the Poisson's ratio obtained in Eq.(10), the Young's modulus E can be expressed from Eq.(6): Δεzz¼1E½Δσzz−ν σð rrþ σrrÞ& ð11Þ E ¼ΔσΔεzz zz 1 þ ν ð Þ 1−2νð Þ 1−ν ð Þ : ð12Þ
Therefore, it is needed to measure ΔσrrΔσzzand Δεzzin order to
obtain the elastic properties from the unloading compaction curve (Eqs.(10) and (12).).
2.3.2. Determination of shear failure
The shear failure line is constructed by knowing the cohesion d, which is the intersection with the q plane and the internal friction angle β which is the slope of the line. First the tensile and compressive strength of the compacted powder are determined using a diametrical compression test and an unconfined uniaxial compression test. For diametrical compression, the tensile strength σdand stress state (p–q)
are defined as following:
σd¼2FπDtd ð13Þ pd¼2 3σd qd¼ ffiffiffiffiffiffi 13 p σd: ð14Þ
Where Fdis the crushing force, D is the tablet diameter and t is the
tablet thickness. For the unconfined uniaxial compression test: σc¼ Fc
πD2 ð15Þ
pc¼ −13σc qc¼ −σc: ð16Þ
Where σcis the axial compression strength and Fcis the axial
compression force at the yield point. By knowing the stress state (p–q) of both test, the cohesion and internal friction angle can be calculated: d ¼σcσd ffiffiffiffiffiffi 13 p −2 & ' σcþ 2σd ð17Þ β ¼ tan−1 3 σð cþ dÞ σc $ % ð18Þ
2.3.3. Determination of cap surface
From the axial σzzand radial σrrpressure obtained in the instrumented
die, considering cylindrical (r,θ,z)-coordinates with axisymmetry conditions (σrr=σθθ), the mises-equivalent shear stress (Eq.(3).), and
the mean stress (Eq.(2).), are simplified, respectively:
q ¼ σj zz−σrrj ð19Þ
p ¼σzzþ 2σ3 rr: ð20Þ The evolution parameter Parepresenting the hardening or softening
driven by the volumetric plastic strain, the cap eccentricity R and the hydrostatic pressure Pbare obtained as follows:
Pa¼−3q−4d tan β þ ffiffiffiffiffiffiffiffiffiffiffiffiffiffiffiffiffiffiffiffiffiffiffiffiffiffiffiffiffiffiffiffiffiffiffiffiffiffiffiffiffiffiffiffiffiffiffiffiffiffiffiffiffiffiffiffiffiffiffiffiffiffiffiffiffiffiffiffiffiffiffiffiffiffiffiffiffiffiffiffiffiffiffiffiffiffiffiffiffiffiffiffiffiffiffiffiffi 9q2þ 24dq tan β þ 24pq tan β2 þ 16q2tan β2 q 4 tan β2 ð21Þ R ¼ ffiffiffiffiffiffiffiffiffiffiffiffiffiffiffiffiffiffiffiffiffiffi 2 3qðp−PaÞ s ð22Þ Pb¼ Paþ R d þ Pð atan βÞ: ð23Þ
The hydrostatic pressure yield surface Pb(Eq.(23).) defines the
po-sition of the cap and dependent on the volumetric inelastic strain εin vol.
Eqs.(21) and (22)are modified accordingly in order to introduce the smoothing transition parameter α[22].
Pb¼ Pb εinvol
& '
ð24Þ By measuring the bulk density ρ of the tablet after ejection and dividing it with the initial density ρ0of the powder when filling the
die, the inelastic volumetric strains εin
volcan be calculated:
εin vol¼ ln ρρ 0 " # : ð25Þ 2.4. Tablet compaction
Calibrating the DPC model requires the preparation of tables in different manners. For obtaining the elastic and the cap properties, a fully instrumented press is necessary. For the shear failure line, a simple compaction press can be used, however, certain important aspects must be kept. According to Doremus et al.[32], for the diametrical compression test, it is important to ensure that failure arises from tensile fractures originating at the center of the specimen. To achieve this, the diametrical compression test must be carried out for tablets with aspect ratio H/D ≤
0.25, where H is the height and D is diameter of the specimen. For the axial compression test, in order to ensure the failure does not cross the two ends of the specimen, aspect ratio (H/D) of specimen must equal or larger than 2.0.
It is important to mention that the aspect ratios may vary for different materials and are only given as guidelines. Moreover, producing tablets with large heights may not sufficiently compact the powder to a solid dosage form, thus making it difficult to achieve large aspect ratios. Therefore, it is also necessary to observe and ensure that the desired failure path obtained.
2.4.1. Tablet compaction for elastic and cap properties
The die compaction cycles curves for different relative densities where obtained by a fully instrumented eccentric uniaxial press (Frogerais OA, France). The press is instrumented with five sensors that allow the measurement of the displacements of the upper and lower punches, the applied axial pressure σu, the transmitted axial
pressure to the lower punch σland the radial stress on the die wall σr.
The die used was a fixed cylindrical die of 11.28 mm of diameter and 10 mm of height. First, the upper punch is displaced downward, applying pressure on the powder and later the tablets are ejected out of the die by the lower punch. The tablets were prepared by automati-cally filling a powder mass of 0.305 ± 0.010 g into the die and
compacting different predefined set of displacements (4.5 to 7.4 mm) which corresponds to a set of maximum pressures (6 to 180 MPa), obtaining a range of relative densities (0.38 to 0.91). During the compaction process, the pressures and displacements of the upper and lower punches as well as the radial stress on the die were recorded. For each displacement set, a total of ten tablets were produced, disregarding the first and last tablets data and storing the mean values of the other eight tablets.
2.4.2. Tablet compaction for shear failure properties
The shear failure line parameters of cohesion d and friction angle β were calibrated using diametric and unconfined uniaxial compres-sion tests and utilizing Eqs.(17) and (18). In order to minimize the density gradient, the specimens for diametrical compression and uniaxial compression test were prepared by lubricating the die tooling. For diametrical compression test, cylindrical flat tablets were prepared by filling a powder mass of 0.350 ± 0.005 g into the die and compacting at seven different pressures (from 10 to 120 MPa), varying the compacted tablets thickness between 2.6 to 4.8 mm (resulting in rel-ative densities of 0.46 to 0.85). Tablets for the compression test where produced using a cylindrical die of 11.28 mm of diameter and 90 mm of height. The aspect ratio (H/D) of 2.0 was obtained by compacting the tab-let to a final height of 22 mm with varying the filling powder mass in order to obtain a range of 0.31 to 0.9 relative densities. For repeatability, in both cases, the mean of three measurements was used for each desired relative density.
2.5. FEM models
In this work, FEM is used to understand and predict the roll compac-tion process by obtaining the magnitudes and direccompac-tions of stresses, strains and velocities. The FEM models were solved as a steady-state problem using arbitrary Lagrangian–Eulerian (ALE) adaptive meshing in Abaqus/Explicit v6.14. The ALE adaptive mesh domain for steady-state problems is used to model material flowing through the mesh, consist of two Eulerian boundary regions (inflow and outflow), connected by Lagrangian or Sliding boundary regions[28]. An important aspect in solving steady-state problems is to follow the system and ensure reaching the steady–state condition. A history output for roll force and torque was obtained and plotted to validate the convergence. The density-dependent behavior described by the DPC model is imple-mented by an external user-defined VUSDFLD Fortran subroutine code. The inlet material density was set to be the tapped powder density as a result of the screw feeding. The Avicel PH 101 tapped density is about 0.47 g/cm3which corresponds to an initial relative density of 0.3.
First step in creating a Finite Elements (FE) model is to represent the geometry of the desired roll compactor. In the case of Gerteis Minipactor, the rolls diameter and width are 250 mm and 25 mm respectively and defined as analytic rigid surfaces. It is important to mention that the rolls here are smooth, rather than knurled in the experiment. Knurled rolls increases the complexity and the non-linearity of such simulations and are only represented by higher friction coefficient between the powder and the rolls. Once sketching the press dimensions, the region between the rolls is discretized and meshed using C3D8R three-dimensional continuum reduced integration elements. The smallest gap where the powder in contact under the rolls needs to be fixed and predefined as 1.5 mm gap. For the cheek plates case, two analytic rigid
side surfaces bounding the mesh between the rolls. For the rimmed-roll case, the rim with diameter of 275 mm is integrated with the bottom roll and defined as analytic rigid surface as well. The FE models for both roll compactor sealing systems designs are visualized inFig. 3. It is important to mention that due to the unsymmetry of the rimmed-roll sealing sys-tem assembly, both FE model's geometry was constructed fully without taking into account symmetry conditions, which are usually applied to reduce computational costs.
2.5.1. Powder-tools interaction
The ALE method enables working both with the advantages of Lagrangian and Eulerian elements in the same part[33]. While the inlet and outlet surfaces are defined as Eulerian regions, the upper and
lower surfaces that are in contact with the roll are defined as sliding surfaces. The contact between the rigid roll surface and the sliding surface defined as surface-to-surface with a given coulomb coefficient of friction μ. For numerical reasons, an ad hoc choice of constant friction coefficient was chosen. A value of μ=0.4 is the most representative single value obtained experimentally for a non lubricant case[12,17]. The surfaces representing the boundary in the feeding region are defined as Eulerian regions with zero displacement boundary condi-tions in normal direccondi-tions and spatial mesh constraint in all direccondi-tions. These Eulerian boundary conditions represent a sealing system with zero friction and therefore no shear forces applied on the powder in the feeding region. The surfaces representing the contact between pow-der and side seals/rim rolls are defined as sliding region with spatial mesh constraint in the tangential directions. The contact between the outer surfaces representing the powder and the sealing system are defined as surface-to-surface with the same given coulomb coefficient of friction μ=0.4.
2.5.2. Boundary conditions
In the roll compaction process, the inlet stress is dependent both on the screw and press dimensions and process parameters. In this work the inlet was simplified and defined as a constant feeding pressure of 0.2 MPa in order to obtain the desired 4 kN/cm roll separation force. As the cross section area, shape and position of the inflow boundary are measured directly from the roll compactor and known in advance, both the material and mesh constraints must be applied. The inlet and outlet nodes were constraint in the normal direction to avoid translation in the stream wise direction and maintain a steady uniform flow. In order to improve convergence to the steady-state solution, a linear constraint equation was implemented both for the inlet and outlet nodes, constraining the material velocity to be uniform normal to the outflow. A rotational boundary condition in z-direction was defined based on the roll rotating velocity in the experiment, which was set to 2 rpm. 2.6. Model validation: ribbon porosity measurement
Ribbon samples collected from the roll compaction were analyzed for relative density values. The 2.5 cm wide ribbons were sectioned into rectangular pieces of approximately 0.6 × 1 cm. The mass of each piece was determined with a high precision balance. The ribbon relative density (RD) requires both powder true density (ρtrue) and ribbon
enve-lope density (ρe). The envelope density of the ribbons was determined
using an envelope density analyzer (Geopyc 1360, Micromeritics Instru-ment Corp., Norcross, GA, USA). The internal diameter tube, consolida-tion force and conversion factor of 25.4 mm, 51 N and 0.5153 cm3/mm,
respectively were used. Once obtaining both the true and envelope
density, the sample's porosity (P) and the relative density can be expressed as follows:
RD ¼ 1−P ¼ ρe
ρtrue: ð26Þ
3. Results and discussion
3.1. Experimental calibration of DPC model
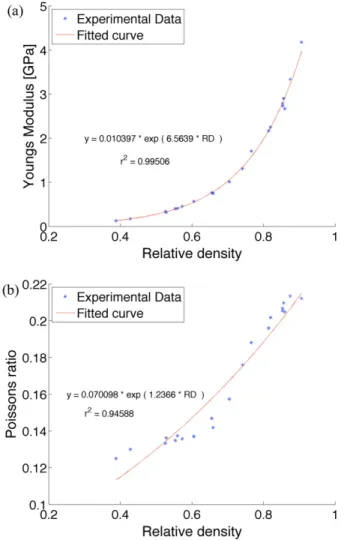
The Drucker–Prager Cap model parameters are plotted as a function of the relative density. The elastic properties obtained by analyzing the
die compaction unloading curves using Eqs.(12) and (10)are plotted in
Fig. 4. It can be seen the Young's Modulus is increasing exponentially from 0.08 to 7.4 GPa in the range between the filling bulk density and a full dense material. The Poisson's ratio does not show a decisive exponential behavior, having scatter values from 0.1 to 0.24 for the same range of relative densities. The cohesion and internal friction angle are obtained from nonlinear regression fittings of the diametrical and compressive tests and plotted for the desired relative densities which the DPC model was calibrated(Fig. 5.). As the Young's Modulus, the cohesion values increases exponentially with increasing relative den-sity. The internal friction angle shows a nonlinear behavior, with a slight decrease for low relative densities and larger for high relative densities.
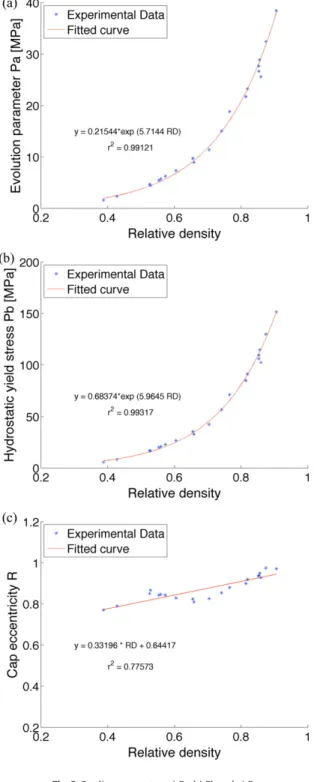
The Cap line evolution parameter Pa, hydrostatic compressive stress Pband the cap eccentricity R, which defines the shape of the cap are plotted against the relative densities(Fig. 6.). Following the definition in Eq.(24), the hydrostatic compressive stress Pb is plotted as a function of the volumetric plastic strains as well(Fig. 7.).
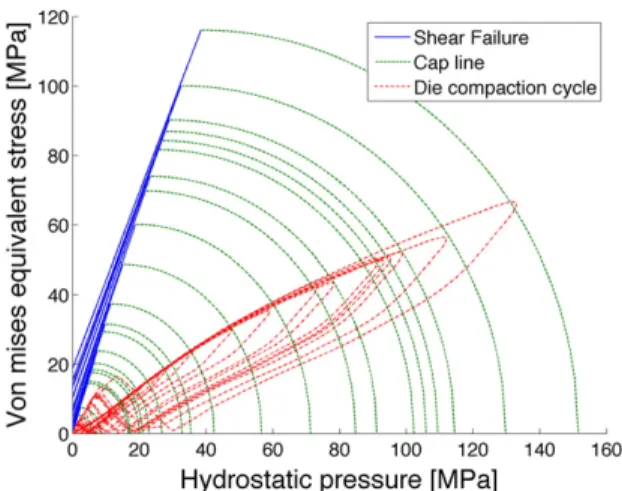
From the obtained results, the full DPC model is plotted with different isolines, representing each relative density(Fig. 8). With the increasing relative density, the yield surface (or line inFig. 8) expands in stress space. It can be seen that each shear failure line has a different slope and intersection with the equivalent stress axis, which are repre-sented by the density dependent internal friction angle and cohesion, respectively, plotted inFig. 5. The dotted lines are the die compaction curves in the p–q plane for different relative densities.
Most of the results show a clear and decisive exponential behavior which is used to extrapolate the DPC model for the low and high relative densities. However, some results such as the cohesion and the cap eccen-tricity did not show such behavior and may result in a non realistic
Fig. 9. Contact pressure between powder and upper roll for a) cheek plates and b) rimmed-roll. Fig. 8. Experimental iso-density Drucker–Prager Cap.
extrapolated data. The results show a similar behavior as in the literature which is mostly done for MCC 102 with one exceptional study on MCC 101[22].
3.2. Simulation results
Once reaching a steady-state solution by obtaining a constant relative density and vertical reaction force on the roll pin, the FEM results were analyzed. A typical FEM modeling calculates stresses, strains and velocities. Due to numerical reasons, the results are obtained and plotted only for the material which is still in contact with the roll, up to the narrowest gap region.[17]. In addition, in this work, a user-defined subroutine was implemented using a state variable of the relative density, ðRD ¼ RD0e−ε
p
vÞ which is calculate from the initial
bulk density, RD0and the volumetric plastic strain, εpv.
Comparing both cases of cheek plates and rimmed-roll assemblies, the upper roll contact pressure distribution is visualized inFig. 9. First, it can be seen that for both sealing system designs, the contact pressure increases with the rolling direction until reaching a maximum value just before the narrowest gap. The contact pressure varies between 25 to 37 MPa and 29 to 33 MPa along the ribbon's width for the cheek-plates and rimmed-roll assemblies, respectively. The state variable relative den-sity distribution of the powder between the rolls is visualized inFig. 10. The relative density varies between 0.59 to 0.64 and 0.60 to 0.62 along
the ribbon's width for the cheek-plates and rimmed-roll assemblies, respectively.
Results clearly show the effect of the cheek plates, causing a non-uniform roll pressure and density distribution with the highest values in the middle and the lowest in the edges. The powder was not adequate-ly and uniformadequate-ly delivered to the gripping and compaction zone. This occurred as the cheek plates preventing the powder flow and causes an uneven compaction across the ribbon's width, resulting in lower den-sification at the edges and higher at the middle of the produced ribbon. On the contrary to the cheek plates, the resultant pressure and density distribution with the rimmed-roll obtained higher values in the edges than in the middle and overall a more uniformly distributed. The rimmed-roll holds the powder mass and transporting it into the gripping zone between the rolls, protecting it from the adverse effect of the cheek plates. Additionally, The inner walls of the rims increase the contact area between the powder and the rolls, which increases the frictional drive in the edges.
3.3. Validation
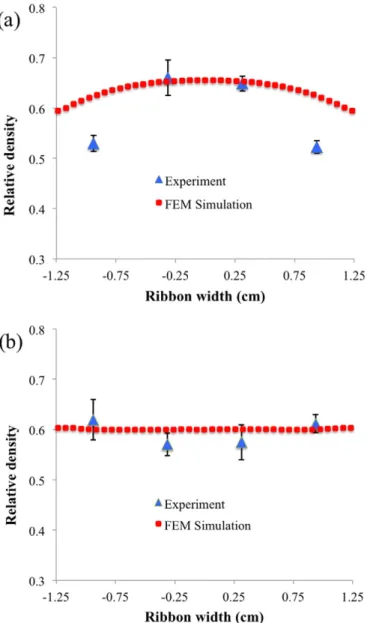
As mentioned previously (Section 1), the ribbon's density is one of the critical quality parameter of roll compaction process and therefore used for validating the FEM models. To verify the results, the simula-tions are compared with experimental measured values and plotted in
Fig. 11. The results show overall the same tendency as the experimental Fig. 10. Relative density for the two sealing systems a) cheek plates and b) rimmed-roll.
measurements with an overestimation of ribbon density on the sides for cheek plates sealing system. On the other hand, for the cheek plates' case, the results show agreement with the results obtained in the literature for different powder[17].
The difference between the FEM and experimental results for the cheek plates' case may be explained by the non constant nature of friction coefficient which has a direct impact on the density gradient. However, for high contact forces and relative densities, the friction coefficient tends to asymptote to a constant value[34]. The difference in results may also be explained by the loss of powder occurs in the roll compaction process, whereas the FEM model considers mass con-servation. The problem of leakage from the sides is especially significant for fine(d50=50μm) powders such as the MCC 101. Moreover, cheek
plates may also have a negative effect on the ribbon with fractured or in-complete compacted edges. Therefore, it can be noted that the ribbon's non-uniformity properties for the cheek plates sealing system was mostly dominant by the loss of powder from the sides, rather than the effect of wall friction.
4. Conclusions
In this work, a 3D Finite Elements Method (FEM) modeling is used to analyze the roll compaction process and the effect of sealing system
designs on the compacted ribbon's density distribution. The FEM simu-lation results clearly show the effect of the cheek plates, causing a non-uniform roll pressure and density distribution with the highest values in the middle and the lowest in the edges. Whereas, the resultant pressure and density distribution with the rimmed-roll obtained higher values in the edges than in the middle and overall a more uniformly distributed. The results show agreement with experimental measurements and present the same tendency as in the literature for different powders. The inconsistency between FEM and experimental results may be explained by the assumptions made in the FE models and considering a conservation of mass without loss of powder.
These results demonstrate the ability of FEM modeling to provide insight and better understanding of the roll compaction process. FEM modeling may also be used in improving the quality of ribbons with new designs.
Acknowledgments
This project has received funding from the European Union's Seventh Framework Programme for research, technological develop-ment and demonstration under grant agreedevelop-ment No. 316555. The au-thors would like to thank Prof. Peter Kleinebudde and Mrs. Ana Pérez Gago from Düsseldorf University for providing scientific, and technical support and recommendations using the Gerteis roll compactor. The authors also thank Dr. Gavin Reynolds and Dr. Andreja Mirtic from AstraZeneca,UK for giving access to the GeoPyc in order to validate this work.
References
[1] P. Kleinebudde, Roll compaction/dry granulation: pharmaceutical applications, Eur. J. Pharm. Biopharm. 58 (2004) 317–326,http://dx.doi.org/10.1016/j.ejpb.2004.04. 014.
[2] D.M. Parikh, Handbook of Pharmaceutical Granulation Technology, 1997 532,http:// dx.doi.org/10.1201/9780849354953.ch17.
[3] I. Akseli, S. Iyer, H.P. Lee, A.M. Cuitiño, A quantitative correlation of the effect of density distributions in roller-compacted ribbons on the mechanical properties of tablets using ultrasonics and X-ray tomography, AAPS PharmSciTech 12 (3) (2011) 834–853,http://dx.doi.org/10.1208/s12249-011-9640-z.
[4] A.M. Miguélez-Morán, C.Y. Wu, H. Dong, J.P.K. Seville, Characterisation of density distributions in roller-compacted ribbons using micro-indentation and X-ray micro-computed tomography, Eur. J. Pharm. Biopharm. 72 (1) (2009) 173–182,
http://dx.doi.org/10.1016/j.ejpb.2008.12.005.
[5] H. Lim, V.S. Dave, L. Kidder, E. Neil Lewis, R. Fahmy, S.W. Hoag, Assessment of the critical factors affecting the porosity of roller compacted ribbons and the feasibility of using NIR chemical imaging to evaluate the porosity distribution, Int. J. Pharm. 410 (1–2) (2011) 1–8,http://dx.doi.org/10.1016/j.ijpharm.2011.02.028. [6] M. Khorasani, J. Amigo, J. Sonnergaard, P. Olsen, P. Bertelsen, J. Rantanen, Visualization
and prediction of porosity in roller compacted ribbons with near-infrared chemical imaging (NIR-CI), J. Pharm. Biomed. Anal. 109 (2015) 11–17,http://dx.doi.org/10. 1016/j.jpba.2015.02.008.
[7] J.C. Cunningham, D. Winstead, A. Zavaliangos, Understanding variation in roller compaction through finite element-based process modeling, Comput. Chem. Eng. 34 (7) (2010) 1058–1071,http://dx.doi.org/10.1016/j.compchemeng.2010.04.008. [8] N. Souihi, G. Reynolds, P. Tajarobi, H. k. Wikström, G. Haeffler, M. Josefson, J. Trygg,
Roll compaction process modeling: transfer between equipment and impact of pro-cess parameters, Int. J. Pharm. 484 (2015) 192–206,http://dx.doi.org/10.1016/j. ijpharm.2015.02.042.
[9] S.E. Funakoshi, Y., Asogawa T., Use of a novel roller compactor with a concavo-convex roller pair to obtain uniform compaction pressure, Drug Dev. Ind. Pharm. 3 (6) (1977) 555–573.
[10] R.T. Dec, A. Zavaliangos, J.C. Cunningham, Comparison of various modeling methods for analysis of powder compaction in roller press, Powder Technol. 130 (2003) 265–271,http://dx.doi.org/10.1016/S0032-5910(02)00203–6.
[11]J.C. Cunningham, Experimental Studies and Modeling of the Roller Compaction of Pharmaceutical Powders, Strain(July) 2672005.
[12] A. Michrafy, H. Diarra, J.A. Dodds, M. Michrafy, L. Penazzi, Analysis of strain stress state in roller compaction process, Powder Technol. 208 (2011) 417–422,http:// dx.doi.org/10.1016/j.powtec.2010.08.037.
[13] J.R. Johanson, A rolling theory for granular solids, J. Appl. Mech. 32 (4) (1965) 842–848,http://dx.doi.org/10.1115/1.3627325.
[14] T.V. Karman, Contribution to the theory of rolling, Math. Mech. 5 (2) (1925) 139–141.
[15] V.P. Katashinskii, Analytical determination of specific pressure during the rolling of metal powders (In Russian), Sov. Powder Met. Ceram. 10 (6) (1986) 765–772.
[16] A. Michrafy, H. Diarra, J.A. Dodds, M. Michrafy, Experimental and numerical analyses of homogeneity over strip width in roll compaction, Powder Technol. 206 (1–2) (2011) 154–160,http://dx.doi.org/10.1016/j.powtec.2010.04.030.
[17] A.R. Muliadi, J.D. Litster, C.R. Wassgren, Validation of 3-D finite element analysis for predicting the density distribution of roll compacted pharmaceutical powder, Pow-der Technol. 237 (2013) 386–399,http://dx.doi.org/10.1016/j.powtec.2012.12.023. [18] W. Wang, A. Zavaliangos, J. C. Cunningham, The effect of side constraint in rolling compaction of powder, Proceedings of the 2003 International Conference on Powder Metallurgy and Particulate Materials.
[19]J.-H. Yoon, S.H. Jeong, Material properties and compressibility using Heckel and Kawakita Equation with commonly used pharmaceutical excipients, J. Pharm. Investig. 40 (4) (2010) 237–244.
[20] H. Hiestand, D. Smith, Indices of tableting performance, Powder Technol. 38 (2) (1984) 145–159,http://dx.doi.org/10.1016/0032–5910(84)80043–1.
[21] S. Helwany, Applied Soil Mechanics with ABAQUS, 2007.
[22] L.H. Han, J.a. Elliott, a.C. Bentham, a. Mills, G.E. Amidon, B.C. Hancock, A modified Drucker–Prager Cap model for die compaction simulation of pharmaceutical pow-ders, Int. J. Solids Struct. 45 (2008) 3088–3106,http://dx.doi.org/10.1016/j.ijsolstr. 2008.01.024.
[23] a. Michrafy, D. Ringenbacher, P. Tchoreloff, Modelling the compaction behaviour of powders: application to pharmaceutical powders, Powder Technol. 127 (2002) 257–266,http://dx.doi.org/10.1016/S0032-5910(02)00119–5.
[24] I. Sinka, J. Cunningham, a. Zavaliangos, The effect of wall friction in the compaction of pharmaceutical tablets with curved faces: a validation study of the Druckerâ €“Prager Cap model, Powder Technol. 133 (1–3) (2003) 33–43,http://dx.doi.org/ 10.1016/S0032-5910(03)00094–9.
[25] J.C. Cunningham, I.C. Sinka, a. Zavaliangos, Analysis of tablet compaction. I. Characterization of mechanical behavior of powder and powder/tooling friction, J. Pharm. Sci. 93 (8) (2004) 2022–2039,http://dx.doi.org/10.1002/jps.20110.
[26] K. Lamarche, D. Buckley, R. Hartley, F. Qian, S. Badawy, Assessing materials' tablet compaction properties using the Drucker –Prager Cap model, Powder Technol. 267 (2014) 208–220,http://dx.doi.org/10.1016/j.powtec.2014.06.050.
[27] A. Krok, M. Peciar, R. Fekete, Numerical investigation into the influence of the punch shape on the mechanical behavior of pharmaceutical powders during compaction, Particuologyhttp://dx.doi.org/10.1016/j.partic.2013.12.003.
[28] P. U. Dassault Systems, ABAQUS Documentation.
[29] B. Zhang, M. Jain, C. Zhao, M. Bruhis, R. Lawcock, K. Ly, Experimental calibration of density-dependent modified Drucker–Prager/Cap model using an instrumented cubic die for powder compact, Powder Technol. 204 (1) (2010) 27–41,http://dx. doi.org/10.1016/j.powtec.2010.07.003.
[30] J. Almanstötter, A modified Drucker–Prager Cap model for finite element simula-tion of doped tungsten powder compacsimula-tion, Int. J. Refract. Met. Hard Mater. 50 (2015) 290–297,http://dx.doi.org/10.1016/j.ijrmhm.2015.02.005.
[31] I. Aydin, B.J. Briscoe, K.Y. Åžanlitürk, The internal form of compacted ceramic compo-nents: a comparison of a finite element modelling with experiment, Powder Technol. 89 (3) (1996) 239–254,http://dx.doi.org/10.1016/S0032-5910(96)03188–9. [32] M.P. Doremus, J. Prado, Model Input data - Failure, Modelling of Powder Die
Com-paction, Springer-Verlag, London 2008, pp. 95–103,http://dx.doi.org/10.1007/ 978–1-84628-099-3.
[33] D.J. Benson, S. Okazawa, Contact in a multi-material Eulerian finite element formu-lation, Comput. Methods Appl. Mech. Eng. 193 (2004) 4277–4298,http://dx.doi.org/ 10.1016/j.cma.2003.12.061.
[34] a. Michrafy, J.a. Dodds, M.S. Kadiri, Wall friction in the compaction of pharmaceutical powders: measurement and effect on the density distribution, Powder Technol. 148 (1) (2004) 53–55,http://dx.doi.org/10.1016/j.powtec.2004.09.021.