an author's https://oatao.univ-toulouse.fr/21450
Graumer, Pierre and Bury, Yannick and Jamme, Stéphane and Douay, Christelle and Griffond, Jérôme and Haas, Jean-François and Souffland, Denis A new approach for the comprehensive study of a turbulent mixing zone induced by the Richtmyer-Meshkov instability. (2018) In: 16th International Workshop on the Physics of Compressible Turbulent Mixing, 16 July 2018 - 20 July 2018 (Marseille, France).
mixing zone induced by the Richtmyer Meshkov instability
P. Graumer, Y. Bury, S. Jamme, C. Douay
Institut Supérieur de l’Aéronautique et de l’Espace (ISAE-SUPAERO), Université de Toulouse
31055 Toulouse Cedex, France
J. Griffond, JF. Haas, D. Souffland
CEA, DAM, DIF, Arpajon F-91297, FranceAbstract
In this study we propose a new experimental and methodological approach dedicated to the analysis of the development of a turbulent mixing zone produced by the Richtmyer-Meshkov instability. A brief description of the experimental device dedicated to the generation of the initial interface is first presented. An overview of the main results obtained by means of strioscopic, Particle Image Velocimetry (PIV) and tomoscopic time-resolved measurements are then provided. The spatio-temporal evolution of the macroscopic scale based on the thickness of the mixing zone is discussed on the basis of the time-resolved Schlieren data. A first step into a more comprehensive analysis of finer, local scales of the flow is introduced, based on the qualitative analysis of the velocity and density fields during the development of the mixing zone.
I.
Introduction
A shock-tube experimental study of a Richtmyer-Meshkov instability (RMI)-induced turbulent mixing zone is proposed in this work. This instability occurs when interfaces between gases of different densities are impulsively accelerated. Here, we are interested in the description of its late phase of development. Many studies have been devoted to the analysis of the linear [1, 2, 3], then non linear development stages of such flows [4]. Nevertheless, the following phases, including subsequent interactions of a turbulent mixing zone with shock waves, are much less documented. The operational lack for an accurate control of the initial and boundary conditions and for the implementation of relevant measurement methods allowing the comprehensive study of these flows largely explains this gap. The present study addresses this challenge. We propose a new concept for the generation of these initial and boundary conditions which allows the combination of both a strong enough density contrast at the gaseous interface and a well-designed, repeatable spatial disturbance scheme, which should then ensure the turbulent transition of the flow within consistent timescales. To date, two main strategies have been tested to take up this challenge. Good examples of these techniques are given in the following references. On the one hand, Weber et al. [5] or Jacobs et al. [6] have developed devices without any physical separation of the two gases, based on a lateral coflow to minimize diffusion effects. The disturbance scheme is then produced by forcing the oscillation of the diffused interface at a specific frequency. On the other hand, Poggi et al. [7] or Bouzgarrou et al. [8] have used a very thin nitrocellulosic membrane separating the two gases and maintained between two grids whose meshes impose a supposely known periodic disturbance. These two strategies have partially met the objective of quantifying the development of the mixing zone in its late moments. But they still rise questions about the necessary determination and control of both initial and boundary conditions.
Authors et al.
The present study aims at developing a new experimental protocol able to promote a rapid transition of the flow scales to a turbulent state. This protocol is associated with an innovative experimental setup, based on multiple rotating shutter system, hereafter denoted MR2S. This setup relies on a membraneless system designed to strongly limit the initial molecular diffusion between the two gases. It also ensures a high degree of repeatability and allows for a comprehensive characterization of the initial conditions in a convenient way.
II.
Methods
i.
Experimental setup
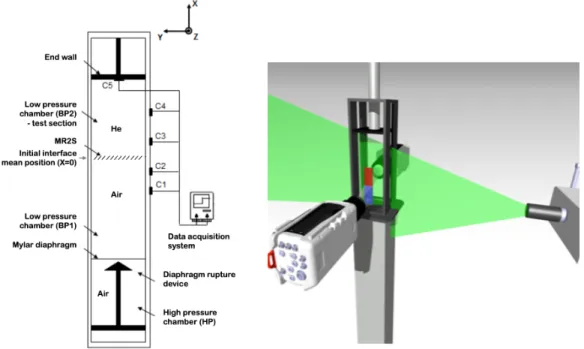
The experimental setup, sketched in Fig. 1, consists in a 5m long, 130mm square cross section vertical shock tube. For studies involving RMI and the resulting turbulent mixing, a shock wave (Mach number 1.2) travels upwards and crosses an air/helium interface, which sets the Atwood number to 0.76. The two gases are initially separated by the MR2S device, with the air located in the HP and BP1 regions while the test section BP2 is fully filled with helium (see Fig. 1) .
The length of the test section L can be varied up to 400 mm. All the experiments presented in this work are conducted with a test section length L=300 mm. The Mach 1.2 incident shock wave is generated by impacting a Mylar diaphragm, initially separating the driven (BP1, BP2, see Fig. 1) and the driver (High Pressure, HP) sections of the shock tube, using a cross-shaped sharp edges cutting device. The pressure in the driver section is controlled via a Keller pressure transmitter with an accuracy of 0.1% of the full range (0-3bars relative to the ambient pressure).
Figure 1: Schematic of the experimental test bench (left) and of the PIV measurement configurations (right).
ii.
Generation of the initial interface
The generation of a weakly diffused, periodic initial gaseous interface is ensured by multi rotating mini shutters in the form of series of parallel blinds of 130×λmm2rectangular shape, where λ is
the width of the blades. This results in a device made of 130/λ blades equally distributed along the whole width of the test section. Each blade can rotate around a central pivot corresponding to its axis of symmetry, according to an adaptable opening law. The pivot is located at X=0 mm which defines the mean position of the initial interface (Fig. 1). The inter-blade clearance is almost zero when the flaps are closed. However, the system is complemented with a retractable curtain, positioned just above the flaps when closed, in order to avoid any gas leakage from one side of the curtain to the other side during the preparation phases of the experiment. The total opening time of the MR2S device can be adjusted from a ratio of 1 down to 0.01 of the reference value of the opening time dtMR2S. This large range of opening times, and so of opening velocities, is of prime interest as it allows to generate varieties of initial conditions.
The generation of the shock wave is triggered by a dedicated synchronization system so that the travelling incident shock wave interacts with the initial gaseous interface just after the complete opening of the MR2S-blades. This synchronisation system also triggers the different diagnostic methods to be applied in order to characterize the mixing process at the moments of interest.
iii.
Diagnostics
Pressure histories of the flow in the shock tube are recorded using five flush-mounted piezoelectric pressure transducers spatially distributed along the test section (Fig. 1). For each experiment, the incident Mach number is determined via the detection of the shock wave by C1 and C2 pressure transducers located upstream of the MR2S device.
Two-component time-resolved PIV measurements (2C-Tr-PIV) were acquired in the central
(X, Y)plane (Z =0 mm) of the test section. Two sets of measurements were achieved at two distinct X locations of the measurement planes (depicted in Fig. 1 as a blue and red rectangle, respectively). The first set of measurements (corresponding to the blue rectangle location) aims at characterizing the initial gaseous interface during both the generation of the initial interface via the opening of the MR2S device, and the early instants of the development of the mixing zone induced by the interaction of the so-produced interface with the incident shock wave. The second set of PIV measurements (corresponding to the red rectangle location) provides information about the consecutive development of the mixing zone as it travels upwards in the test section, up to its interaction with the reflected shock wave.
The illumination source used to generate the laser sheet at the location of the measurement planes was a frequency-doubled, double-cavity Nd:YLF laser operating at a wavelength of 527nm (20mJ/150ns per pulse) and a tuneable pulse rate ranging from 100Hz to 10000Hz. Record-ing of particle image pairs was accomplished via two double-frame CCD fast imagRecord-ing cameras (Phantom V711) with a maximum sensor resolution of 1200×800 pixels2. The flow seeding, composed of 1.2 µm oil-based spherical particles, was ensured in the entire test section and on both sides of the initial interface. In the present investigation, the optimal time interval between the two laser pulses used for the determination of a velocity vector map was equal to 5µs. The frequency rate of the velocity field acquisition was fixed to 9000 Hz. Processing of the images to derive instantaneous velocity vector maps was done using an adaptive and deforming win-dowing cross-correlation technique combined with a high accuracy sub-pixel interpolation scheme. Time-resolved Schlieren visualizations were acquired to determine the integral, large-scale features relative to the dynamics of the mixing zone. Videos of the travelling shock wave, resulting series of compression/expansion waves and the mixing zone were recorded thanks to a high-speed Phantom V711 camera. The optical axis of the Schlieren testbench was chosen parallel to the
ro-Authors et al.
tation axis of the blades. The data rate of the image recording was fixed to 77000 images per second. To complement PIV and strioscopic measurements, planar laser tomoscopic images were also acquired in order to provide local details of the initial interface shape, and subsequent mixing zone inner patterns during the shock/reshock events through the determination of the instantaneous density fields. Note that similar-to-PIV settings were used for the tomoscopic measurements, except for the seeding procedure. Here only one species - in the present case the air - is seeded. Moreover the seeding density must be slightly increased in comparison to PIV, to guarantee homogeneous grey level fields of the seeded species. At last the frequency rate of the density field acquisition was fixed to 18000 Hz.
The characterization of the flow thus relies on the combined analysis of time-resolved flow visualizations and instantaneous density and velocity field measurements.
III.
Results
This section presents the evolution of the mixing zone, from the generation of the initial interface by the MR2S system up to the post-reshocked instants. In this paper we will only present results obtained for a total opening time of the blades of 21 ms.
i.
Initial conditions
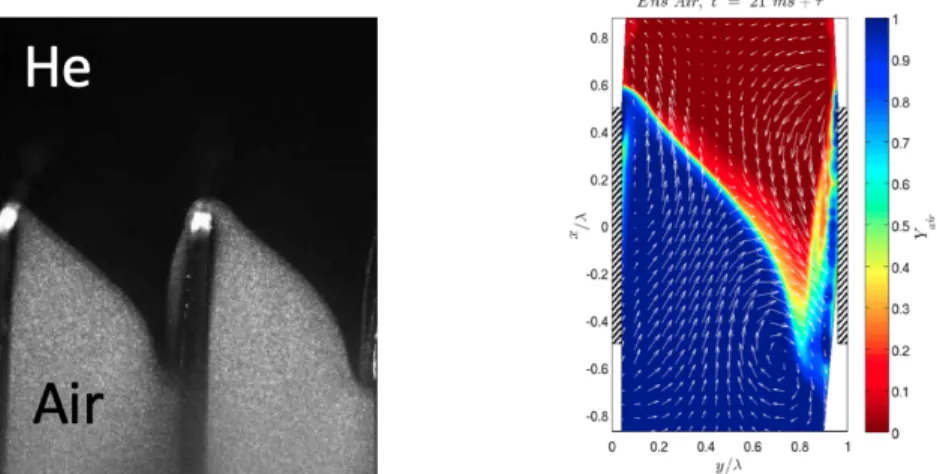
Fig. 2(left) depicts the shape of the interface obtained by means of tomoscopic measurements, 4ms after the complete opening of the blades. Fig. 2(right) illustrates the corresponding mass fraction field superimposed with the velocity field obtained from 2C-Tr-PIV measurements. Interestingly enough, these first results already reveal a weakly diffused interface which imposes a noticeable density gradient between air and helium. The obtained pattern also provides a complex interface deformation which is favorable to ensure a significant misalignment between local pressure and density gradients when the shock wave travels through the species interface. The concomitance of both this density gradient and the interface deformation is thus suitable for the promotion of baroclinic torque-induced vorticity which eventually results in the inception of the Richtmyer-Meshkov instability.
Thanks to this new interface generating device, it is demonstrated that the implementation of highly efficient experimental diagnostics is made possible and allows to fully characterize the initial flow conditions on the interface, as the necessary sets of flow variables are precisely determined. It is also important to mention that the pattern of this interface demonstrates to be well repeatable from one experiment to another. Finally the so-obtained experimental database can now be used as precise initial conditions serving the initialization and the validation of CFD predictive approaches.
ii.
Study of the mixing zone development
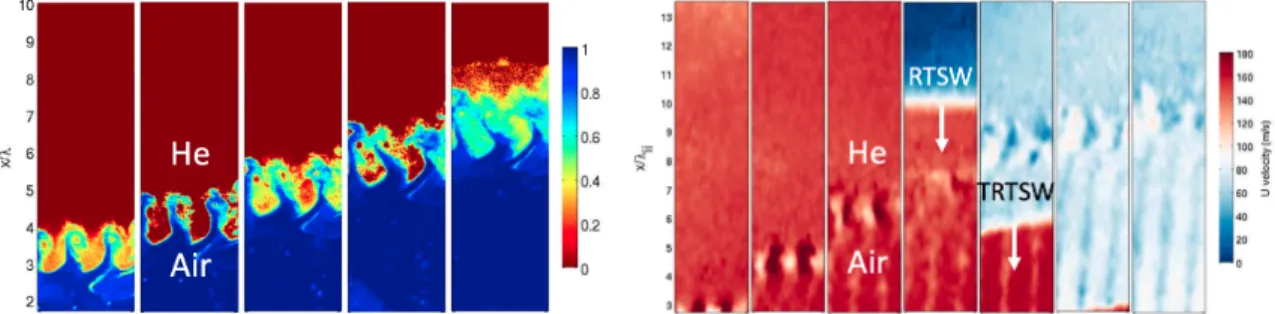
Fig. 3(left) illustrates the temporal evolution of the mixing zone obtained from time-resolved Schlieren images. The first two images clearly reveal the periodic pattern associated with the initial disturbance imposed by the MR2S device on the initial interface. The vortex sheddings arising from the blade wakes are also distinguishable just behind the mixing zone, on the lower part of the images. A few instants later (images 3 and 4), finer scale structures are also visible on the images, tending to indicate a transition of the flow towards a moderately turbulent state.
Figure 2: Raw tomoscopic image of the initial interface (left) and associated air mass fraction superimposed with the
velocity flow field (right) measured 4 ms (noted τ) after the complete opening of the blades. The rotation axis of the blades is oriented out-of-plane.
Further later, after the occurence of the reshock (image 5), still finer scale structures appear inside the mixing zone while its periodic large scale pattern tends to vanish as it is no more clearly visible on the image. This may reflect a strenghtening of the turbulent state of the mixing zone. The extraction of the spatio temporal evolution of the mixing zone frontiers (see Fig. 3(right)) from adequate post-processing of the Schlieren images, indicate a good matching of the mixing zone velocity in comparison with non-viscous theoretical models. At last the repetition of a large number of similar experiments (not depicted here for the sake of conciseness) confirmed the high level of repeatability of the experimental setup, of the generated initial conditions and of the resulting Richtmyer-Meshkov instability-induced flow.
Figure 3: Schlieren images of the temporal evolution (from left to right) of the mixing zone (left) and spatio-temporal
diagram of the mixing zone upper and lower frontiers based on image gradient detection criterion (right).
Fig. 4(left) shows the mass fraction fields for consecutive instants of the mixing process (from left to right). Fig. 4(right) depicts the associated velocity fields for similar moments between the incident chock/interface interaction and few instants after the rechock with the mixing zone. These results confirm the progressive occurrence of smaller density scales as well as the increase of velocity fluctuation levels inside the mixing zone. These instantaneous and local fields also prove to be highly repeatable from one experiment to another.
Authors et al.
Figure 4: Tomoscopic image-based mass fraction fields (left) and PIV-based velocity fields (right) obtained for consecutive
instants (from left to right) during the development process of the mixing zone.
iii.
Discussion
The analysis of the results shown in this paper clearly demonstrates the efficiency of this new concept of initial gaseous interface generation device to impose strictly repeatable initial and periodic boundary conditions. It also allows to implement advanced optical diagnostics which permit a precise quantification of the flow. In particular, all the necessary set of flow variables are now accessible and can be used to serve the validation of CFD predictive approaches as they provide a parametrization of the initial conditions, a well-defined periodicity for the boundary conditions and an in-depth analysis of the mixing.
At this stage a deeper analysis of the various scales and of their evolution as the mixing zone develops, then is reshocked, has to be conducted in order to better quantify the turbulent nature of the flow.
References
[1] R. D. Richtmyer (1960). Taylor instability in shock acceleration of compressible fluids. Commu-nications on Pure and Applied Mathematics, 13, 2, 297-319
[2] E. Meshkov (1969). Instability of the interface of two gases accelerated by a shock wave. Fluid Dynamics, 4, 5, 101-104
[3] M. Brouillette and B. Sturtevant (1994). Experiments on the Richtmyer Meshkov instability: single scale perturbations on a continuous interface. J. Fluid Mech., 263, 271-292
[4] B. Collins and J. Jacobs (2002). PLiF flow visualization and measurements of the Richtmyer-Meshkov instability of an air/SF6 interface. J. Fluid Mech., 464, 113-136
[5] C. Weber, N. Haehn, J. Oakley, D. Rothamer, and R. Bonazza (2012). Turbulent mixing measurements in the Richtmyer-Meshkov instability. Phys. Fluids, 24 (7) : 074105
[6] J.W. Jacobs, V.V. Krivets, V. Tsiklashvili and O. A. Likhachev (2013). Experiments on the Richtmyer-Meshkov instability with an imposed, random initial perturbation. Shock Waves, 23, 407-413
[7] F. Poggi, M.-H. Thorembey and G. Rodriguez (1998). Velocity measurements in turbulent gaseous mixtures induced by Richtmyer-Meshkov instability. Phys. Fluids, 10, 2698-2700 [8] G. Bouzgarrou, Y. Bury, S. Jamme, L. Joly, and J.-F. Haas (2014). Laser doppler velocimetry
measurements in turbulent gaseous mixing induced by the Richtmyer-Meshkov instability : statistical convergence issues and turbulence quantification. J. Fluids Eng., 136 (9) : 091209