The Messenger 128 – June 2007
Telescopes and Instrumentation
Towards Precision Photometry with FORS:
A Status Report
Wolfram Freudling, Palle Møller, Ferdinando Patat, Sabine Moehler, Martino Romaniello, Emmanuël Jehin, Kieran O’Brien, Carlo Izzo,
Eric Depagne, Emanuela Pompei, Dominique Naef, Gero Rupprecht, Arto Järvinen (all ESO)
The two FOcal Reducer and low-dis-persion Spectrographs (FORS) are the primary imaging instruments for the VLT. Because they are not direct imaging instruments, the accuracy of photometry which can routinely be obtained is limited by significant sky concentration and other effects. This article reports on the progress of a long-term project to improve the photometric calibration of the FORS instruments.
The calibration plan for the FORS instru-ments calls for observations of photo-meric standards in each clear night. The primary purpose of these observations is to monitor instrument performance. The same data are also used to calibrate science observations for programmes where 5 to 10 % photometric accuracy is sufficient. Two years ago we started the
FORS Absolute Photometry (FAP) project
13 to characterise the photometric
perform-ance of the FORS instruments and inves-tigate if and how the routine calibration of the instruments can be modified to offer improved photometric zero points (ZPs). An additional goal of this programme is to develop procedures to allow users to get more accurate photometric calibration. The results are available as two internal ESO reports, Møller et al. (2005) and Freudling et al. (2006). In this article, we present a brief overview of the issues re-lated to photometry with the FORS in-struments, and the current status of FAP. Our work has so far concentrated on the FORS1 camera, but the most of the findings will equally apply for FORS2.
Relative photometry with FORS1
Accurate photometry starts with reliable and stable flatfielding. We used the huge collection of twilight flats in the VLT archive to investigate the quality of the flatfields commonly used for the reduc-tion of FORS images. In order to investi-gate the stability of the flatfields, we computed the mean of bias-subtracted flatfields, and divided each individual frame by this mean. This removed the stable part of the flatfields. Visual
inspec-tion revealed that the structure in the flatfields consists of a temporally constant pattern, superimposed on large-scale fluctuations which rapidly change in time. The contrast of the constant pattern is higher in bluer bands. Interestingly, we found a correlation of some of the pat-terns with the adaptor rotator angle. The FORS instruments are mounted on adapter rotators which compensate for the sky-field rotation inherent to the VLT alt-azimuth mounting. Part of the struc-ture in the flat field rotates rigidly with the angle of the rotator. This is illustrated in Figure 1. This pattern in the flatfield must be external to FORS1 and might be due to reflections and/or asymmetric vignetting within the telescope or the adapter itself.
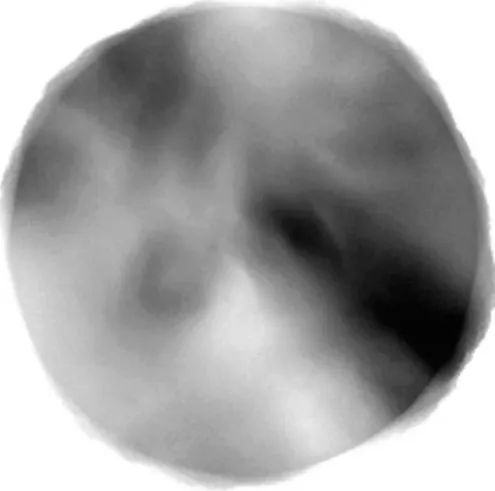
A high signal-to-noise version of the ro-tating structure is shown in Figure 2. This image was created by counter-rotating
B flatfields by an amount equal to the
ro-tator angle and then computing the me-dian of the rotated flatfields. If there was no correlation between the structure
Figure 1: A sequence of B FORS1 sky-flats divided by the median of all flatfields. The intensity scale range is 3 %. The rotator adapter angles (−105, −73, −35, 0, +30, and +70) are indicated by a blue arrow in the upper right corner.
14 The Messenger 128 – June 2007
in the flatfields and the rotator angle, then the structure of the individual flatfields should average out and the median would be smooth and flat. Instead the opposite can be seen in Figure 2. A finger-like pat-tern, which is already visible in the indi-vidual flats shown in Figure 1, stands out with increased signal-to-noise. This dem-onstrates that this is a rotating feature. The peak-to-peak amplitude of the pat-tern in the median frame is about 1%. In-spection of individual images in the stack shows that the amplitude varies substan-tially among the individual flatfields. Twilight flats, as routinely obtained each night, differ from each other by as much as 5 %. If such flatfields are applied to science data, the relative photometric ac-curacy is limited to about 5 %. Even when controlled for rotator angle, flatfields dif-fer from each other by an amount which questions the feasibility of per-cent-level photometric accuracy with FORS1. A key question is whether these fluctuations reflect true differences in the end-to-end throughput of FORS1. In that case, rel-ative and therefore absolute accuracy at the per cent level simply cannot be ob-tained with FORS1. A more likely explana-tion is that the flatfields are flawed and do not represent the throughput of FORS1. In that case, the task is to find the true flatfield which should be applied to data so that the photometric ZPs are constant over the whole detector.
We experimented with different proce-dures to remove the large-scale pattern from the raw observed flatfields. For the investigations described in the follow- ing sections, we used new observations to test the quality of the flatfields con-structed in this manner, and compared them to the regular “master flats” pro-duced by combining the routine twilight flats for that night.
The large variation in the flatfields was the motivation to take a closer look at possible variations of the ZP magnitudes across the detector when using the mas-ter flat. The goal was to derive a correc-tion for the master flats and to find a quantitative estimate of the accuracy of the finally adopted flatfield. For that pur-pose, we observed standard fields with a 25-point dither pattern which placed one relatively bright star on a grid of
po-sitions across the CCD. This approach is often nicknamed the “1000 points of light” approach. In addition, we took im-ages of the same fields rotating the whole frame.
Ideal data sets for calibrating images with suspected ZP variations across the de-tectors are fields which contain suitable photometric standards over the whole dithered region. We therefore selected re-gions within Stetson fields (Stetson, 2000, 2006) as our targets, which contain a large number of photometric standards suitable for 8-m-class telescopes. These fields proved to be useful for our pur-pose, and we will investigate whether all current FORS calibration fields can be replaced with appropriately selected point-ings within the Stetson calibration fields. The simplest and most direct way to in-vestigate relative ZP changes with dithered data is to compare the relative instrumental magnitudes of individu- al standard stars which are observed at positions all across the detectors. A much more sensitive method is to use the measured magnitudes of any star which has been observed at two or more different dither positions. Each individ- ual star might only provide relative ZP shifts for a few positions on the detector. By combining the information from many stars, the ZP variations over the whole detector can be reconstructed. We used singular value decomposition (SVD) to construct such an image of the ZP
varia-tions from our dithered observavaria-tions. The details of the formalism are described in Freudling et al. (2007). This image can then be used to correct the flatfield, or be applied as a second-order flatfielding step to the science data. The flatfield cor-rection frame for the R filter is shown in Figure 3. The peak-to-peak flatfielding error at the position of the observed stars is about 30 mmag. It should be empha-sised that the amplitude of the correction frame depends on the flatfield used to process the imaging data, and that the correction frame therefore only applies to that particular flatfield.
We tried several methods to remove the fluctuating and rotating features, described above, from the master flats before computing the correction frame. The most successful approach was to remove the large-scale pattern by divid-ing each flat-field by a smoothed version of itself. This procedure lowers the am-plitude of the necessary correction to the flat-fields derived from observations of standard stars, and therefore improves the overall flat-fielding.
So far we have derived flatfield correc-tions for three data sets taken more than two years apart. The overall shape and amplitude of the correction frames were stable over that period. We therefore conclude that the best flatfielding with FORS1 can be obtained by: (1) remov- ing large-scale features from the master flats; (2) applying a correction frame de-rived from observations of standard fields.
Absolute photometry with FORS1
Nightly ZPs for FORS instruments have so far been computed assuming a con-stant extinction for each night. The ex-tinction, however, varies substantially from night to night, even when the nights are photometric. Therefore, ZPs derived using a mean extinction depend on the airmass of the measured standard field and are not useful for accurate photom-etry. The true instrumental photometric ZP above the atmosphere, as derived from extrapolation of the extinction curves, probably varies much more slowly than the night-to-night variations of the extinc-tion. Therefore, better photometric ac-Telescopes and Instrumentation Freudling W. et al., Towards Precision Photometry with FORS: A Status Report
Figure 2: A stack of all B sky flats after applying a rotation around the geometrical centre with an amplitude equal to the adapter rotator angle. The intensity scale range is 1%.
15
The Messenger 128 – June 2007
curacy can be obtained by fitting the ex-tinction coefficients for several nights simultaneously, assuming that the instru-mental ZP does not change. Such a scheme can be included in the computa-tion of the flatfielding correccomputa-tion, so that a photometric solution is simultaneously obtained with the relative flatfield correc-tion.
The measured magnitudes of repeatedly observed stars can also be used to esti-mate short-term fluctuations in the extinc-tion during the night. Each of the more than 1000 individual stars observed with our dither pattern can be used for this purpose. When the weighted average of all stars is used, changes in the extinc-tion can be measured with an accuracy of about 1 mmag. An estimate of fluctua-tions in the extinction is an automatic by-product of the fitting procedure described above.
One of the tools to independently assess the quality of the night is the “VLT As-tronomical Site Monitor” (ASM) which can be accessed at http://archive.eso.org/
asm/ambient-server. We found that,
at least in the one photometric night used for FAP, the measured scatter of about 6.8 mmag is very similar to the flux rms measured by the ASM monitor. It is tempting to conclude that the rms from the ASM can be used as a proxy for expected rms fluctuations of the ZP. We plan to further investigate the useful- ness of the ASM to judge the photometric quality of the night.
Understanding the achievable accuracy of photometry requires understanding the total error budget. In particular, it is important to understand the accuracy of our procedures for flatfielding. We used the residuals of the extinction solution for a detailed investigation of the error esti-mates.
Measurement errors were computed for each measured magnitude from the read-out and Poisson noise, both for the pixels used to compute the stellar flux and for those used to estimate the local background. The error estimates range from 2 to 30 mmag. Errors in the listed standard magnitudes were taken from Stetson (2000) and Stetson (2006), which are based on repeated observations in
different nights. Above, we estimated that extinction fluctuations during the photo-metric night for this programme were ≈ 6.8 mmag. In Figure 4 we demonstrate that extinction variations, statistical errors and errors in the standard magnitudes account for most of the residuals of our photometric solution. A detailed analysis suggests an upper limit on residual flat-fielding and other sources of errors of about 3 mmag. This demonstrates that precision photometry with per-cent-level accuracy is indeed possible with FORS1. One of the important goals of this project is to define a set of guidelines on how to achieve a per-cent-level photometric
accuracy. The uncertainty in the photo-metric ZP is obviously an important factor which determines the final accuracy of the magnitudes. The FAP observations contain a large number of standard stars on each individual image, and the num-ber of calibration images is much larger than the number realistically taken for the calibration of normal science obser-vations. An important part of the photo-metric guidelines will therefore be to find the necessary minimum number of standard fields needed to achieve a cer-tain photometric accuracy.
FAP imaged four different Stetson fields
in a single photometric night, which were
Figure 3: R-band flatfield correction frame. 0 10 0 20 15 10 5 20 0 – 20 – 40 30 40 20 σm (mmag) V ar ia nc e (m m ag ) R es id ua ls (m m ag )
Figure 4: Upper panel: Residuals from the extinction solution as a function of the estimated magnitude error. The magnitude error includes the mea-surement error from the current obser-vations as well as estimated uncer-tainties for the magnitudes of standard stars. Lower panel: The variance of the residuals as a function of magni-tude error. The superimposed line is an error model, which includes statisti-cal errors as well as extinction fluctua-tions.
16 The Messenger 128 – June 2007
used to derive a photometric extinc- tion solution. The magnitude and colour range, and the consistency of derived ZPs is similar for all fields. To estimate the errors on the ZPs from sets of only two standard field observations, we recom-puted the ZPs from subsets of the FAP data. We used every combination of two standard fields which were taken with a difference in airmass of at least 0.7. The distribution of the resulting ZPs is shown in Figure 5. The distribution has an almost Gaussian peak but also a long non-Gaussian tail. In about 10 % of all cases, the errors on the resulting ZPs is larger than 3%. This shows that the observation of only two standard fields is insufficient to photometrically calibrate a night to per-cent-level accuracy.
We then repeated the experiment using three standard fields. At most one of the fields in each set was at an airmass less than 1.3, and the differences be-tween minimum and maximum airmass was larger than 0.7. The resulting distri-bution of ZPs is plotted in Figure 5. Also shown is a Gaussian with the same mean, standard deviation and normalisa-tion as the ZP distribunormalisa-tion. It can be seen that the distribution resembles closely a Gaussian with a standard deviation of 11 mmag. In contrast to the previous experiment with only two standard fields, all ZP errors are less than 3 %. This result strongly suggests that the use of three photometric standard fields, chosen with
the strategy outlined above, leads to an accuracy for the magnitude ZP of about 10 mmag.
The scatter in the ZPs also suggests that errors are almost Gaussian when three different standard fields are used. The er-ror budget discussed above implies that the dominant error on the mean magni-tude of all stars in any of the standard fields are fluctuations in the extinction, if the number of standard stars in each field is large enough and the exposures sample the airmass between 1 and 2 uni-formly. For a typical magnitude uncer-tainty of 10 mmag, about 30 or more standard stars per field are needed. This is one of the reasons to use the Stetson standard fields as opposed to fields with fewer stars with known magnitudes.
The past and future FORS1 photometric systems
In April 2007 FORS1 was upgraded with a new CCD mosaic and a new set of broad-band filters (see article on page 9). During February and March 2007 we therefore carried out an intensified ver-sion of our usual photometric calibration plan, where we employed all the tools and methods developed during the FAP. This data set includes dithers and rota-tions which makes it possible to derive flatfield corrections directly from the cali-bration data. The calicali-brations obtained
during those two months will therefore serve to determine the best possible, and final, photometric characterisation of the now retired system which has been used since the start of VLT operation.
This “Final Effort” on the retired FORS1 photometric system will also serve as a model for the design of our future FORS calibration plan. Our pilot programme has shown that per-cent-level photometry with FORS is indeed feasible. The key requirement for this is the ability to com-pute the flatfield corrections. In order to make this possible for a large number of programmes, those corrections must be determined directly from the calibra-tion plan data, which in turn places more demands on our calibration plan. In par-ticular there needs to be a large number of moderately faint standards in each field. We are currently investigating whether appropriate regions for this purpose can be found within the Stetson standard fields. Using these fields will therefore require that we measure U-Band magni-tudes for the standards in those fields. (Stetson, 2006).
FAP has shown that it is possible to
achieve per-cent-level photometry with FORS1 with moderate effort. Over the next year, we plan to prepare new photometric standard fields suitable to obtain more accurate photometric solutions and simultaneously derive flatfield corrections. If this programme proves to be successful, we plan to incorporate new flatfielding algorithms into the FORS pipeline.
References
Freudling W. et al. 2006, “The FORS Absolute Photometry Project”, VLT-TRE-ESO-13100-4006 Freudling W. et al. 2007, in “The Future of Photo- metric, Spectrophotometric, and Polarimetric
Standardization”, ed. C. Sterken, ASP Conference Series 364, 113
Møller P. et al. 2005, “FORS: An assessment of ob- tainable photometric accuracy and outline of
strategy for improvement (FORS IOT Secondary Standards Working Group)”, VLT-TRE-ESO-13100-3808
Stetson P. B. 2000, PASP 112, 925
Stetson P. B. 2006, fields listed at http://cadcwww.
dao.nrc.ca/cadcbin/wdbi.cgi/astrocat/stetson/ query
Telescopes and Instrumentation Freudling W. et al., Towards Precision Photometry with FORS: A Status Report
27.4 27.5 mz 30 20 10 0 N
Figure 5: Distributions of zero points determined from two and three stand-ard observations (red and blue histo-grams respectively). The dashed line is a Gaussian with a s of 11 mmag.