PROCEEDINGS OF ECOS 2018 - THE 31ST INTERNATIONAL CONFERENCE ON
EFFICIENCY, COST, OPTIMIZATION, SIMULATION AND ENVIRONMENTAL IMPACT OF ENERGY SYSTEMS JUNE 17-22, 2018, GUIMARÃES, PORTUGAL
Techno-economic assessment of high renewable
energy source penetration in the Bolivian
interconnected electric system
Ray Antonio Rojas Candiaa, Joseph Adhemar Araoz Ramosa, Sergio Luis Balderrama Subietaa,b, Jenny Gabriela Peña Balderramaa, Vicente Senosiainc and Sylvain
Quoilinb,d
a University Mayor de San Simon, Cochabamba, Bolivia b University of Liege, Energy System Research Unit, Belgium
c University Publica de Navarra, Navarra, España d KU Leuven, Department of Mechanical Engineering, Belgium
* Corresponding author: squoilin@uliege.be.
Abstract
To reduce GHG emissions to reach the 2°C level, the International Energy Agency, projected that electricity generation based in renewable source should increase from 3% today to more than 20% by 2040 [1]. This transition to carbon-free and sustainable energy systems is a challenge for every country and particularly for developing countries. Lack of economic and technical resources has historically been a barrier for the transition into a low-carbon energy system. Under this context, the Bolivian government plans significant investments in renewable energy projects before 2025. Deployment of large hydro-power, small-scale wind and solar projects are foreseen in the investment agenda. However and despite the large solar capabilities of the country, solar technology is not yet considered to be a main source in the supply chain. The aim of this article is to evaluate the flexibility of the Bolivian power generation system in terms of energy balancing, electricity generation costs and power plants scheduling in a scenario that considers large solar energy technology deployment. This is done using an open source unit commitment and optimal dispatch model (Dispa-Set) developed by the Joint Research Center. National data for existing infrastructure, committed and planned energy projects are inserted to assess case of Bolivia. The base scenario consider all techno-economic data of the Bolivian power system up to 2016. Further scenarios investigate different levels of solar energy deployment. Results from the analysis show that an energy mix with participation of solar technology with values lower than 30 % seems technically feasible but thermal generation is required to follow variations of renewable sources and prevent load shedding.
Keywords:
Bolivia, Electricity cost, Energy balance, Power plant dispatching, Solar energy.
1. Introduction
Since the entry in force of the Kyoto protocol, the presence of Renewable Energy Sources (RES) in power systems worldwide has increased, the variability of these sources (e.g. wind and solar) is a challenge for the grids where they are installed and requires ramping capacity from thermal units, storage capacity (principally of hydro pumping stations), grid interconnections and demand side management [2]. The knowledge of how electric grids could react to higher penetration of renewable sources is required for a future expansion planning of the park.
The current evolution of the Bolivian power grid named Nacional Interconnected System (Sistema Interconectado Nacional, SIN) somewhat opposite to the global trend towards RES. Historically, SIN has been a Hydro-thermal system due the important hydric resources of the amazon basin and to the large natural gas reserves; currently thermal generation represents the main primary energy source with 71 % of the total installed capacity, Qollpana wind park is the only non-hydro renewable energy source and corresponds to only 1.3 % of the total generation in 2016 [3]. In the last years Bolivian electricity consumption has increased significantly, between 2000 and 2012 the demand have increased by 52 % [4], between 2012 and 2016 has increased by 30 % [5], and it is estimated that it
should increase by an additional 46% by the year 2021 [3]. The present study aims at evaluating if SIN can cope with current and future demand including a high percentage of solar energy. For that purpose different tools are available, e.g. to evaluate the power systems flexibility by resolving the unit commitment and optimal dispatch problem (UC/D). In [6] for example, the effects of wind energy in the German power grid is evaluated with a long- and short-term modelling approach; a soft linking methodology is developed, requiring detailed modeling of the unit commitment and dispatch of the electrical power systems [7]. The Bolivian system operator named National freight forwarding committee (Comité Nacional de Despacho de Carga, CNDC) uses the PSR software to program power plants dispatching [8] but this tool primarily developed for hydro-thermal systems [9] and does not evaluate long-term scenarios with high penetration of renewable resources. To fulfill that purpose the Dispa-SET model [10] has been chosen, this tool uses historical hourly data of demand and renewable source with specific techno-economic data of all generation units to minimize the system operational cost and the dispatch in a medium-term time horizon. Given high solar potential of Bolivia this work focuses on the evaluation of the impact of a large deployment of solar photovoltaic generation in terms of energy generation cost, energy balance and dispatch of power plants.
For the purpose of the simulation, all the required technical data related to power plants, load, renewable resource data are collected from various sources and used to define scenarios for the years 2016 and 2021. These scenarios are subject to different levels of solar photovoltaic generation and different hypotheses regarding natural gas prices. The first one considers the price of natural gas (regulated by the Bolivian government) and the second one the international price of natural gas.
2. An assessment framework for the Bolivian electric system
2.1. Case study definition
Bolivia depends primarily on natural gas as a primary energy source. In the year 2000, natural gas accounted for 57 % of the primary energy; in 2010 this percentage rose to 80 % as a result of a significant growth in natural gas production of 291 %; during the period 2000-2010, the production of non-renewable energy increased by 208 % while renewable energy grew by only 21 % [11]. The Bolivian electric power matrix is constituted by the National Interconnected System (SIN), which provides electricity to the main cities of the country and the Isolated Systems (SA) that supply the smaller and distant cities of the trunk axis.
2.1.1. Bolivian Interconnected System
The SIN consists of generation, transmission and distribution facilities that operate in a coordinated manner electricity supply and consumption of the departments of La Paz, Oruro, Cochabamba, Santa Cruz, Beni, Potosí, Chuquisaca and Tarija, which represents approximately 96 % of the national demand [3]. The SIN can be divided into well-defined areas: North (La Paz and Beni), Oriental (Santa Cruz), Central (Oruro and Cochabamba) and Sur (Potosí and Chuquisaca). The Interconnection Trunk System (Sistema Troncal de Interconexión, STI) is the part of SIN that includes the high voltage transmission system in 230, 115 and 69 kV. The SIN generation park is made up of hydroelectric power plants, thermoelectric plants and wind turbines. The hydroelectric park consists of run-of-river power plants (Zongo, Taquesi, Yura and Quehata), reservoir plants (Corani, Miguillas and San Jacinto) and a power plant whose operation depends on the supply of drinking water in Cochabamba city (Kanata). The thermoelectric park is composed of open-cycle natural gas turbines, steam turbines that operate with sugarcane bagasse (Guabira and Unagro), natural gas engines (Aranjuez MG) and Dual Fuel units (Aranjuez DF) that use natural gas and diesel oil, a combined cycle steam turbine that uses the exhaust gases of 2 natural gas turbines in Guaracachi central, diesel engines oíl in Moxos central and wind turbines in Qollpana wind central [3].
SIN generation capacity during the year 2016 reached a value of 1,854.76 MW installed, of which 483.2 MW (26.1 %) correspond to hydroelectric plants, 1,314.6 MW (70.9 %) to thermoelectric plants, 27 MW (1.4 %) correspond to the Qollpana wind farm and 30.0 MW (1.6 %) correspond to plants that operate with biomass [3].
2.1.2. Electric demand
The demand is divided into regulated consumers, mostly residential, who are served by distribution companies and by unregulated or large consumers. Ten distribution companies participate in Bolivian electric Market1. Non-Regulated Consumers are great industrial enterprises that directly participate in electric market2. In recent years, the demand has experienced a strong growth:, in 2000-2006 period an average growth rate of 4 % was registered reaching 6259 GWh, in 2006-2012 the increase rate was 9 % with 7138 GWh for the year 2012 [4]; in 2016 a total consumption reached 8378 GWh and for the year 2021 a consumption of 12421 GWh is foreseen [3].
2.1.3. Solar potential
In particular case of Bolivia, high levels of radiation are present in a large part of the country, almost 97 % of the territory is suitable for the use of solar energy [12]. The Bolivian solar radiation atlas [13] provides the temporal and spatial distribution of the global radiation in the country; as seen in Fig. 1 Bolivia northeastern side, from the eastern mountain range, presents the lowest values of global radiation, between 3.9-5.1 kW-h/m2-day, while towards southwest area solar radiation increases with values between 5.1-7.2 kW-h/m2-day. [13-14].
Fig. 1. Distribution of global solar radiation in Bolivian territory (annual average): extracted from [13].
2.2. Model description
The opens source Dispa-SET model is developed at the Joint Research Center focus on the short-term operation of large-scale energy systems by solving the unit commitment and energy dispatch problem (UC / D). It considering that the system is managed by a central operator that has all the technical and economic information of each plant and the demand in each node in the transmission network [15].
1 CRE and EMDEECRUZ in Santa Cruz, DELAPAZ in La Paz, ELFEC in Cochabamba, ELFEO in Oruro, CESSA in
Chuquisaca, SEPSA in Potosí, ENDE DELBENI in Beni, ENDE in Potosí (Uyuni) and SETAR in Tarija.
2 Metallurgical Company Vinto, Coboce, Mining Company Inti Raymi and Mining Company San Cristóbal [3]. This
consumption is distributed mainly in the Eastern (Santa Cruz) areas with 36.8 %, North with 23.4 % (La Paz 21.6 % and Beni 1.8 %) and the rest of the SIN with 39.8 %.
The aforementioned UC/D problem is solved by mixed integer linear programming (MILP) in GAMS [16] and consists of 2 parts: First, start programming, the operation, and the output of the available generation units. Second, distribution of the total energy demand among the generating units available in such a way that generation costs are minimized [10]. The goal of the unit commitment problem is to minimize the total power system costs which are defined as the sum of different cost items, namely: start-up and shut-down, fixed, variable, ramping, transmission-related and load shedding (voluntary and involuntary). A detailed description of the model and its constraints can be found in [17] but its main characteristics can be summarized as follows [2]:
Minimum and maximum power for each unit Power plant ramping limits
Reserves up and down Minimum up/down times Load Shedding
Curtailment
Pumped-hydro storage
Non-dispatchable units (e.g. wind turbines, run-of-river, etc.) Start-up, ramping and no-load costs
Multi-nodes with capacity constraints on the lines (congestion) Constraints on the targets for renewables and/or CO2 emissions Yearly schedules for the outages (forced and planned) of each units.
2.3. Data description
The Dispa-SET model requires a large amount of data which has been gathered from different sources described hereunder.
2.3.1. Time series
Historical one hour data for a one year period (8784 time slices) was be taken from operation results of the Bolivian operator CNDC including: load data [18]; power plants outages [19]; hydro reservoirs storage and water inflows [20-21] the two later sources are used to define the scaled inflows time series by the tool.
Solar availability factor time series are obtained from global horizontal radiation models using geographic location, environmental features and monthly average solar radiation data of Bolivian solar map [13-14]. Availability factor for wind sources are generated from annual average wind velocity of Bolivian Wind Atlas [22], from the technical features of already installed wind turbines and from the historical power injection data from CNDC.
Regarding fuel costs, a value of 3.55 €/MWh [8] is taken as average price of natural gas since this is price is regulated by Bolivian government for thermoelectric generation. The price of diesel is 4.25 €/MWh, which is the value used in the Optimal plan for expansion of the SIN (Plan óptimo de expansion del SIN, POES) [8]. Sugarcane pellets prices are taken as 12.5 €/MWh corresponding to the market prices of biomass thermoelectric generation in South America.
2.3.2. Power plants Data
Other specific data must to be provided for every one of 140 power plants installed into the SIN. Units are disaggregated by type of fuel, there are 53 hydroelectric units with 483.22 MW capacity installed, 1344.55 MW capacity is desegregated between 77 thermoelectric units of which 21 work with diesel fuel, 3 use biomass from sugarcane peel, 3 work with natural gas as combined cycle and the rest work with natural gas as simple gas turbine. Finally there are 10 wind turbines, for a total capacity of 27 MW corresponding to the entirety of the RES capacity in 2016 [5-3] if biomass is excluded. Technical data include the type of power plant, efficiency, ramp up/down rate, startup time, minimum load and CO2 intensity. Efficiency and minimum load value was assigned according to the
power plant type from [8]. Ramp up/down rate and startup time have be estimated from historical operation data from Bolivian operator. Since no exact values are available for CO2 emissions in each unit, they are estimated according to power size, In any case, their impact is null on for the present simulation since no CO2 pricing scheme is available in the current Bolivian regulations. Table 1 shows the main parameters used in all scenarios, the fuel prices correspond to regulated values.
Table 1. Main inputs for the model.
Technology Installed capacity, MW Efficiency, % Fuel cost, €/MWh Total CO2 emissions, TCO2/MWh Ramp up/down rate, %/min O&M costs, €/MWh
Natural gas turbine 1093.05 30.6 3.55 0.64 0.80 4.64 Diesel gas turbine 28.58 30.6 4.24 0.25 0.20 4.64 Combined cycle gas turbine 192.92 54.56 3.55 0.31 0.08 5.68 Biomass gas turbine 30.00 30.6 12.5 0 0.20 4.64 Hydro dam 483.22 85.0 0 0 0.15 0.05 Wind on shore 27.00 92.0 0 0 0.33 5.42 Photovoltaic According scenario 100 0 0 0.63 0.01
2.4. Scenarios
As already mentioned, natural gas price for thermoelectric generation is subsidized by the Bolivian government this makes thermal units competitive against RES. For that reason, two hypotheses are considered for gas prices: subsidized prices and international (9.79 €/MWh).
2.4.1. Reference scenario
The reference scenario correspond to the actual state of the Bolivian Power system in 2016, at this year it can be seen a notable predominance of the conventional energy sources (hydro and thermal) against a very small percentage of wind generation and none to solar PV generation. The total power capacity installed is 1854.76 MW, of which 58.5 % correspond to gas turbines, 10.5 % to combined cycle gas turbines, 1.9 % to diesel turbines, 1.6 % to biomass gas turbine; 26.1 % to hydro, and only 1.5 % of RES wind penetration [3]. The total demand is 8377.8 GWh.
2.4.2. Energy photovoltaic solar penetration scenarios at 2016
Given the lack of contribution of solar energy in the Bolivian power system and the grate potentiality of solar energy generation throughout the country, high shares of solar power penetration is simulated at 2016. 10 %, 20 %, 30 %, 40 % and 50 % of total power capacity installed is met by solar photovoltaic solar plants. Central zone of SIN is took to localizing solar parks at Oruro department since this is the zone with the highest radiation levels. In addition this central zone is directly connected to each other areas (North, South and Oriental zones), so that the energy can be dispatched to others zones with lower lost amounts.
2.4.3. Energy photovoltaic solar penetration scenarios at 2021
For 2021 the electric demand is predicted to increase up to 12421 GWh. To meet this demand the government has planned the construction of new thermal and hydraulic power plants, which can provide the system with the flexibility to increase the participation of renewable solar sources even more. According to the POES the following generation capacity increase is foreseen that year: thermal 284 MW, hydro 450 MW, wind 136 MW and solar PV 170 MW (6 % of total capacity installed at 2021) [8]. With these data future scenarios are simulated with high photovoltaic power capacity, 10 %, 25 %, 30 %, and 40 % of total power capacity installed. The time series of 2016 scenario are conserved to run 2021 simulation and are up scaled when necessary.
3. Results
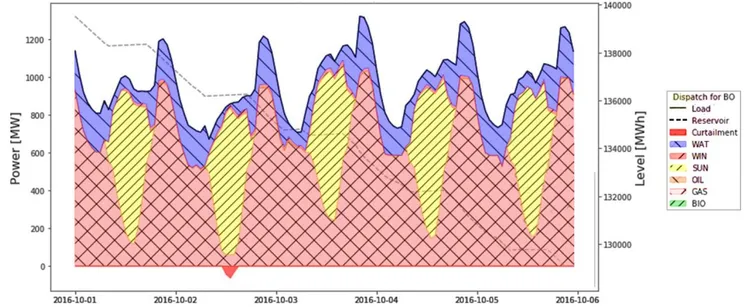
Figure 2 shows a sample of the energy dispatch in the base scenario for five days of Bolivian electric consumption, it clearly shows the dominance of thermal and hydro generation in the system, with a small participation of wind.
Fig. 2. Energy dispatch results of Bolivian Interconnected System at October of 2016. The main result for the reference scenario and different penetration of solar PV are summarized in table 2. The load could be satisfied during all the year despite the amount of outages, 40 units were offline for more than 30 days, 14 units for more than 100 days and another 6 units for more than 300 days.
Results show that there is currently enough flexibility to accept integrate a significant percentage of solar generation. The main limitation is the energy curtailment. With 30 % solar PV penetration (800 MW installed) around of 29.5 MWh throughout the year (see Table 2 and Figure 3) are curtailed. With higher percentage of solar energy installed the curtailment increases considerably: 490 MWh for 40 % and 1630 MWh for 50 % of solar energy penetration.
Table 2. Dispatching results of base scenario and different levels of high solar energy penetration scenarios through year 2016.
Solar in installed capacity, %/MW Covered Load, % Total load, TWh Curtailment, TWh Load shedding, % Thermal generation displaced, TWh
Average electricity cost, €/MWh Wellhead natural gas price International gas natural price 0/0 0.0 8.4634 0.0000 0 0 13.2 28.4 10/190 4.6 8.4634 0.0000 0 0.39 13.1 27.8 20/470 15.7 8.4634 0.0009 0 1.25 11.8 24.4 30/800 19.6 8.4634 0.0295 0 1.74 11.1 22.4 40/1250 31.0 8.4634 0.4903 0 2.31 10.3 20.4 50/1860 34.6 8.4634 1.6301 0 2.63 10.1 19.4
The percentage of load that is covered with solar energy translates into displaced thermal generation. 800 MW of solar energy installed could meet 19.6 % of total Bolivian consumption i.e. 1.7 TWh from natural gas turbines were avoided, corresponding to almost 15 million of TCO2.
Fig. 3. Energy dispatch results with 30 % of solar photovoltaic energy penetration in the Bolivian Interconnected System at October of 2016.
High levels of solar energy also affect the average price of energy generation, at table 2 for 30 % of solar energy penetration, it can be seen that the average electricity cost could be reduced by 16 %. It is however important to note that these are operational costs only, i.e. not taking into account investment. If international natural gas prices are considered this reduction increases to 21 %. This clearly shows that solar energy could be more competitive if the governmental subsidy gas prices gas is withdrawn.
Results of different scenarios at 2021 are summarized at table 3. It reveals a considerable amount of energy curtailment already with a presence of 30 % (1170 MWh) of penetration.
Table 3. Dispatching results of different levels of high solar energy penetration scenarios through year 2021. Solar in installed capacity, %/MW Covered Load, % Total load, TWh Curtailment, TWh Load shedding, % Thermal generation displaced, TWh 6/170 2.41 12.44 0.00 0.00 0 10/306 5.22 12.44 0.00 0.00 0.32 25/910 16.88 12.44 0.00 0.00 1.65 30/1170 21.71 12.44 0.00 0.00 2.25 40/1820 30.54 12.44 0.49 0.00 3.05
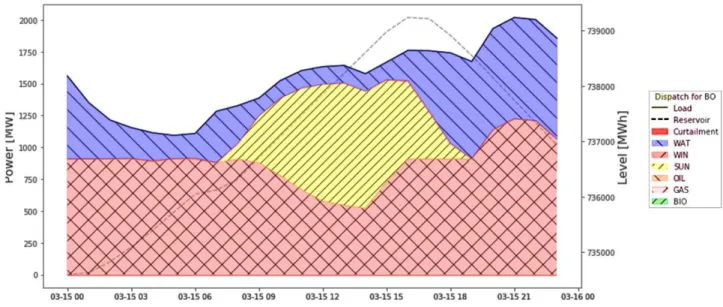
The consumption and generation curves also show a certain compatibility between the Bolivian load and the solar generation (see Fig. 4) peak solar generation is produced around 12:00 and 14:00 PM, this is useful to cover an increase in the load that begins precisely at that time, although the peak load is around 19:00 and 21:00 hours. Between October and December this trend is accentuated and beneficial for the system. The opposite happens between February and April months, where hydraulic storage levels increase (see Fig. 5) as well as high levels of radiation occur, during this period, higher curtailment levels are also stated. No energy curtailment occurs between May and September which coincides with winter period and lower levels of solar radiation.
Fig. 4. Energy balance results for a March day at 2021 with 30 % of solar photovoltaic energy penetration in the Bolivian Interconnected System.
Figure 5 shows the evolution of the energy storage levels of the hydro dam reservoirs throughout the year. It should be note at winter months of Bolivia (June, July and August) hydraulic reservoirs level decreases for that reason the participation of hydraulic units in the energy balance is less in this months.
Fig. 5. Hydro energy storage level evolution of SIN during 2016 year.
4. Conclusions and considerations
A techno-economic evaluation of the Bolivian electricity system was carried out using an open source tool called Dispa-SET. The whole model and the input data are also released as open-source, thus ensuring a proper reproducibility and re-usability of this work [23].
Simulation results for 2016 show that the system has enough flexibility to accept between 25-30 % penetrations of PV solar energy without presenting problems. Similar results were found in the analyses carried out for the year 2021. Because the Bolivian power system did not undergo significant changes since 2016 it can be concluded that currently at least 470 MWh from solar resources could be introduced without any issue. In the same manner, governmental plans for new conventional power plants by 2021 favor greater participation of solar energy for that year, providing the system with enough flexibility to install up to 900 MW of power from photovoltaic plants.
The renewable sources tends to lower the prices of electricity generation, but in the Bolivian case only marginally noticeable due to the government subsidy for natural gas. This makes renewable solar energy less competitive in the Bolivian context. The simulation results using a higher price for gas, such as the international price, show a greater potential for price reduction.
The energy balance through a year shows a certain complementary between load and solar energy generation. There is an increase in the Bolivian electricity consumption that coincides with the hours of highest solar generation, this contributes to lower the energy curtailment, favoring a higher percentage of solar penetration in the system.
It should be noted that, historical radiation data from year 2016 have been used in the different proposed scenarios in a deterministic way, to obtain more accurate results, uncertainty and forecasting should be taken into account. This will be the object of future work. Finally generic techno-economic values were used, e.g. to understand the effect of gas prices. More accurate scenarios with specific data will be carried out in future works.
References
[1] IEA, Energy and Climate Change. Paris: OECD/IEA; 2015. World Energy Outlook Special Report.
[2] Quoilin S, Gonzalez IH, Zucker A, Thiel C. Available technical flexibility for balancing variable renewable energy sources : case study in Belgium. 2016; (January 2014):1–11.
[3] CNDC, Memoria 2016 Resultados de la Operación del SIN. Cochabamba: Ministerio de Energías, Estado Plurinacional de Bolivia, Comité Nacional de Despacho de Carga; 2016. Anual Report 2016.
[4] Ministerio de Hidrocarburos y Energía, Plan Eléctrico del Estado Plurinacional de Bolivia 2025. La Paz: Estado Plurinacional de Bolivia, Ministerio de Hidrocarburos y Energía, Viceministerio de Electricidad y Energías Alternativas; 2014. Technical Report.
[5] Comité Nacional de Despacho de Carga. Demand of Consumers Energy – Available at: <https://www.cndc.bo/media/archivos/boletindiario/demandamax.php?id=120418> [accessed 13.4.2018].
[6] Rosen J, Tietze-Stöckinger I, Rentz O. Model-based analysis of effects from large-scale wind power production. Energy. 2007;32(4):575–83.
[7] Deane JP, Chiodi A, Gargiulo M, Ó Gallachóir BP. Soft-linking of a power systems model to an energy systems model. Energy. 2012 Jun;42(1):303–12
[8] Ministerio de Hidrocarburos y Energía, Plan Óptimo de Expansión del Sistema Interconectado Nacional 2012-2022. La Paz: Estado Plurinacional de Bolivia, Ministerio de Hidrocarburos y Energía, Comité Nacional de Despacho de Carga, Autoridad de Fiscalizacion y Control Social de la Electricidad, ENDE Corporación; 2012. Technical Report.
[9] PSR. SDDP Stochastic Hydrothermal Dispatch with Network Restrictions – Available at: <https://www.psr-inc.com/softwares-es/?current=p4030> [accessed 13.4.2018].
[10] Quoilin S, Hidalgo Gonzalez I, Zucker A. Modelling Future EU Power Systems Under High Shares of Renewables. The Dispa-SET 2.1 open-source model. Luxembourg: Publications Office of the European Union; 2017. Technical Report No.: JRC105452
[11] Gómez E, Evaluación Rápida Del Sector Energía En Bolivia. La Paz: Banco Interamericano de Desarrollo; 2010. se4all Technical Report.
[12] Periodico Digital de Investigacion sobre Bolivia. PIEB. Recursos Naturales/Medio Ambiente - Available at:< http://www.pieb.com.bo/sipieb_nota.php?idn=6499 > [accessed 13.4.2018]. [13] Energetica. Solar map of Bolivia – Available at:
<http://www.energetica.org.bo/energetica/publicacionesd.asp?d=278>. [accessed 13.4.2018]. [14] Lucano M, Fuentes I. Evaluation of the global solar radiation potential in the department of
Cochabamba (Bolivia) using models of geographic information systems and satellite images. Revista Boliviana de Física. 2010;17(1562–3823):13–21.
[15] Quoilin S, Nijs W, Gonzalez IH, Zucker A, Thiel C. Evaluation of simplified flexibility evaluation tools using a unit commitment model. In: International Conference on the European Energy Market, EEM. 2015.
[16] GAMS. General Algebraic Modeling System - Available at: <https://www.gams.com/products/introduction/>. [accessed 13.4.2018].
[17] Gonzáles H, Zucker A, Quoilin S., Dispa-SET 2 . 0 : unit commitment and power dispatch model. Luxembourg: Publications Office of the European Union; 2014. Technical Report No.: JRC93780
[18] Comité Nacional de Despacho de Carga. Energy Demand – Available at: <https://www.cndc.bo/media/archivos/boletindiario/deener_300118.htm>. [accessed 13.4.2018]. [19] Comité Nacional de Despacho de Carga. Expected Unavailability of Generating Units and
Transmission Components – Available at:
<https://www.cndc.bo/media/archivos/boletindiario/indp_010218.htm>. [accessed 13.4.2018]. [20] Comité Nacional de Despacho de Carga. Evolution of Reservoirs – Available at:
<https://www.cndc.bo/media/archivos/boletindiario/caudales.php?id=260118>. [accessed 13.4.2018].
[21] Comité Nacional de Despacho de Carga. Hydrological Data Provided – Available at: <https://www.cndc.bo/media/archivos/boletindiario/dathid_010218.htm>. [accessed 13.4.2018]. [22] 3TIER. Atlas Eólico de Bolivia. Seattle: 3TIER North America; 2009 Jun. IFC Final Report. [23] Pfenninger S, DeCarolis J, Hirth L, Quoilin S, Staffell I. The importance of open data and software: Is energy research lagging behind? Energy Policy. 2017;101(November 2016):211–5.
![Fig. 1. Distribution of global solar radiation in Bolivian territory (annual average): extracted from [13]](https://thumb-eu.123doks.com/thumbv2/123doknet/5936967.146155/3.893.256.635.422.854/distribution-global-radiation-bolivian-territory-annual-average-extracted.webp)