Stress relaxation behavior of organically modified montmorillonite filled
natural rubber/nitrile rubber nanocomposites
Hanna J. Maria
a,f, Nathalie Lyczko
e, Ange Nzihou
e, Kuruvilla Joseph
d, Cherian Mathew
f, Sabu Thomas
a,b,c,g,⁎
aSchool of Chemical Sciences, Mahatma Gandhi University, Priyadarshini Hills, Kottayam, Kerala, India bCenter of Excellence for Polymer Materials and Technologies, Tehnoloski park 24, SI 1000 Ljubljana, Slovenia cUniversiti of Teknologi MARA, 40450, Shah Alam, Selangor, Malaysia
dIndian Institute of Space Science and Technology, Dept of Chemistry, Thiruvanathapuram, Kerala, India eUniversité de Toulouse, Mines Albi, CNRS, Centre RAPSODEE, Campus Jarlard, F-81013 Albi cedex 09, France fDept of Chemistry, S. B. College, Changanacherry, Kottayam, Kerala, India
gInternational and Inter University, Centre for Nanoscience and Nanotechnology, Mahatma Gandhi University, Priyadarshini Hills, Kottayam, Kerala, India
a b s t r a c t
Keywords:
Organically modified montmorillonite Natural rubber
Nitrile rubber
Stretched-exponential relaxation Stress relaxation
Immiscible rubber blends
To reduce material consumption, it is important to have reinforced material with longer life time. Incorporation of nanoparticles to reinforce and compatibilize polymer blends is one of the widely undergoing research areas in polymer science technology. A series of natural rubber and nitrile rubber (NR/NBR) nanocomposite vulcanazite, reinforced with two different organically modified clay (OMt) were prepared. To predict the performance of a material over long periods of time, stress relaxation studies with both the reinforced systems were done. The effects of loading, blend composition, filler polarity and temperature on stress relaxation of OMt reinforced NR/NBR nanocomposites were carefully measured. Based on the stress relaxation measurements, it was observed that due to its polarity difference, O1Mt (Mt modified with dimethyl, benzyl, HT modification provided by South-ern Clay Products) was preferentially located at the NBR phase while O2Mt (Mt modified with mercapto silane provided by English India Clay) had more affinity with natural rubber in the NR/NBR nanocomposites. The preferential localization of OMt has been analyzed by HRTEM. The nature of interaction of the nanoclay was found to influence the stress relaxation rate. NR/NBR nanocomposites with higher filler loading showed higher rates of relaxation rate due to the presence of more filler–filler interactions. At 70 °C, the viscosity ratio was found to influence the reinforcement, and consequently relaxation rate of the 50/50 NR/NBR nanocomposites. It was found that the rearrangements of the polymer chains are dependent on the blend composition, tempera-ture, filler/polymer interactions etc. To explain and predict observed phenomena, the stretched-exponential Kohlrausch equation and Maxwell–Weichert model were used. For both models, the experimental curve fitted well with the theoretical models.
1. Introduction
Blending existing polymers is a very advantageous means of develop-ing new materials, tailored to specific market segments. The philosophy of mixing materials involves combining good properties of the
individual materials, while mitigating their respective detrimental characteristics. Predominantly polymers are incompatible in mixtures. Thus, a compatibilizer is often added to improve the compatibility of different polymers. Nanoparticle as nanocompatibilizers is added to improve the interfacial strength of blends, by exploiting the con-cept of polymer–polymer nanocomposites. Organoclay (OC) mineral has been used as a compatibilizer for incompatible polymers, and it was pointed out byRafailovich et al. (2002)that it could be added into polymer blends in order to improve the compatibility between two incompatible polymers, and to develop a more homogeneous system. The use of montmorillonite (Mt) as a reinforcing and as compatibilizing material for nitrile butadiene rubber (NBR)/styrene butadiene rubber (SBR) nanocomposites has been studied. At higher clay mineral concentration, the OC mineral was not homogeneously distributed in the matrix and agglomeration of the clay mineral causes phase separation (Essawy and El-Nashar, 2004). The influence of
Abbreviations:OC, organically modified clay; CPN, clay polymer nanocomposite; OMt, organically modified montmorillonite; O1Mt, organically modified montmorillonite-cloisite 10A; O2Mt, mercapto silane modified montmorillonite; EPDM, ethylene propylene diene monomer; NR, natural rubber; NBR, nitrile butadiene rubber; ASTM, American Society for Testing and Materials; HR-TEM-, High Resolution Transmission Electron Microscope (HRTEM).
⁎ Corresponding author at: School of Chemical Sciences, Mahatma Gandhi University, Priyadarsini Hills P.O., Kottayam-686560, Kerala, India. Tel.: +91 4812730003, +91 4812731036; fax: +91 481 2731002.
E-mail addresses:sabuchathukulam@yahoo.co.uk,sabupolymer@yahoo.com
clay mineral modification on the structure and mechanical properties of Mt/EPDM nanocomposite showed that the OMt layers were fully exfoliated in the EPDM matrix and have good mechanical properties (Zheng et al., 2004).
The determination, of mechanical properties like tensile strength and elongation at break, provides us with a fundamental understanding about the behavior of a material and these experiments are time-independent. However, these experiments are not enough to predict its long term behavior. Therefore to design a material which has good durability, it is very important to analyze the time-dependent viscoelastic nature of polymers such as stress relaxation, creep, dynamic mechanical properties etc. The stress relaxation experiment is conducted in order to characterize the time-dependent reinforcement of clay polymer nano-composite (CPN) (Le et al., 2010). The viscoelastic rubber, when strained at a constant rate to a fixed deformation, the stress required to maintain that strain decays with time. This is referred to as stress relaxation. The stress relaxation rate depends upon the probability of transition of the system from one stage of equilibrium to another (Tager, 1972). It may be a one-stage or two-stage mechanism in multiphase systems ( Abu-Abdeen, 2010). The processes that can occur during stress relaxation of a typical rubber vulcanizate include physical relaxation, which occurs due to the rearrangement of the polymer chains and the fillers when subjected to deformation and the chemical effect which is more promi-nent at higher temperature and at longer durations due to the aging of rubber by oxidative chain scission, crosslink breakage, or crosslink formation (Abu-Abdeen, 2010).
To this date, only few studies reported about the time and tempera-ture dependent reinforcement of CPN, especially in rubber blend systems (Shah et al., 2005; Fritzsche et al., 2008; Fritzsche et al., 2009). The stress relaxation behavior of short-jute-fiber-rein-forced acrylonitrile butadiene rubber composites studied byBhagawan et al. (1987)reported that a two-stage relaxation pattern existed in these com-posites.Flink and Stenberg (1990)reported that stress relaxation studies could provide insight into the interfacial adhesion in NR composites rein-forced with short cellulose fibers.Varghese et al. (1994)studied the stress relaxation behavior of acetylated short-sisal-fiber-reinforced NR compos-ites. Recently, from this laboratory,Meera et al. (2009)investigated the tensile stress relaxation behaviour of natural rubber reinforced with tita-nia and nanosilica. The rate of stress relaxation was found to increase with increase in filler loading for both the filled system and the silica-filled system, showing a higher rate of stress relaxation compared to the TiO2-filled NR. Thus it is understood that the relaxation mechanism
in nanocomposites is dependent on many factors, such as the nature of the polymers, filler and interface, strain level, strain rate, and temperature.
The rate of stress relaxation of rubber chains can be influenced by its surrounding structure and will be different from other chains even in a homogeneous, unfilled rubber compound. When one compares a polymer/polymer blend nanocomposite and a CPN, a major difference is observed between both morphological and thermomechanical proper-ties. As with the behavior during the deformation stage, the behavior will be different during the relaxation stage also. The complexity is in-creased by the presence of nanoparticles. Different types of relaxation process can take place under loading, which will vary with the different types of interfaces in the material. Naturally, this variation in deformation was expected to result in different modes of stress relaxation behavior. Two OMt were used for the blend preparation. One was cloisite 10A which is polar (O1Mt) and the other was Nanocaliber 200 m which is nonpolar (O2Mt).
Present work, is to find out the effect of filler loading, blend compo-sition and nature of OMt material on the stress relaxation behavior of NR/NBR nanocomposites. We have reported here the stress relaxation behavior of the OMt filled elastomer blends of natural rubber and nitrile rubber. Both NR and NBR have specific individual properties like good mechanical properties for NR and good oil resistance for NBR. Incorpo-ration of OMt into this elastomeric blend was done as an attempt to
make the two rubbers compatible. OMt was found to be effective in compatibilizing elastomer blends (Rafailovich et al., 2002). It appears, no work has been reported explaining the effect of OMt on the stress relaxation behavior of NR/NBR blend nanocomposites.
2. Materials and methods
Polymers used in this study were natural rubber (NR) and nitrile rubber (NBR). Natural rubber ISNR 5 was supplied by the Rubber Board, Kottayam, Kerala, India The weight average molar mass of NR was Mw = 780,000 and Mooney Viscosity 85 ML (1 + 4) at 100 °C. Nitrile butadiene rubber (NBR), with 33% acrylonitrile content and hav-ing Mooney viscosity of ML (1 + 4) at 100 °C and a specific gravity of about 0.98 approximately, was supplied by the Eliokem Industries Ltd. Mumbai. The two OMt used for the study, Cloisite 10A and Nanoclaiber 200 m, were provided by the Southern Clay Products, Mumbai India and the English India Clay, Thiruvananthapuram Kerala, India respectively. Cloisite 10A is an organically modified Mt with dimethyl, benzyl, one alkyl tail ie hydrogenated tallow HT (65 m% C18, 30 m% C16, 5 m% C14 m%) modification with cation exchange capacity (CEC) equal to 125 meq/100 g and an average dry particle size was in the range 2 μm–13 μm. Hereafter, cloisite 10A, will be denoted in this paper as O1Mt. Nanoclaiber 200 m is an organically modified Mt with Mercapto silane modification with 60 – 80 nm average in particle thickness, 200 nm average in diameter and specific surface area of 3.06 m2/g.
The content of this OMt was 45% silica, alumina 38%, Fe-0.5%,TiO2-5.5%,CaO-0.6%,MgO-0.07%,Na2-0.1%,K2O-0.03%. The silane content for
modification was 0.5%. This nonpolar OMt will be denoted as O2Mt hereafter in this document. The compounding ingredients (Table 1) used were of commercial grade.
2.1. Compounding and curing
2.1.1. Preparation of NR/NBR nanocomposite
The NR/NBR nanocomposites were compounded according to the formulation given inTable 1with the aid of a laboratory-sized two roll mixing mill (150, 300 mm) according to ASTM D-3182. The nip gap, roll speed ratio, and number of passes were kept the same for all of the mixes. The temperature range for mixing was 60–90 °C. Both the rubbers were masticated for 2–3 min. They were mixed together to get a homogenous sheet. The compounding ingredients and OMt were then added (Table 1). The different formulations prepared are given inTable 2. After mixing, the rubber composition was molded in an electrically heated hydraulic press to optimum cure, using moulding conditions that were previously determined from rheom-eter torque data. All the compositions represented in the paper fol-low the order NR/NBR (Table 2). Stress relaxation specimens were taken in accordance with ASTM D 638 M standard. (l: 200 mm, t: 4 mm, type1).
Table 1
Compounding ingredients useda.
Materials Parts per hundred (phr) of rubber (in the order of mixing) Zinc oxide 2.5
Stearic acid 1.5
OMtb varied from 0/1/2/5/10
TMTDc 0.2
CBSd 1.3
Sulphur 2.25
aAmount of ingredients expressed in per hundred rubber,(phr). b Organically modified montmorillonite-OIMt &02Mt. c Tetra methyl thiurum disulphide.
2.2. Characterisation
2.2.1. Stress relaxation measurements
Stress relaxation measurements were carried out to study the effect of different parameters that influence the NR/NBR nanocomposite such as loading, filler polarity, blend composition, mixing conditions, nature of filler, temperature and preparation methods. A Tinius Olsen testing machine (H50KT) fitted with an environmental chamber was used to carry out the viscoelastic testing. The environmental chamber was capable of temperature control. After the environmental chamber was equilibrated to the desired temperature (70 °C), the specimen was gripped between two sets of jaws 12 mm apart and then was further allowed to equilibrate to the conditions within the chamber, for a period of 30 – 40 min. Once equilibrated, a tensile stress was applied to the specimen by moving the upper grip at a constant rate (500 mm min−1
crosshead speed). When the desired initial strain of 50% had been reached, movement of the grip was halted and the decrease in stress with time (relaxation) was recorded for a period of 90 min.
The dumbbell specimens were also extended to different strain levels at different strain rates. When appropriate strain of 50% was reached, it was maintained, and the stress was recorded for a time span of 90 min. Because stress relaxation is exponential, the decrease in stress is very prominent during the initial period of relaxation, and therefore, stress monitoring was started immediately after the required strain was attained.
2.2.2. Transmission electron microscopy
To assess the quality of filler dispersion and morphological details, the NR/NBR nanocomposites were investigated by means of transmission
electron microscopy (TEM) (JEM-2100 HRTEM). The micrographs were obtained in point to point resolution 0.194 nm, operating at an accelerating voltage of 200 kV. Cryocut specimens prepared using an ultra-microtome (Leica, Ultracut UCT) were placed on a Cu grids of 300 mesh (35 mm diameter) and were analysed.
2.2.3. X-ray diffraction (XRD) analysis
XRD of NR/NBR nanocomposite was conducted using the XRD: SIEMENS D 5000 with radiations Cu K alpha at 40 kV and 30 mA. 3. Results and discussion
3.1. Effect of nature of filler
Two types of blend compositions (70/30 and 50/50 NR/NBR) were taken for the study to differentiate the interaction of fillers, O1Mt and O2Mt with the two elastomers. The stress relaxation plots of 70/30 and 50/50 NR/NBR nanocomposites with O1Mt and O2Mt are given in
Fig. 1. For better understanding of the slope of each system, a plot of slope vs different filler is shown in the inset. It is understandable from
Fig. 1that the initial and final stress value for both 70/30 and 50/50 NR/NBR nanocomposite with O2Mt modified clay mineral is higher compared to the other NR/NBR nanocomposites (Fig. 1). The slope of the relaxation curve of 50/50 and 70/30 NR/NBR (Fig. 1) is found to be steeper for O1Mt loaded NR/NBR nanocomposites than that for O2Mt filled NR/NBR nanocomposites.(Fig. 1inset). The improved mechanical property and the slow stress relaxation of O2Mt filled NR/NBR filled nanocomposites are due to the strong interaction between O2Mt and NR. Due to its non polar nature, O2Mt goes to the NR phase preferential-ly. Modifications such as mercapto and organofunctional silane can act as molecular bridges between NR molecules and clay mineral particles. Thus O2Mt creates strong crosslinks with the NR phase during vul-canization. The intercalated O2Mt results in good dispersion and enhances the polymer/filler interactions. Additionally, the electron microscopy data also support the fact that, O2Mt preferentially goes to the NR phase (Fig. 2).Fig. 3represents the hypothesis of interaction between O2Mt and the two rubbers.
Table 2
Formulations of the blend.
Materials 100/0 70/30 50/50 0/100
NR 100 70 50 0
NBR 0 30 50 100
*01Mta, 02Mtb 0/1/2/5/10 0/1/2/5/10 0/1/2/5/10 0/1/2/5/10
*organically modified montmorillonite -acloisite 1OA,bmercapto silane modified clay
Fig. 1. Effect of nature of filler on the relaxation behavior of NR/NBR blend nanocomposite. Schematic representation shows the preferential migration of the two O-Mts towards the polymers. The figure in the inset shows the plot of slope vs filler loading. (C-Cloisite10A, M-mercapto silane modified clay).
The viscosity of the NR phase will increase as more number of O2Mt goes to this phase. It is generally accepted that viscosity ratio [ie the ratio of viscosity of the dispersed phase to the viscosity of the matrix (λ)] is one of the most critical variables for controlling blend morphol-ogy. Researchers (Aerts and Everaert, 1999; Favis and Chalifoux, 1987; Loan and Emmanuel, 2007) reported that low viscosity ratio is more favorable for a finer morphology, because high viscous matrix enhances droplet break up by exerting an efficient shear stress transfer towards the dispersed phase, leading to finer diameter of the dispersed phase. Also, it has been already reported that once the viscosity of the matrix phase is increased, the domain size of the dispersed phase will be decreased due to rheological reasons (Paul and Bucknall, 2000). For a viscoelastic dispersion, the critical condition for droplet breakup is given by (Choi et al., 1996)
We≥
F ηdispersed
ηmatrix
! "
sin 2φð Þ ð1Þ
where Weis Weber number related to the viscosity ratio, ηdispersedis the
viscosity of the dispersed phase, ηmatrix, viscosity of matrix phase, F is an
empirical function of the viscosity ratio and Φ the orientation angle. The lower the viscosity ratio the larger the deformation of NBR domains ie when the viscosity ratio is smaller than unity, the domain size of the dis-persed NBR phase is finer and its distribution is more uniform. Thus for 70/30 NR/NBR, the preferential localization of O2Mt in the NR phase will increase the NR phase viscosity, leading to a fine and uniform distribu-tion of NBR domain in the NR continuous phase. Since the molar mass of the NR phase is extremely high, the complete migration of the clay mineral platelets of the clay mineral into NR phase will be restricted
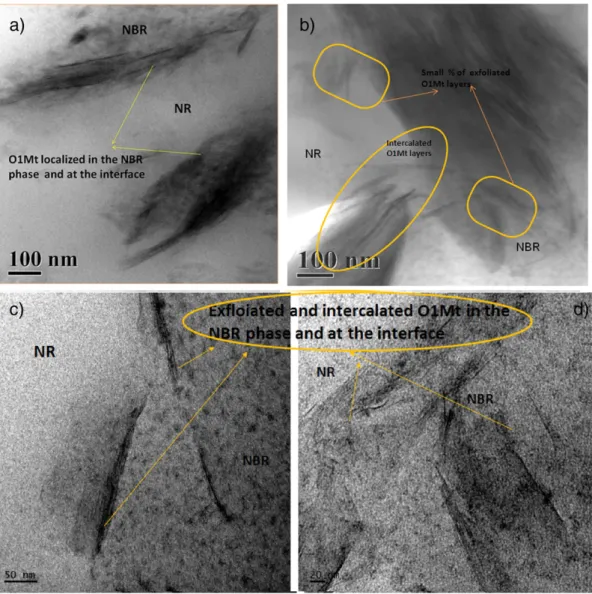
by diffusional constraints. Therefore, it is reasonable to believe that a substantial portion of the clay mineral will stay at the interface.Fig. 3 ex-plains the type of interactions in O2Mt NR/NBR nanocomposite. The slow relaxation behavior of NR/NBR nanocomposites for the 70/30 NR/NBR containing O2Mt system is thus due to the strongly bonded O2Mt to the NR phase. For the 50/50 NR/NBR with O2Mt system too, the clay mineral is localized at the NR and at the interface. Interestingly, this system also shows very slow relaxation process as explained earlier. On the other hand, O1Mt shows affinity towards NBR predominantly. This can also be established from the TEM images(Fig. 4a, b & c). The polar interaction between NBR and O1Mt, localizes the O1Mt, predominantly in the NBR phase. This results in the increase of NBR phase viscosity, which ultimately decreases the polymer chain mobility and suppresses the coalescence of the NBR domains, leading to a fine morphology in the NR matrix for the 70/30 NR/NBR system.(Fig. 5). According to viscosity ratio, the increase in viscosity of the dispersed NBR phase will not favour a fine morphology. However, in this situation the decrease in dispersed domain size is also attributed to the comparable viscosity of NR and NBR phase as a result of the localization of O1Mt in the NBR phase (the pure NR viscosity is much higher than NBR viscosity). The presence of O1Mt at the interface of the two elastomers, (Fig. 4a) shows the partial interaction of O1Mt towards NR phase. The alkyl rich HT present in O1Mt imparts the interaction between NR and O1Mt. The presence of HT in O1Mt slightly weakens the polar interaction between O1Mt and NBR (Hotta and Paul., 2004; Shah et al., 2005; Shah and Paul, 2006). Con-sequently, the OMt acts as an amphiphile holding the two rubbers. The strength of interaction to either of the elastomer is estranged. As a result of these weak bonds, the relaxation takes place extremely fast in the case of O1Mt filled systems. The mechanical property shown inTable 3 con-firms the presence of comparatively stronger interaction in the case of O2Mt filled NR/NBR nanocomposites.
It is also important to point out that in all cases, a two stage relaxa-tion process is observed. The relaxarelaxa-tion at the initial phase relates to the filler–filler rupture and the second phase corresponds to breakage of the polymer/filler and polymer/polymer interactions. That is, interac-tion with different interfaces in the NR/NBR nanocomposites relaxes at different rates.
3.2. Effect of filler loading
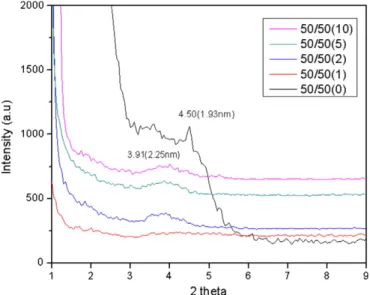
As the filler loading is increased the relaxation rate also was found to increase. The rate of stress relaxation will be more when there is more number of interactions that lead to rupture, resulting in an increase in entropy. As reported earlier (Geethamma et al., 2004), the conditions favoring an increase in entropy will enhance the rate of stress relaxa-tion. So an increase in slope corresponds to rupturing or relaxation of these interactions. The initial stress value was found to be increasing with increase in O1Mt loading (Fig. 6). This can be due to the more num-ber of filler/filler interactions in the case of higher filler loaded samples corresponding to an improved reinforcing effect. However, as the filler content is increased, an increase in slope of the stress relaxation curve was observed. Although an improved reinforcement is shown initially due to a higher number of interactions, most of these filler–filler inter-actions were easily ruptured. The lower residual stress value observed in the case of 10 phr O1Mt loaded NR/NBR nanocomposites may also be associated with the breakage of these weak filler/filler and poly-mer/filler networks during the course of relaxation process (Ray et al., 2002). It was interesting to note that 2 phr NR/NBR nanocomposite has better reinforcement than 5 phr loaded sample, as the former showed higher initial and residual stress value. This was supported by the XRD and TEM results (Figs. 7 and 4c & d) where we can observe a fairly better intercalated and exfoliated morphology for 2 phr NR/NBR nanocomposites with O1Mt as the filler, while higher filler loaded samples indicated the presence of intercalated aggregate structure. The fact that 1 phr polymer polymer nanocomposite shows an interca-lated aggregate structure may be because of the isointerca-lated clay mineral
Fig. 2. SEM images showing the O2Mt clay localized in the NR phase.
aggregates in the rubber matrix with low filler loading. Also at 1phr O1Mt loading shows low initial reinforcement compared to higher filler loading because in this bad dispersion state, the contact area between rubber and clay mineral is insignificant, and therefore, clay mineral shows only a minimal reinforcement effect (Freeman et al., 2001). Agglomeration at higher concentration should have
resulted in a higher relaxation rate due to more and more filler/filler rupturing. Intercalation of polymers between the O1Mt layers and the subsequent rupturing of this interaction on stress relaxation is represented in Fig. 6. The two stage mechanism observed in this case also suggests the different types of interfaces existing in the polymer/polymer nanocomposites. The initial portion represents
Fig. 4. TEM image showing the localization of O1Mt in 50/50 blend nanocomposites a) & b) in the NBR phase and at the interface c) & d) the intercalated and exfoliated morphology of OImt.
breakage of the filler/filler interactions, which can be observed clear-ly from the curve of 10phr NR/NBR nanocomposite, where the slope of the initial portion is higher. It should also be pointed out that the relaxation for NR/NBR blend without O1Mt is lower than that for NR/NBR nanocomposites. This may be explained based on the effect of orientation of OMt and polymer chains. However, this has to be re-examined further using techniques like small angle X-ray diffraction studies and will be produced in the next paper.
3.3. Effect of temperature
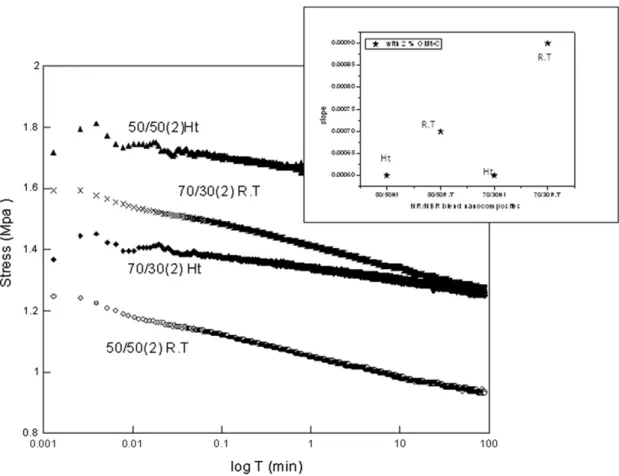
The stress relaxation behavior at higher temperature was studied by comparing the stress relaxation plot of 50/50 and 70/30 NR/NBR loaded with 2 phr O1Mt at room temperature (30 °C) and an elevated
temperature (70 °C) (Fig. 8). In addition to that, a plot variation in slope value with temperature for different nanocomposites is shown in the inset. At 70 °C, even though a higher initial stress value (Fig. 9)
was shown by 50/50(2) NR/NBR nanocomposite, the slope of the
curve for 70/30(2)was found to be lower (Fig. 8). Variation in slope value with temperature for different polymer/polymer nanocomposites
Fig. 6. Effect of filler loading on stress relaxation behavior of 50/50 NR/NBR blend nanocomposite with O1Mt.The schematic representation shows the intercalated aggregates of the O1Mt at different filler loading. In the inset the plot of slope vs filer loading is given.
Fig. 7. XRD pattern of 50/50 blend with different O1Mt loading. Table 3
Tensile properties of NR/NBR blend nanocomposites with the two different fillers. 70/30(0) 70/30(5)M 70/30(5)C 50/50(0) 50/50(5)M 50/50(5)C aσ b(MPa) 12.91 21.3 10.93 3.28 13.42 5.75 bε b(%) 226 530 4.96 333 416 331 cσ 100(MPa) 1.68 1.23 0.78 0.67 1.23 0.88 dσ 200(MIa) 9.783 4.46 1.57 1.30 2.32 1.81
M-Mercapto silane modified organoclay C-Cloisite 10A
aTensile strength. b Elongation at break (%). c Stress at 100%. d Stress at 200%.
is shown in the inset. This can be explained on the basis of the irreversible changes occurring in the system and of viscosity (Cao and Sadhan, 2007). Irreversible changes occurring in the system like increased bonding between clay mineral and polymer, increased crosslinks etc can make the interactions more stable. It has been reported earlier, that when the viscosity of the matrix is very high ηd/ηmbb1, then the viscosity factors
outweigh the interfacial tension (Loan and Emmanuel, 2007) and the presence of OMt at the interface will not affect the viscosity ratio. In this context, if we analyze the 70/30 and 50/50 NR/NBR O1Mt system, in the former case, at room temperature, majority of O1Mt may be in the NBR phase due to polarity factors, and slightly at the interface due to its
affinity towards NR as a result of the alkyl groups in hydroxy tallow. (ie ηdNNNηm). At 70 °C, a major change in viscosity can be shown only by the matrix phase, as variation in the viscosity of the highly filled dis-persed phase is difficult at this temperature. This decrease in viscosity of NR matrix phase can pull the O1Mt from the interface towards it, resulting in a better interaction between NR and O1Mt at 70 °C. The fact that polar interaction between polymer and clay mineral (Meeting of the American Chemical Society, Cleveland, Ohio, 1914) will weaken at higher temperature drives the migration of O1Mt towards the NR phase. This new interaction between NR and O1Mt causes a decrease in relaxation rate for both the composition at higher temperature. At higher
Fig. 8. Stress relaxation curves of two different blend compositions of NR/NBR blend at two different temperatures. Inset, the slope of the nanocomposites at different temperature.
Fig. 9. Time dependence of normalized stress for a) different NR/NBR blend nanocomposites with Cloisite 10A and b) different C10A loaded 70/30 NR/NBR blend (curve fitting with Kohlrausch model).
temperature, there is the possibility of additional crosslinks for both the phases, due to aging processes. This also could have resulted in the de-creased relaxation rate at higher temperature.
4. Modelling
Two models were applied to compare the theoretical value with experimental results. One is a two component stretched exponential Kohlrausch equation (Ferry, 1970) and the other is three elements Maxwell–Weichert model (Aklonis et al., 1972) with three relaxation times. It was found that both models fitted well with the experimental stress relaxation curves. The stretched exponential Kohlrausch equation used to fit the experimental curves of the nanocomposites is given by στ σ0¼ σ∞ σ0þ σ1 σ0e −t τ ð Þβ ½ & ð2Þ
where σ∞/σ0,σ1/σ0, and β are the fitting parameters. The relaxation
time τ, the stretching parameter β, transient stress σ1/σ0, and limiting
stress σ∞/σ0are given inTable 4. The extent of fit was made from the
χ2and R value, given in the table (Table 4) to assess the quality of the
fits.
The experimental curves fitted to the above Eq.(2)are shown in
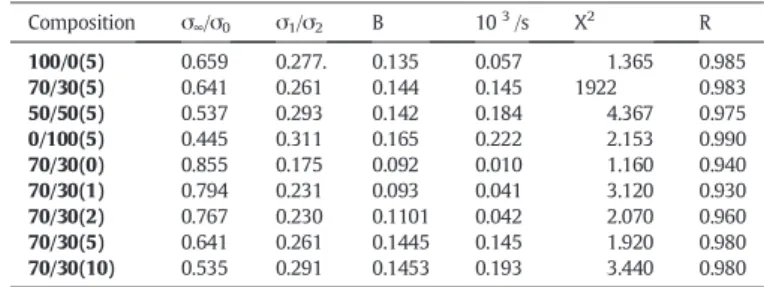
Fig. 9a and b for varying composition, NR/NBR nanocomposites and for different O1Mt loaded 70/30 NR/NBR nanocomposites respectively. It is clear from the data (Table 4) that the limiting stress value σ∞/σ0
decreases as the filler content is increased. One reason may be due to the higher structural changes occurring in the blend nanocomposites with higher filler loading. This can be explained by the fact that, as the filler content is increased, higher scale structural rearrangements occur by rupturing of more and more of these filler/filler and polymer/ filler networks. For the NR/NBR nanocomposites with different O1Mt
loading, this can be determined from the fitting parameter values. As the filler loading is increased, the transient stress σ1/σ0and the
charac-teristic relaxation time were found to be increasing, while the limiting stress value σ∞/σ0decreases. This can be attributed to the increased
structural relaxation caused by rupturing of a higher content of polymer/filler and agglomerated filler/filler networks.
To know the relation of the stress relaxation behavior of NR/NBR/ O1Mt nanocomposite, Maxwell–Weichert model with three relaxation times was introduced and it was found that the experimental curve fitted well with the theoretical curve. The expression for stress decay according to this model is given in Eq.(3)
σt=σ0¼ Aexp −t=τð 1Þ þ B exp −t=τð 2Þ þ C exp −t=τð 3Þ ð3Þ where A, B and C are the pre-exponential factors (A + B + C = 1) and τ1, τ2, τ3the relaxation times, (τ1bτ2bτ3). As the different
relax-ation times should be related to specific structures (Xia et al., 2007). The NR/NBR nanocomposite was expected to have three main relaxation processes, filler/filler disruption, polymer/filler disruption or disentan-glement of network of polymer/polymer, and pullout of filler from poly-mer coils. The first shortest relaxation time is attributed to the breakup of filler/filler interactions, the second relaxation time is due to the disen-tanglement of the chains in the NR/NBR blend system, and the third lon-gest relaxation time is from the pullout of filler particles from the polymer coils. The values of A, B, C, τ1,τ2and τ3were calculated
from the curve fitting of experimental data according toFig. 10a & b, and are presented inTable 5.
Fig. 10b presents the stress relaxation behavior of NR/NBR nanocom-posite with O1Mt at different clay mineral contents. The values of A, B, C, τ1, τ2and τ3are presented inTable 5. It is seen fromTable 5that
the value of τ1increases with increase in filler loading, indicating an
increase in filler/filler breakage. However, for τ2and τ3although it
increased with OMt loading, at 5phr a sudden decrease in the values
was observed. Since the value of τ2 and τ3 corresponds to the
distanglement of polymer chains and breakage of polymer/filler interactions respectively, the decrease in value of τ2and τ3can be
attributed to the better dispersion and interaction of O1Mt with the polymer chains. The values of the pre-exponential factors A, B & C indicating the fraction of the chains undergoing relaxation also satisfy to the explanation. The clay mineral particles cannot be elon-gated during stretching due to high stiffness. Thus, the extension level of polymer matrix in filled NR/NBR nanocomposites was higher than that in unfilled polymer. The same trend was observed in Kohlrausch model also.
Table 4
Curve fitting results for stress relaxation data according toFig. 9a and b. Composition σ∞/σ0 σ1/σ2 B 103/s X2 R 100/0(5) 0.659 0.277. 0.135 0.057 1.365 0.985 70/30(5) 0.641 0.261 0.144 0.145 1922 0.983 50/50(5) 0.537 0.293 0.142 0.184 4.367 0.975 0/100(5) 0.445 0.311 0.165 0.222 2.153 0.990 70/30(0) 0.855 0.175 0.092 0.010 1.160 0.940 70/30(1) 0.794 0.231 0.093 0.041 3.120 0.930 70/30(2) 0.767 0.230 0.1101 0.042 2.070 0.960 70/30(5) 0.641 0.261 0.1445 0.145 1.920 0.980 70/30(10) 0.535 0.291 0.1453 0.193 3.440 0.980
Fig. 10. Time dependence of normalized stress for a)different NR/NBR blend nanocomposites with Cloisite 10A and b) different C10A loaded 70/30 NR/NBR blend (curve fitting with three element Maxwell–Weichert model).
5. Conclusions
The blending of NBR with NR was found to improve the physical and mechanical properties of NBR. The stress relaxation experiment was conducted in order to characterize the time-dependent reinforcement of the clay mineral reinforced NR/NBR nanocomposites. The study of the effect of filler loading showed a noticeable change in the relaxation rate. The rate of relaxation was found to decrease at lower filler loading while at higher filler loading, the rate of stress relaxation is increased. This higher relaxation rate is attributable to the decrease in polymer filler interactions. At higher loading, the increase in filler/filler interac-tions accelerates the stress relaxation. The nature of OMt was also found to influence the stress relaxation behavior. The O2Mt clay mineral showed lower relaxation rate compared with O2Mt because of its better interaction with the polymer matrix. Temperature also had an effect on the stress relaxation rate. Finally, it is important to add that, in order to design high performance polymer/polymer/OMt nanocomposites for dynamic applications, the OMt should have a high extent of dispersion in the matrix. The nature of modification in OMt determines the poly-mer/filler interactions. The experimental value of the stress relaxation curve fitted well with the theoretical value of the stretched exponential Kohlrausch equation and the three elements Maxwell–Weichert model with three relaxation times.
Acknowledgments
We thank the Department of Science & Technology (DST)-Nano Science and Technology (Nano Mission), Delhi, India for the financial support, Jozef Stefan Institute, Department F4 Jamova Cesta 39 SI-1000 Ljubljana, Slovenia for support and guidance, Ecole de mine Albi for SEM and XRD measurements and the English India clay, Thiruvananthapuram, Kerala, India for providing the nanoclay. References
Abu-Abdeen, M., 2010.Single and double-step stress relaxation and constitutive modeling of viscoelastic behavior of swelled and un-swelled natural rubber loaded with carbon black. Mater. Des. 31, 2078–2084.
Aklonis, J.J., MacKnight, W.J., Shen, M., 1972.Introduction to Polymer Viscoelasticity. Wiley-Interscience, New York 249.
Bhagawan, S.S., Tripathy, D.K., De, S.K., 1987. Stress relaxation in short jute fiber-reinforced nitrile rubber composites. J. Appl. Polym. Sci. 33, 1623–1639.http://dx.doi.org/10.1002/ app.1987.070330517.
Cao, F., Sadhan, C.J., 2007.Nanoclay-tethered shape memory polyurethane nanocompos-ites. Polymer 48 (13), 3790–3800.
Choi, G.D., Jo, W.H., Kim, H.G., 1996. The effect of the viscosity ratio of dispersed phase to matrix on the rheological, morphological, and mechanical properties of polymer blends containing a LCP. J. Appl. Polym. Sci. 59, 443–452.http://dx.doi.org/10.1002/ (SICI)1097-4628(19960118)59:3b443::AID-APP8N3.0.CO;2-P.
Essawy, D., El-Nashar, 2004.The use of montmorillonite as a reinforcing and compatibilizing filler for NBR/SBR rubber blend. Polym. Test. 23, 803–807.
Everaert, V., Aerts, L., 1999.Phase morphology development in immiscible PP/(PS/PPE) blends influence of the melt-viscosity ratio and blend composition. Polymer 40, 6627–6644.
Favis, B.D., Chalifoux, J.P., 1987. The effect of viscosity ratio on the morphology of polypro-pylene/polycarbonate blends during processing. Polym. Eng. Sci. 27, 1591–1600.
http://dx.doi.org/10.1002/pen.7602721053 (Reactive Polymer Blending edited by Warren E. Baker, Chris E. Scott, G. H. Hu).
Ferry, J.D., 1970.Viscoelastic Properties of Polymers. John Wiley & Sons, New York.
Flink, P., Stenberg, B., 1990.An indirect method which ranks the adhesion in natural rubber filled with different types of cellulose fibres by plots of E(t)/Et = 0 versus log t. Br. Polym. J. 22, 193–199.
Freeman, G. M., Carl, J., Marshall, Jr., Lackey, W. O., Onizawa, M., 2001. Hydrous clay slurry mixture containing a silane-treated clay United States Patent 6197105, July 6th. Fritzsche, J., Das, A., Jurk, R., Stöckelhuber, K.W., Heinrich, G., Klüppel, M., 2008.Relaxation
dynamics of carboxylated nitrile rubber filled with organomodified nanoclay. Express Polym. Lett. 2, 373–381.
Fritzsche, J., Meier, J.G., Klüppel, M., 2009.Kautsch. Gummi Kunstst. 62, 319–325.
Geethamma, V.G., Pothen, L.A., Bhaskar, R., Neelakantan, N.R., Thomas, S., 2004.Tensile stress relaxation of short-coir-fiber-reinforced natural rubber composites. J. Appl. Polym. Sci. 94 (1), 96–104.
Hotta, S., Paul, D.R., 2004.Nanocomposites formed from linear low density polyethylene and organoclays. Polymer 45, 7639.
Le, H.H., Ali, Z., Ilisch, S., Radusch, H.-J., 2010. Time-dependent reinforcement effect of nanoclay in rubber nanocomposites. J. Mater. Sci. 46, 1685–1696.http://dx.doi.org/ 10.1007/s10853-010-4986-2.
Loan, T.V., Emmanuel, P.G., 2007.Compatibilizing poly (vinylidene fluoride)/nylon-6 blends with nanoclay. Macromolecules 40 (23), 8271–8276.
Meera, A.P., Said, S., Grohens, Y., Luyt, A.S., Thomas, S., 2009.Tensile stress relaxation stud-ies of TiO2and nanosilica filled natural rubber composites. Ind. Eng. Chem. Res. 48, 3410–3416.
Meeting of the American Chemical Society, 1914.(American Chemical Society, Cleveland, Ohio, April 4).
Paul, D.R., Bucknall, C.B., 2000.Polymer Blends. John Wiley & Sons, New York.
Rafailovic, M., Sokolov, J., Zhu, S., Chu, B., 2002.Compatibilizer for immiscible polymer blends, United States Patent No. 6339121, January 15.
Ray, S., Shanmugharaj, A.M., Bhowmick, A.K., 2002. A new parameter for interpretation of polymer-filler and filler-filler interactions in rubber vulcanizates. J. Mater. Sci. Lett. 21, 1097–1100.http://dx.doi.org/10.1023/A:1016506532606.
Shah, R.K., Paul, D.R., 2006. Comparison of nanocomposites prepared from sodium, zinc, and lithium ionomers of ethylene/methacrylic acid copolymers. Macromolecules 39, 3327.http://dx.doi.org/10.1021/ma0600052.
Shah, D., Maiti, P., Jiang, D.D., Batt, C.A., Giannelis, E.P., 2005a.Effect of nanoparticle mobility on toughness of polymer nanocomposites. Adv. Mater. 17, 525–528.
Shah, R.K., Hunter, D.L., Paul, D.R., 2005b. Nanocomposites from poly (ethylene-co-methacrylic acid) ionomers: effect of surfactant structure on morphology and proper-ties. Polymer 46, 2646.http://dx.doi.org/10.1016/j.polymer.01.062.
Tager, A., 1972.Physical Chemistry of Polymers. Mir Publisher, Moscow.
Varghese, S., Kuriakose, B., Thomas, S., 1994. Stress relaxation in short sisal-fiber-reinforced natural rubber composites. J. Appl. Polym. Sci. 53.
Xia, H.S., Song, M., Zhang, Z.Y., Richardson, M., 2007. Microphase separation, stress relaxa-tion, and creep behavior of polyurethane nanocomposites. J. Appl. Polym. Sci. 103, 2992.http://dx.doi.org/10.1002/app.25462.
Zheng, H., Zhang, Y., Peng, Z., Zhang, Y., 2004.Influence of clay modification on the structure and mechanical properties of EPDM/montmorillonite nanocomposites. Polym. Test. 23, 217–223.
Table 5
Curve fitting results for stress relaxation data according toFig. 10a and b. Composition τ1 τ2 τ3 A B C chisq R 70/30(0) 1099.9 0.5218 10.49 0.6216 0.1266 0.0966 0.4741 0.9977 70/30(1) 1705.7 0.5489 10.75 0.6982 0.1148 0.0803 0.3537 0.9974 70/30(2) 3524.6 0.8044 12.27 0.8157 0.0664 0.0521 0.3194 0.9946 70/30(5) 3121.5 0.4927 11.16 0.8636 0.0433 0.0506 0.2621 0.9950 70/30(10) 6684.5 0.7140 11.62 0.8831 0.0461 0.0320 0.2109 0.9901 100/0(5) 1718.0 0.5328 8.15 0.7178 0.1085 0.0786 0.3252 0.9966 70/30(5) 1641.6 0.5696 10.82 0.7038 0.1142 0.0791 0.2844 0.9975 50/50(5) 1162.5 0.8382 12.63 0.6220 0.1302 0.0882 0.5810 0.9967 0/100(5) 803.14 0.4465 8.34 0.5329 0.1822 0.1148 0.5718 0.9973