Université de Montréal
Trajectoires développementales de l’IMC durant l’enfance : Une étude longitudinale sur 8 ans.
par
Laura Elizabeth Pryor
Départment de médecine sociale et préventive Faculté de médecine
Mémoire présenté à la Faculté de médecine en vue de l'obtention du grade de M.Sc.
en Santé communautaire
Août, 2009
Université de Montréal
Faculté des études supérieures et postdoctorales
Ce mémoire intitulé :
Trajectoires développementales de l’IMC durant l’enfance : Une étude longitudinale sur 8 ans.
présentée par : Laura Elizabeth Pryor
a été évaluée par un jury composé des personnes suivantes :
Louise Séguin président-rapporteur Sylvana Côté directeur de recherche Tracie A. Barnett membre du jury
Résumé de recherche
Trajectoires développementales de l’IMC durant l’enfance : Une étude longitudinale sur 8 ans.
Introduction : L’obésité infantile, origine de nombreux problèmes de santé, représente un grand défi en santé publique. Récemment, l’importance d’étudier l’évolution du surpoids durant l’enfance ainsi que les facteurs de risques précoces pour l’obésité a été reconnue. Les trajectoires développementales d’indice de masse corporelle (IMC) chez les jeunes représentent une approche innovatrice qui nous permet de mieux comprendre cette problématique importante.
Objectifs: 1) Identifier des trajectoires développementales distinctes de groupes d’enfants selon leur IMC durant l’enfance, et 2) Explorer les facteurs de risques précoces qui prédisent l’appartenance de l’enfant à la trajectoire d’IMC le plus élevé
Hypothèses: 1) On s’attend à retrouver un groupe d’enfants qui suit une trajectoire d’IMC élevée durant l’enfance. 2) On s’attend à ce que certaines caractéristiques de la mère (ex : tabac pendant la grossesse et IMC élevé), soient associées à l’appartenance de l’enfant au groupe ayant la trajectoire «IMC élevé ». Méthodes: Estimation des trajectoires développementales d’IMC d’enfants, dans un échantillon populationnel (n=1957) au Québec (ELDEQ). Les IMC ont été calculés à partir de données fournies par les mères des enfants et recueillis chaque année sur une durée de 8 ans. Des données propres à l’enfant sa mère, ainsi que socioéconomiques, ont étés recueillies. Une régression logistique multinomiale a été utilisée pour distinguer les enfants avec un IMC élevé des autres enfants, selon les facteurs de risques précoces.
Résultats:
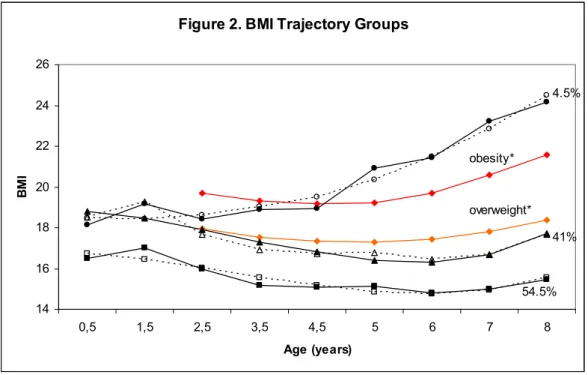
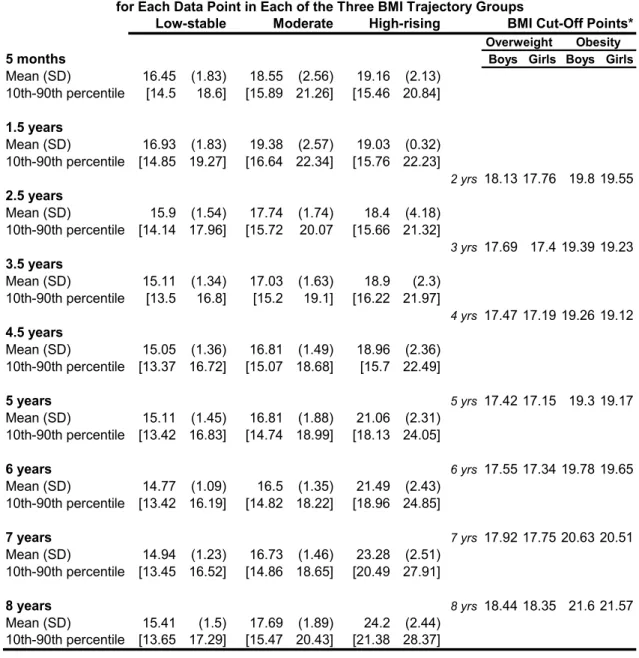
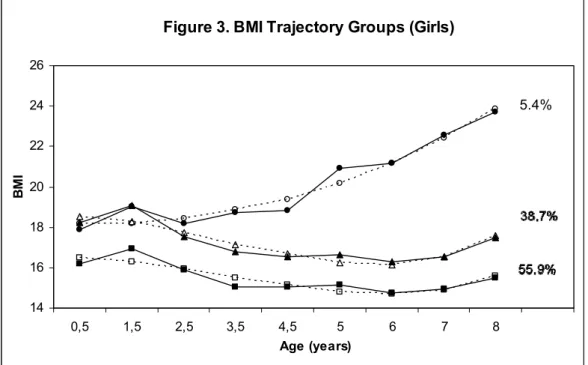
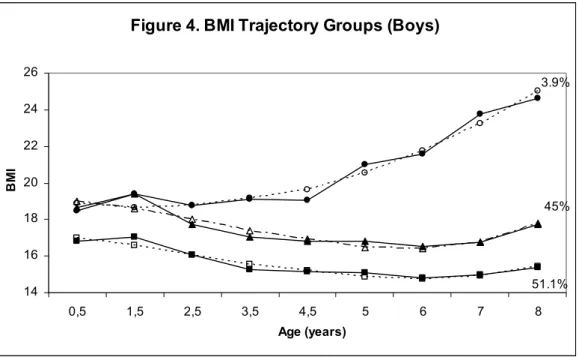
Trois trajectoires d’IMC ont étés identifiées : IMC « bas-stable » (54,5%), IMC « modéré » (41,0%) et IMC « élevé et en hausse » (4,5%). Le groupe « élevé et en hausse » incluait des enfants pour qui l’IMC à 8 ans dépassait la valeur limite pour l’obésité. Les analyses de régression logistique ont révélé que deux facteurs de risques maternels étaient significativement associés avec la trajectoire “en hausse” par rapport aux deux autres groupes : le tabac durant la grossesse et le surpoids maternel.
Conclusions:
Des risques d’obésité infantile peuvent êtres identifiés dès la grossesse. Des études d’intervention sont requises pour identifier la possibilité de réduire le risque d’obésité chez l’enfant en ciblant le tabac et le surpoids maternelle durant la grossesse.
Mots clés: Indice de masse corporelle (IMC), obésité infantile, trajectoires développementales de groupe, facteurs de risque précoce, étude populationnelle, tabac pendant la grossesse, obésité maternelle.
Abstract
Developmental Trajectories of Body Mass Index in Early Childhood: An 8-Year Longitudinal Study.
Introduction: Childhood obesity has become one of the greatest Public Health challenges this century, affecting not only developed nations, but increasingly low- and middle-income countries as well. Estimating developmental trajectories of Body Mass Index (BMI) during early childhood represents an innovative approach towards a better understanding of the development of this health problem.
Objective: To identify groups of children with distinct developmental trajectories of Body Mass Index (BMI) between the ages of five months and eight years, and to identify early-life risk factors that distinguish children in an atypically elevated BMI trajectory group.
Methods: Group-based developmental trajectories of BMI were estimated from annual maternal assessments (5 months to 8 years) in a large population sample (n=1957). Measures of height and weight, as well as family and child
characteristics were obtained yearly from mothers. Multivariate logistic regression was used to distinguish children with elevated BMI from other children, using pre and early post-natal risk factors.
Results: Three trajectories of BMI were identified: low-stable BMI (54.5%), moderate BMI (41.0%) and high-rising BMI (4.5%). The high-rising group
included children whose BMI, at eight years of age, exceeded the cut-off value for obesity. Multinomial logit regression analyses revealed that two maternal risk factors were significantly associated with the high-rising BMI trajectory group as compared to both the low and moderate groups: smoking during pregnancy and
Conclusions: Antecedents of childhood obesity can be identified during pregnancy. Intervention studies are needed in order to test the possibility that targeting maternal smoking and maternal obesity during pregnancy would reduce the risk of childhood obesity in the offspring.
Keywords: Body Mass Index (BMI), child obesity, Group-based developmental trajectories, early life predictors, population-based study, maternal smoking, maternal obesity.
Table of Contents Résumé de recherche... i Abstract ...iii List of Tables... v List of Figures ... vi List of Abbreviations...vii Acknowledgements ...viii CHAPTER 1: Introduction... 1 1.1 Background ... 1 1.2 Purpose ... 5 1.3 Objectives... 5 1.4 Hypotheses ... 5
CHAPTER 2: Literature Review... 6
2.1 Developmental Theories and Fetal Origins Hypotheses of Adiposity.... 6
2.1.1 The Barker Hypothesis... 8
2.2 Measuring Overweight and Obesity using the BMI... 9
2.3 BMI Growth Curves... 11
2.4 BMI Trajectories ... 12
2.5 Early-Life Risk Factors for Obesity ... 13
2.5.1 Child Risk Factors... 13
2.5.2 Maternal Behaviours and Health Characteristics ... 19
2.5.3 Family Risk Factors... 25
2.6 Summary of Previous Findings ... 26
CHAPTER 3: Methodology ... 28
3.1 Study Design and Participants... 28
3.2 Attrition Analyses... 28
3.3 Measures... 31
3.4 Summary of Data Analysis... 36
3.5 Data Analysis, Phase 1: Trajectory Modeling... 36
3.5.1 Trajectory Model Selection ... 36
3.5.2 Checking Classifications ... 38
3.5.3 Verifying an Association with Age ... 39
3.5.4 KML Cluster Modeling... 39
3.5.5 Variance Component Analyses ... 40
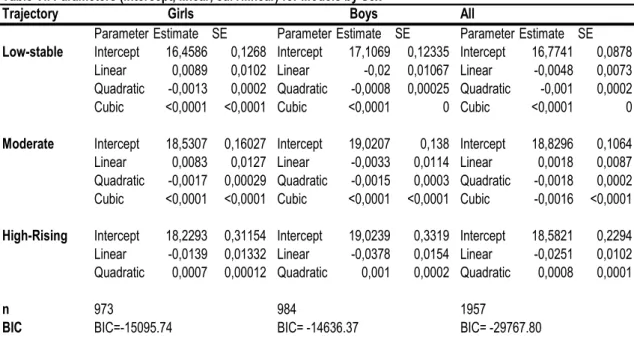
3.5.6 Trajectory Modeling by Sex... 40
3.6 Data Analysis, Phase 2: Risk Factors... 40
3.6.1 Descriptive Statistics ... 40
3.6.2 Bivariate Analyses and Treatment of Continuous Variables ... 41
3.6.3 Correlation Analyses ... 42
3.6.4 Final Model: Multivariate Analysis ... 43
CHAPTER 4: Results... 45
4.5 Data Analysis, Phase 1: Trajectory Modeling... 45
4.5.1 Trajectory Model Selection ... 45
4.5.2 Checking Classifications ... 45
4.5.3 Verifying an Association with Age ... 48
4.5.4 KML Cluster Modeling... 49
4.5.5 Variance Component Analyses ... 49
4.6 Data Analysis, Phase 2: Risk Factors... 52
4.6.1 Bivariate Analyses... 52
4.6.2 Correlation Analyses ... 53
4.6.3 Final Model: Multivariate Analysis ... 54
CHAPTER 5: DISCUSSION ... 57
5.1 Summary and Interpretation of Main Findings ... 57
5.2 Limitations and Methodological Issues... 63
5.3 Implications of Study ... 66
5.4 Further Research... 67
CHAPTER 6: CONCLUSION... 72
REFERENCES... 73
Appendix A: Letter to the Parents... ix
Appendix B: Parent Consent Form ... x
Appendix C: ELDEQ Ethics Approval Response Letter ... xi
Appendix D: Ethics Approval: University of Montreal Faculty of Medicine...xii
Appendix E: Table of BIC Values ...xiii
Appendix F: Trajectory Model in KML...xvii
Appendix G: Zero-Order Correlation Table...xviii
Appendix H: Analysis of Interactions ... xix
List of Tables
I. WHO Classification of Obesity, Waist Circumference and Associated Comorbidity Risks.
II. Demographic Characteristics of Sample at 5 months (1998) (n=1957). III. Attrition Analyses: Comparison of Characteristics-Included and
Excluded Families
IV. Mean BMI, Standard Deviation and 10th and 90th Percentiles for Each Data Point in Each of the Three BMI Trajectory Groups.
V. Proportion of Boys and Girls in BMI Trajectory Groups.
VI. Parameters (intercept, linear, curvilinear) for Trajectory Models by Sex.
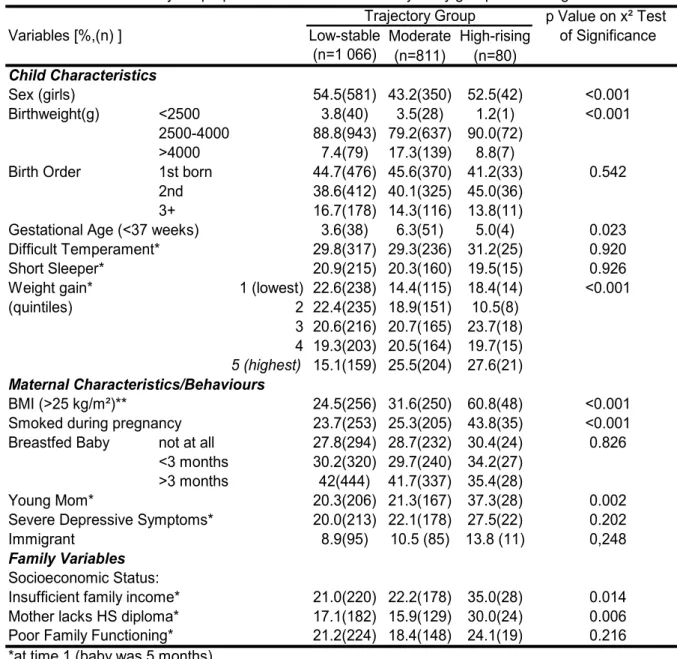
VII. Bivariate Analyses: Proportion of Children in BMI Trajectory Groups According to Each Risk Factor.
VIII. Multinomial Logit Regression Analyses of the Association Between Early Childhood Risk Factors and BMI trajectories (between 1 ½ and 8 years) (n=1957).
List of Figures
1. BMI Trajectory Groups. 2. BMI Trajectory Groups
(with IOTF cut-off points indicated). 3. BMI Trajectories Groups (Girls). 4. BMI Trajectory Groups (Boys).
List of Abbreviations
AR : Adiposity ReboundBIC : Bayesian Information Criterion BMI : Body Mass Index
CDC: Center for Disease Control CI: Confidence Interval
CVD: Cardiovascular Disease
DEXA: Dual energy x-ray absorptiometry
ÉLDEQ : Étude longitudinale du développement des enfants du Québec GDM : Gestational Diabetes Mellitus
IMC : Indice de masse corporelle IOTF: International Obesity Task Force ISQ: Institut de la Statistique du Québec
NLSY79: National Longitudinal Study of Youth ‘79
QLSCD : Québec Longitudinal Study of Child Development OR: Odds Ratio
SES : Socioeconomic Status SD: Standard Deviation SE: Standard Error
SGA: Small for Gestational Age WC: Waist Circumference
WHO : World Health Organization WHR: Waist-to-hip ratio
Acknowledgements
I very much appreciate the help I have received in completing this research project and would like to thank the following individuals:
My research supervisor, Sylvana Côté, PhD, for her guidance and support
throughout the project. She is truly an inspiring individual. I especially appreciate the patience that she showed, and the confidence she instilled in me, while helping me to complete this work.
Bruno Falissard, MD, PhD, for welcoming me into his research unit, INSERM U669 and his classroom at Paris XI university, and for guiding me with his clinical and statistical expertise.
Evelyne Touchette, PhD, with whom I shared a wonderful year in the “bureau des canadiens”. No matter how busy she was, she was always there for help and encouragement. I learned so much from her experience.
Qian Xu and Xuecheng Liu, for their statistical expertise and for answering all of my questions!
I would also like to thank my family for their ongoing support, and Yvan, for being there for me all year, and for helping me up until the last minute with computer problems and text revisions!
I would like to thank as well, the Fonds de Recherche en Santé du Québec (FRSQ), the Ste Justine Children’s hospital, and the Ministry of Education of Quebec (MEQ) for their generous support of my work and my studies in Paris.
And, in conclusion, I would like to especially thank all the children and families whose ongoing participation made this study possible, as well as the interviewers who have assessed mothers and children over the course of this study.
1.1 Background
Several epidemiologic studies show a drastic increase in the prevalence of obesity among children over the past decades (Ebbeling, 2002, Wang & Lobstein, 2006). As much as 20-30% of children in North America, Europe and parts of the Western Pacific are overweight or obese (Wang & Lobstein, 2006). Initially touching mostly on industrialized nations, this problem is increasingly prevalent in developing countries (WHO, 2004), creating an odd paradox, wherein the conditions of undernutrition and obesity often co-exist within the same household (Caballero, 2005). It has even been hypothesized that obesity may replace
undernutrition and infectious disease as the most significant contributor to ill health worldwide (Kopelman, 2000).
Overweight and obesity can be broadly defined as an abnormal or
excessive accumulation of fat that presents a health risk (WHO, 2006). The Body Mass Index (BMI), a measure associating an individual’s weight to their height, is commonly used to assess overweight and obesity. Overweight is considered as a BMI equal to or greater than 25 kg/m². A BMI equal or greater than 30 kg/m² is considered to be indicative of obesity in an individual, and further classifications exist for increasing gradations of obesity severity (James, 2001, WHO, 2004). It is well established that overweight and obese individuals are at an increased risk for several chronic diseases; in particular, cardiovascular disease (CVD), type 2 diabetes mellitus, certain forms of cancer (Samanic, 2006), respiratory
complications, and osteoarthritis of large and small joints, and that these risks, as well as the risk for decreased longevity, increase according to the severity of the weight problem (Kopelman, 2000, Walley, 2006, WHO, 2006).
Of particular concern is the growing number of overweight and obese children. According to the 2004 Canadian Community Health Survey,
approximately 26% of youth aged 2-17 are overweight or obese, up from 15% in 1979 (Statistics Canada, 2005). A startling by-product of this is the dramatic increase in type 2 diabetes diagnoses among adolescents, a phenomenon once rare in youth (Ebbeling, 2002, Fagot-Campagna, 2000). There is also evidence of early coronary atherosclerosis among obese male adolescents (Malcolm, 1997). In addition, an overweight child may suffer a considerable negative psychosocial impact (Erickson, 2000, Strauss, 2000), numerous endocrine disorders affecting both insulin (insulin resistance, diabetes) and pubertal hormones (precocious puberty, polystic ovarian syndrome (girls), hypogonadism (boys) (Ebbeling, 2002), as well as orthopaedic and/or pulmonary complications (ie: sleep apnoea, asthma, exercise intolerance) that may inhibit participation in games and sports and further contribute to their weight problem (Deckelbaum & Williams, 2001, Ebbeling, 2002, Li, 2003, Speiser, 2004).
Child obesity may persist into adolescence (Nader, 2006) and adulthood (Freedman, 2005). A study tracking overweight from early childhood into
adolescence, indicated that children who were overweight at least one time during the preschool period had five times more chance of being overweight in
adolescence, as compared to children who were never overweight during the pre-school years (Nader, 2006). Another longitudinal study showed that 53% of overweight girls ages 2-5 years became adults with excess adiposity (Freedman, 2005). Furthermore, the risks for chronic disease associated with obesity may persist into adulthood, even when the excess weight is lost (Deckelbaum & Williams, 2001).
These findings led researchers to search for the early courses of obesity and some found evidence that the perinatal period is a critical period for obesity development (Dietz, 1994, Breir, 2001, Vickers, 2000). Certain adversities in the fetal and early infancy environment may have a significant effect on an
individual’s likelihood of developing overweight or obesity later on (Huang, 2007, Oken & Gilman, 2003). Increasingly, early life risk factors as well as the distinct developmental paths that a child’s level of adiposity may follow are being considered important areas of study (Adair, 2008, Li, 2007).
In a large cohort study of 8234 children in the UK, 25 early-life risk factors for obesity at 7 years of age were examined. Eight of the 25 putative early-life risk factors were associated with an increased risk for obesity at age seven: parental obesity, early adiposity rebound, greater time spent watching television at age 3, the occurrence of “catch-up growth”1, greater weight gain in the child’s first year, high birth weight, and short sleep duration (Reilly, 2005). Other studies have identified maternal smoking during pregnancy (Oken, 2008), and the
absence or reduced length of breastfeeding (Armstrong, 2002, Von Kries, 1999) as being associated with child obesity.
The prevention of the negative health and psychosocial consequences of obesity requires a comprehensive understanding of its development and early risk factors. The frequently used cross-sectional design for studies on childhood obesity does not allow for the identification of distinct developmental patterns (Mustillo, 2003), nor does it aid in our understanding of the specific early life characteristics that may result in such patterns. Growing evidence suggests the importance of using developmental trajectories for this purpose (Adair, 2008). In
1 defined as an increase in weight Z-score exceeding 0.67 SD between birth and two years,
the present study, we use repeated measures of height and weight from 5 months to 8 years, in order to identify distinct patterns of BMI among a population sample of children. Specifically, we estimated group-based developmental trajectory models of BMIs.
A developmental trajectory depicts the course of a trait or behaviour across time (Nagin, 1999). Very few studies have applied this technique to the
progression over time, of child overweight and obesity. In fact, to our knowledge, only one other study has examined early life predictors for particular BMI
developmental trajectories in childhood (Li, 2007).
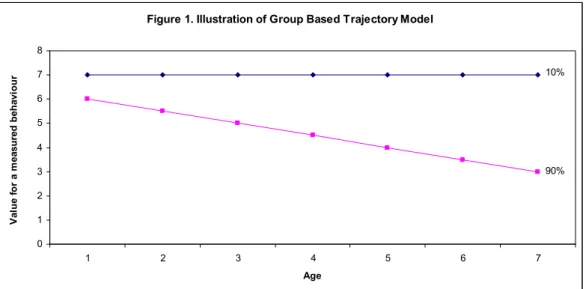
Figure 1 illustrates a hypothetical example of a trajectory.
Figure 1. Illustration of Group Based Trajectory Model
0 1 2 3 4 5 6 7 8 1 2 3 4 5 6 7 Age Va lu e fo r a m ea su re d b eh av io u r 10% 90%
Thus, a trajectory illustrates the relationship between a behaviour (Y axis) and time (X axis) for distinct groups of individuals having different
developmental levels and patterns that distinguish them (Nagin, 1999). In this example, two sub-groups are identified: 1) 10% of children follow an elevated, stable trajectory and; 2) 90% follow trajectories that are elevated at approximately 6 years, but that decline over time.
1.2 Purpose
The purpose of this project is to further our understanding of the development and early-life risk factors for child obesity, to explore a novel statistical technique for the study of child BMI, and to contribute additional knowledge regarding the development of overweight and obesity among children.
1.3 Objectives
The objectives of the present study are to: 1) Identify children in a large Canadian (Québec) population sample with distinct developmental patterns of BMI between 5 months and 8 years and 2) Identify early (perinatal) risk factors for membership in the atypically elevated group, as well as the between-group differences that may exist.
1.4 Hypotheses
We expect to identify a group of children with an atypically elevated BMI. We expect that certain early maternal health characteristics and behaviours, such as maternal smoking and elevated maternal BMI will be associated with
Childhood overweight and obesity is a multifactorial condition, with numerous predisposing risk factors (Reilly, 2005). Over time, a greater caloric intake than expenditure causes weight gain in humans, and may lead to
overweight or obesity. Genetic predisposition contributes to an individuals’ susceptibility for weight gain. However, as worldwide obesity levels have risen to epidemic proportions over the past two to three decades- a period wherein the gene pool has remained relatively stable (Kopelman, 2000)- it is increasingly believed that environmental and perinatal risk factors are more likely than genetic factors to underlie the current child obesity epidemic (Ebbeling, 2002).
This section focuses on an epidemiological and developmental perspective to the development of childhood obesity and will provide an overview of the numerous early potential risk factors for obesity.
2.1 Developmental Theories and Fetal Origins Hypotheses
of Adiposity
In the prevention of obesity, it may be important to identify and to target specific “critical periods” of obesity development in childhood (Rolland-Cachera, 2006). These refer to the developmental stages in which physiological alterations increase the risk of later obesity (Dietz, 1997).
Increases in body fat occur at various life stages. In childhood, these include the perinatal period (from 22 completed weeks of gestation to seven days after birth, WHO, 1999), the adiposity rebound (approximately age 5-7), as well as adolescence/onset of puberty (Dietz, 1994, Zafon, 2007). Different theories
exist as to why body fat increases during these specified periods. An evolutionary approach points to a mechanism in place which stores fat just before periods where the body will undergo stress in order to promote survival (Adair, 2008, Zafon, 2007). For example, as an infants’ food supply undergoes two transitions- from placental nutrition to lactation, and then from lactation to solid food- the fat that is accumulated late in gestation may serve to protect the infant from an interrupted supply of energy to the brain (Zafon, 2007). In terms of obesity development, these periods of fat accumulation may be considered problematic in today’s obesogenic environments which provide a reduced opportunity for losing this extra body fat. These periods thus create a positive energy balance and may promote overweight/obesity among youth (Adair, 2008).
The “fetal origins” hypothesis suggests that shifts in the nutrition and endocrine status of a fetus will bring about changes in its’ development which may cause permanent structural, physiological and metabolic changes for the individual, possibly increasing disease risks in adulthood (Barker, 1995). “Programming” is the term used to designate this process, whereby a stimulus occurring at a critical period in development entails a long-term effect on an individual’s health (Barker, 2001, Breir, 2001). It is the systems’ plasticity and sensitivity to its’ environment during these particular periods which allow it to adapt in this way (Barker, 2001). An alteration in gene expression is thought to occur as a result of this adaptation (Breier, 2001). Recent evidence points to the leptin and insulin endocrine systems as being most influential in obesity and metabolic disorder programming. This may be due to the programming of appetite regulation and hyperphagia, but further research is needed to determine the
this plasticity is lost, for the system is no longer able to make such adaptations (Barker, 2001).
2.1.1 The Barker Hypothesis
A growing body of both epidemiological and experimental evidence suggests that the prenatal period is a particularly sensitive period for later health outcomes. The “Barker hypothesis” (or “thrifty phenotype” hypothesis) is a theory suggesting that early-life metabolic adaptations may aid in survival by selecting an appropriate trajectory of growth in response to environmental cues (Hales & Barker, 2001). In the 1970’s, Barker and colleagues observed that, in areas with a high prevalence of low birth weight babies, there was also an increase in the incidence of cardiovascular disease (CVD). Most of Dr. Barkers’ studies examined maternal undernutrition during pregnancy. It was thought that the baby’s development changed as a consequence of poor maternal nutrition,
increasing their CVD risks (Barker, 1995). Subsequent studies have found similar associations with metabolic disorders and related conditions, and have revealed that the increased risks for diseases such as type 2 diabetes and hypertension in adulthood due to small size at birth may only be seen, or at least intensified, for those who become obese (De Boo & Harding, 2006, Kinra, 2005, Kopelman, 2000, Ong, 2000).
The Barker hypothesis is now widely accepted, and causes concern for societies in transition from poor to better nutrition (Hales & Barker, 2001, Robinson, 2001). This is because those who undergo pre-natal and early life adversities may develop this thrifty phenotype, and in the case where these individuals actually go on to develop in an affluent environment; their risk for developing metabolic disorders, such as obesity and type 2 diabetes may be
enhanced. Conversely, those who developed amid positive perinatal conditions will likely be better able to cope with heavier diets (Robinson, 2001). In Western societies, where severe maternal undernutrition is more rare, it has been observed that the offspring of women who had been previously diagnosed with an eating disorder may have an increased risk for preterm, low birthweight and small for gestational age (SGA) births. These findings suggest a possible thrifty phenotype in Western societies as well (De Boo & Harding, 2006, Conti, 1998, Thame, 1997, Godfrey, 1994).
2.2 Measuring Overweight and Obesity using the BMI
Body Mass Index (BMI), calculated as an individual’s weight in kilograms divided by the square of their height (BMI=kg/m²), is a measurement tool used to assess one’s body composition. It is a proxy measurement for more sophisticated and reliable tools, such as Dual Energy X-ray absorptiometry (DEXA) and Bioelectrical Impedance. Currently the best available anthropometric estimate for public health purposes (Hall & Cole 2006), it has been instrumental in
documenting the recent worldwide increase in the prevalence of obesity
(Schousboe, 2003). This is because these measures can be readily obtained, with reasonable precision in a variety of settings and for large numbers of individuals (Troiano & Flegal, 1998). Among adults, BMI has been estimated to correlate at 0.9 with body fat measured by bioelectrical impedance (Schousboe, 2003,
unpublished doctoral thesis).
In childhood, BMI changes substantially with age, from a median as low as 13 kg/m² at birth, increasing to 17 at age 1, and decreasing to 15.5 at age 6. (Cole, 2000). Different rates of change occur at different ages and these changes
are age and sex specific (Troiano & Flegal, 1998, Wang, 2004). Biological
differences in body composition also exist between ethnic groups and populations that may complicate the interpretation of BMI (Wang, 2004).
BMI has been shown to predict morbidity and mortality in a strong, graded relationship (Willet, 1999, Manson, 1995). However, other measures of adiposity should also be considered as indicators of risk. For instance, the waist-to-hip ratio (WHR) may be an important indicator of central obesity (Esmaillzadeh, 2004), which has been linked to increased cardiovascular disease risk. The measurement of waist circumference (WC) is also a useful, although possibly crude, measure of increased central obesity (James, 2001) and its’ associated health risks. A
Canadian study by Dobbelsteyn and colleagues (2001) used receiver operating characteristic (ROC) curves as well as sensitivity, specificity and positive and negative predictive values with respect to predicting the presence/absence of CVD risk factors, in order to compare WC, WHR, and BMI for their ability to identify individuals with these risk factors. They in fact concluded that WC is most likely the best single anthropometric measurement to use when identifying individuals with cardiovascular disease risk factors.
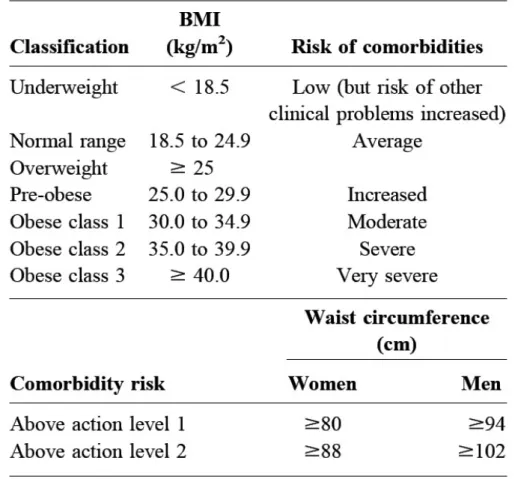
On the following page are the WHO classifications for BMI and waist circumference with cut-off points to delineate different levels of risks. When taken together, these two measures may provide a more global estimation of an individual level of health risks than either of the indices alone.
Table I. WHO Classification of Obesity, Waist Circumference and Associated Comorbidity Risks
2.3 BMI Growth Curves
For adults, the cut-off points used to distinguish between “normal”, “overweight”, and “obese” have been defined as a function of their association with disease risk. In children, the relationship between BMI and increased disease risk is less clear. The BMI values of children are lower than that of adults and change with age as the child is developing. As these adult cut-off values are not appropriate for children, percentile growth curves have thus been developed in order to track overweight trends throughout childhood. These were initially
developed based on National Survey data, such as the widely used CDC growth charts based on the US National Health and Nutrition Examination Survey (NHANES) data.
In order to increase generalizability, the IOTF (International Obesity Task Force) has created age and sex-specific curves using data from 6 large, nationally representative surveys. The curves were extrapolated from the adult cut-off BMI values for increased disease risk, and percentiles have been assigned, in order to represent an increased risk among children as well (Cole, 2000). However, these may lack precision, as the relationship between adult and childhood risk is yet unclear (Cole, 2000, Wang 2004).
Similar to other existing growth curves, the IOTF curves have been developed from cross-sectional data, which is less useful for explaining growth and development (Cole, 2000). Nevertheless, the curves developed by Cole et. al of the IOTF are now widely cited and will facilitate international comparisons (Wang, 2004).
2.4 BMI Trajectories
A developmental trajectory depicts the course of a trait or behaviour across time (Nagin, 1999). Growing evidence suggests the importance of tracking the development of overweight and obesity, as well as detecting early life risk factors. Developmental trajectories of overweight among youth represent an innovative approach towards our understanding of this epidemic (Adair, 2008). Very few studies have examined developmental trajectories of BMI beginning in early childhood thus far. In 2007, Li et al identified three distinct overweight trajectories for children between the ages of 2 and 12 years: early onset
overweight, late onset overweight, and never overweight. In addition, they were the only researchers thus far to examine early life predictors in association with atypical BMI trajectory groups (Li, 2007). Their results indicate that male gender, black ethnicity, elevated maternal BMI or maternal weight gain during pregnancy, and child birthweight are significantly associated with the early-onset overweight trajectory. All of these factors, except maternal weight gain, were also associated with late onset overweight, as well as maternal smoking and birth order (3rd or more). Breastfeeding more than 4 months was identified as a protective factor against both overweight categories.
However, the trajectory method used in the Li (2007) study was not group-based, as was ours. Rather, it utilized a latent growth mixture model and data from the National Longitudinal Study of Youth (NLSY79) in the United States. Our study will contribute new information on the development of BMI among a representative, non-US sample.
2.5 Early-Life Risk Factors for Obesity
2.5.1 Child Risk Factors
Birth Weight
The in utero environment is thought to play an important role in the development of obesity (Dietz, 1997, Rogers, 2003, Oken & Gillman 2003). (Hales & Barker, 2001), and birth weight can be an important consideration when studying illnesses related to the “critical periods” or “thrifty phenotype”
Birth weight is most often found to be positively correlated with later overweight and obesity (Adair 2008, Baird, 2005, Eriksson, 2001, Hirschler, 2008, Rogers 2003, Oken & Gillman, 2003). However, a review by Rogers and colleagues (2003) suggests that, while an independent association may exist between birth weight and child overweight, the association with adult
overweight/obesity has most often been attributable to parental BMI, raising the question of whether it is genetic factors or the intrauterine environment that is responsible for the link. Authors of a review in that same year (Oken & Gillman, 2003) come to a similar conclusion, and state that it is most likely a combination of both genetic and early pre- and post-natal factors mediating the link between birth weight and future obesity.
Low birth weight is defined by the WHO as a birth weight less than 2500 g (WHO, 2001), and may be due to being born pre-term (<37 weeks gestation) or to being small for gestational age (SGA), or both (Euser, 2008). Certain studies identify low birth weight as also being associated with an increased risk of obesity (Ong, 2002). Others have recently investigated the hypothesis that birth weight may not only be linked to later overweight/obesity status or BMI, but also to body composition. Singhal et al (2002) found that low birth weight, representing poor fetal growth, may program a reduction in lean body mass. A review study by Oken & Gillman (2003) concluded that, while high birth weight is most often associated with an increased BMI in child and adulthood, many studies have found an important association between low birth weight and future central
obesity, a condition that increases one’s risk for cardiovascular disease. Insulin, as well as neurological endocrine and vascular changes are all considered possible mechanisms that may mediate the associations between either low birthweight and
future central obesity or high birthweight and future high BMI; however, future studies are needed to clarify how these factors come to play in each case (Oken, 2003).
It is clear that several confounding factors need to be considered when examining the association between birth weight and obesity. For example, low birth weight may occur due to extreme intrauterine conditions that constrain growth, such as maternal smoking during pregnancy (Kramer, 1987), which in turn may be followed by rapid growth in early infancy. Both the latter two events have also been linked to obesity in later life and will be discussed further on. Twin studies have been used to examine some of the factors confounding low birth weight, since many of these factors are similar between identical twins (eg. gestational age, genetics). These studies tend to report a significant association between birthweight and future weight or height, but not necessarily BMI (Oken, 2003). However, this may possibly be explained by a lack of variability between twin subjects to detect any differences in the variables being examined (Oken, 2003).
It is important to keep in mind that low birth weight is not a perfect measure of fetal development. There are pre-natal factors that can impact on the health of the fetus without affecting birthweight. In addition, birthweight does not distinguish between a shortened gestation (pre-term birth) and adversities in fetal growth (i.e.: a baby may weigh less than 2500 g at birth either because it is born too soon, or because it is small for its gestational age) (WHO, 2001).
Rapid Growth in Infancy
As mentioned previously, rapid growth in infancy (also known as “catch-up growth”) can be defined as the increase in weight Z-score exceeding 0.67 SD, between birth and two years. This represents the upward crossing of major percentile lines of a usual growth reference (Ekelund, 2006, Ong, 2000). It may, but not necessarily, occur to compensate for intrauterine growth restriction (Adair, 2008), but by two years of age, growth will normally begin to follow the genetic trajectory (Ong, 2000).
While the effects of rapid growth are difficult to isolate, due to the fact that infancy weight gain is related to both intrauterine and post-infancy growth (Adair 2008), numerous studies report significant positive associations between rapid growth in early life and overweight in later child or adulthood, with seemingly greater risks the longer a child is exposed to rapid weight gain (Baird, 2005, Ong & Loos, 2006). For example, a recent review study found an overall 60% increase in obesity risk if the duration of rapid weight gain is increased from 1 to 2 years (Ong & Loos, 2006). Results from a prospective cohort study of 848 full-term singletons (10% random sample of the Avon longitudinal study of pregnancy and
childhood, a geographically defined birth cohort in Bristol county, England)
suggest that factors which may predict the rapid growth of the child include children having a lower weight, length or ponderal index at birth, primiparous pregnancies, maternal low birth weight, as well as maternal smoking during pregnancy (Ong, 2000). In addition, 30.7% of the sample of children who demonstrated clinically significant catch-up growth (as defined by a gain of greater than 0.67 SD score between birth and two years) was found to have
significantly higher values for BMI, percent body fat, and waist circumference at five years (Ong, 2000).
It has been postulated that certain factors which signal and regulate postnatal catch-up growth may also play a role in the mechanisms underlying the fetal origins hypothesis (Ong, 2000, Singhal, 2003). The programming of later insulin resistance is an example. After finding that rapid growth in infancy was associated with later insulin resistance (after controlling for birth size), Singhal and colleagues (2003) emphasize the importance of postnatal, as compared to intrauterine growth.
Adiposity Rebound
Adiposity rebound is a term used to designate the time when a child’s body mass index (BMI) begins to increase after the nadir that normally occurs at 5 or 6 years of age, when a child’s body fatness is at a minimum (Whitaker, 1998). Early AR is associated with a faster rate of gain of fat mass and skeletal maturity (Rolland-Cachera, 2006). An early adiposity rebound (AR) is a risk factor for overweight because it indicates that the child’s BMI centile is high and/or crossing upwards, and for these children, an elevated BMI in later childhood and adulthood is likely (Cole, 2004). It is perhaps a much better predictor of adult overweight and obesity than childhood BMI, which may poorly predict adult adiposity before the occurrence of the AR (Rolland-Cachera, 2006). In a
retrospective cohort study by Whittaker and colleagues (1998), adult obesity was significantly associated with early AR (OR=6.0) after adjusting for parental BMI and BMI at AR. A study of obese children showed that the mean age of AR in obese individuals is at 3 years old compared to 6 years old among the general
population (Rolland-Cachera, 2006). An association between an early age of AR and an elevated BMI in adolescence has also been demonstrated (Prokopec, 1993).
Overall, the role of the timing of the AR remains controversial. According to Dietz (2000), it may account for up to 30% of the proportion of adult obesity that begins in childhood, yet several concerns remain to be investigated. In terms of obesity prevention, it is not yet clear how our knowledge of the AR will help public health efforts, as it may be genetically programmed-an inherited
susceptibility to obesity- or it may be due to environmental influence, and therefore modifiable (Whitaker, 1998)
Sleep Duration in Early Childhood
The recent increases in overweight and obesity prevalence are occurring simultaneously with a decrease in individuals’ sleep time (Capuccio, 2008). Over the past 50 years, average sleep time in the United States is estimated to have been reduced by 1.5-2 hours (National Sleep Foundation, 2005).
Recently, the association between short sleep duration in childhood and the development of obesity from child to adulthood has been shown in several epidemiological studies. Indeed, a meta-analysis of cross-sectional concluded that an increased risk of obesity exists among short sleepers in both children (pooled OR= 1.89) and adults (pooled OR= 1.55) (Capuccio, 2008). Due to the cross-sectional nature of these studies and the lack of control for confounding factors, these results do not allow the inference of causality. However, a longitudinal study performed in Quebec using QLSCD data also found that children who slept less than 10 hours nightly during early childhood had a significantly increased risk
for developing overweight or obesity by school entry (6 years). Many potentially confounding factors, such as parental obesity, were controlled for in this study. (Touchette, 2008).
Possible mechanisms for the association between short sleep and obesity include: 1) the activation of hormonal responses, such as changes in leptin and ghrelin levels, which may lead to an increase in appetite and caloric intake
(Vgontzas, 2003); 2) The activation of inflammatory pathways which may also be implicated in the development of obesity (Miller, 2007); and 3) the possibility that short sleep occurs preferentially among individuals with unfavourable health status and lifestyle characteristics (Patel, 2006).
2.5.2 Maternal Behaviours and Health Characteristics
Infant Feeding
Studies suggest that infants are often overfed (Adair, 2008) or that they are fed solid foods earlier and in greater amounts when the child is perceived as having a difficult temperament (Bentley, 2006). Both of these activities may contribute to overweight or obesity when the amount fed to the child is consistently greater than that child’s energy needs.
Breastfeeding is a potential protective factor against overweight. However the studies examining breast feeding as a protective factor are presently
inconclusive, due in part to methodological concerns such as the lack of control for confounding risk factors (Adair, 2008, Araujo, 2006, Armstrong, 2002).
Possible biological mechanisms by which breastfeeding may protect against obesity include: i) the learned self-regulation of energy intake, because in
comparison to a bottle-fed baby, a breast-fed baby is better able to control the amount of milk consumed based on internal satiety clues, ii) metabolic imprinting. For example, the properties of breast milk (low in protein and high in fat), may protect against future obesity, for high protein intakes in early infancy are thought to stimulate the secretion of insulin and insulin-like growth factor 1, two
substances that may be involved in accelerating growth and enhancing adipogenic activity and adipocyte differentiation (Koletzko, 2005), potentially resulting in a greater than normal weight gain (Rolland-Cachera, 1995). In addition, infants fed a low-fat diet may program thrifty genotypes that predispose them to later weight gain (Rolland-Cachera, 2006).
Generally, reviews find a weak to moderate, dose-response protective effect of breastfeeding on later overweight/obesity (Adair, 2008). Owen et al (2005) examined sixty-one studies and concluded that breastfeeding does protect against obesity, but the author stressed the importance of future studies that will more adequately consider important confounding factors, such as maternal obesity and low socioeconomic status.
An interesting finding to note is that, according to a recent study by Buyken et al. (2008), breastfeeding may act as a moderating factor which offsets the strong influence of maternal overweight on her child. However this result was only applicable to males.
Smoking During Pregnancy
Several studies have linked smoking during pregnancy with an increased risk of child (Leary, 2006, Mizutani, 2007, Reilly 2005, Toschke, 2002) and adult (Power & Jefferis, 2002) obesity. It seems that a dose-response relationship exists,
with increased maternal cigarette smoking during pregnancy leading to a greater risk for obesity in children and adults (Power & Jefferis, 2002). Maternal smoking is said to restrict fetal growth (Adair, 2008), leading to a lower birth weight, which has also been associated with the development of obesity. This may be due to the compensatory rapid postnatal catch up growth that occurs (Ong, 2006). Another possible mechanism by which smoking may affect fetal growth is in the programming of appetite regulation (Von Kries, 2002).
A longitudinal study of the 16 766 individuals born in 1958 in England, Ireland and Whales (British Birth Cohort) for whom smoking information was available found that infants whose mothers smoked during pregnancy had a lower birth weight yet a greater chance of being in the highest weight decile at ages 11 and 16 years (Power & Jefferis, 2002). Dubois & Girard (2006) demonstrated a similar association with the children of the QLSCD cohort. Their analyses however revealed that it is not necessarily the combination of smoking with low birth weight and rapid early weight gain that has an effect on future obesity. In this study, the children born to mothers who smoked during pregnancy, had an increased risk of obesity at 4.5 years, but they were not of low birth weight. They were rather of “normal” birth weight with a rapid weight gain from birth to 5 months, or of “high” birthweight, with slower weight gain from birth to 5 months.
Maternal Overweight and Obesity
The link between maternal and child overweight or obesity may be attributable to genetics or shared familial characteristics. With age, parental influence on lifestyle characteristics, such as food choices and physical activity, become increasingly important (Adair, 2008). As our study is looking at very
early child risk factors, we will review some of the evidence regarding genetic factors in the present section.
An important genetic component seems to exist in the variation in BMI; however the extent of this influence is unclear (Haworth, 2008). Results from twin studies range from 50-90% heritability of BMI (Maes, 1997). There is also evidence to support that a common etiology exists between what are considered normal variations in BMI and clinical obesity levels (Haworth, 2008).
The “thrifty genotype” hypothesis, originally proposed by Neel (1962), states that populations who were once frequently threatened by starvation may have developed genes to protect against this threat and promote survival. In today’s obesogenic environment- that is, an environment favouring positive energy balance- these same genes may predispose an individual to obesity (Bell, 2005). Certain populations, such as the well-studied Pima Indians of Arizona, are disproportionately affected by obesity and type 2 diabetes. It was proposed that this may be explained by such an adaptation of their genes (Joffe & Zimmet, 1998).
Certain studies have identified that correlations between parental and child overweight are not significant in infancy (Stunkard, 1999, Safer, 2001). In a prospective longitudinal study of infants with mothers who were obese, no correlation was found between the body weights of mothers and their offspring before two years of age (Stunkard, 1999). The authors believe this result
corroborates the literature, and that overall, the relationship between maternal and child weight is greater at birth than in the first two years of life. Furthermore, Safer and colleagues (2001) did not observe a correlation between parental and
child overweight until the age of seven years, however it was impossible to determine whether this was due to genetic or environmental factors.
Some evidence relates maternal obesity to increased adult risk for
cardiovascular disease through mechanisms related to the fetal origins hypothesis (Godfrey & Barker, 2000). The fetal nutrient intake may be unbalanced due to excess sugar provided by overweight mothers (Barker, 2001). Men who were born to women who were obese during pregnancy were found to have a greater
incidence of CVD in adulthood (Forsen, 1997). Furthermore, the offspring of short mothers who were obese showed disproportionately greater incidence of CVD, suggesting that a restrained fetal environment may have played a part in this link (Forsen, 1997, Godfrey & Barker, 2000).
Maternal Diabetes
A mother with Gestational Diabetes Mellitus (GDM) or Type 2 Diabetes has increased glucose, lipid and amino acid concentrations in her blood, which is then delivered to the fetus (Catalano, 2003). This leads to fetal hyperinsulinemia, increased production of growth factors, higher birth weight, and a larger fat mass of infant (Catalano, 2003). Due to confounding, it is difficult for studies to
determine whether infants of diabetic mothers have a higher risk of obesity or not. For example, when controlling for maternal BMI, the association between
maternal diabetes and child overweight is often attenuated (Gillman, 2003).
Maternal Depression
Among adolescents and adults, links between obesity and depression within the same individual have been established (Dong, 2004, Dragan, 2007,
Stunkard, 2003), suggesting that a common etiology or genetic vulnerability may exist. The association between maternal depression and obesity in her child is less clear, for few studies have been done on this topic. In a cross-sectional study of 589 pairs of mother and child from low-income urban communities in northeast Brazil, Surkan et al. (2008), found a significant association between maternal depression and offspring obesity. However, while the study did control for numerous SES factors, and factors related to child growth, they failed to control for maternal BMI, which could represent a confounder in the association found. The cross-sectional nature of the study also leaves us far from being able to infer causality. Another cross-sectional study (Gibson, 2007) examined 329 children aged 6–13 years (192 healthy weight, 97 overweight and 40 obese), and 265 mothers. No association between maternal depression and child obesity was found. Similarly, in the longitudinal, ecological study of children’s home environments (O’Brien, 2007), no association between maternal depression and child overweight/obesity was found, however it is interesting to note that the mothers sensitivity and opportunities for productive activity at home were found to be significant in this study, two factors wherein maternal depression could be thought to have an impact. The O’Brien (2007) study also failed to control for maternal BMI. It is evident that more longitudinal studies are needed to examine the link between maternal depression and child BMI, which control for maternal BMI in addition to other potentially confounding variables.
2.5.3 Family Risk Factors
Socioeconomic Status as a Risk Factor
Socioeconomic Status (SES) is often defined in terms of a combination of three factors: occupation, education and income. In 1989, Sobal and Stunkard (1989) performed a vast review of the literature on the obesity-SES association, from approximately 1960 to 1985. Their main findings included the existence of an inverse relationship between obesity and SES among women in developed societies, with increasing SES being associated with a decreased prevalence of obesity among women. They also found a strong direct relationship between these two factors for men, women and children in developing societies, with higher SES being associated with higher obesity rates. An updated review of the obesity-SES relationship (Maclaren, 2007) which set out to build on Sobal and Stunkards’ previous influential work sheds light on the present-day association between obesity and SES. In general, it appears that, in lesser developed countries, there are increased positive associations between SES and obesity. In highly developed countries, this association is reversed, particularly among women. That is, women of higher SES tend to be thinner in developed countries. These results were similar but less striking than the conclusions obtained by Sobal and Stunkard in 1989; they have perhaps been attenuated due to the effects that economic growth, modernization and globalization have had on individual societies (Maclaren, 2007).
For children in industrialized, economically developed countries, being in a family of low SES increases the risk of obesity (Sobal & Stunkard, 1989, Wang, 2001) however this association may also be weakening with time (Adair, 2008). A cross-national comparison of the relationship between child obesity and SES
identified distinct differences between countries. For example, children of higher SES in China and Russia were found to be more likely to be obese, whereas children of lower SES in the US seem more likely to be obese (Wang, 2001). In certain developing countries undergoing the nutrition transition2 children are often suffering from malnutrition and underweight alongside adults suffering from obesity, within the same household (Caballero, 2005).
Family functioning
O’Brien and colleagues (2007) emphasize the need for further research into how family processes may be related to child obesity. Results from this longitudinal study indicate that parenting style, including mothers’ sensitivity and degree of control, are important predictors of child obesity, with less sensitive and more controlling behavior positively associated with child overweight. Similar results were previously found in a study by Rhee et al. (2006). However, the cross-sectional study by Gibson (2007) found no association between poor general family functioning, as reported by the mother, and later child overweight/obesity.
2.6 Summary of Previous Findings
Although awareness has increased regarding the importance of
understanding perinatal risk factors for the prevention of obesity (Ebbeling, 2002, Reilly, 2005), there remain numerous gaps in the literature in this regard, and most recognized risk factors are potential rather than confirmed (Reilly, 2005). Many of the existing studies on early risk factors for obesity have been
2 Shift from under- to over-nutrition problems in developing countries (Wang & Lobstein, 2006)
alongside shift in dietary and exercise patterns over the past 20 years (Popkin & Gorden-Larsen, 2004).
sectional, underpowered or unable to consider numerous risk factors
simultaneously or to account for confounding variables (Parsons, 1999, Dietz, 2001). For example, we have seen that the numerous studies on the protective role of breastfeeding have not adequately considered confounding risk factors (Adair, 2008, Araujo, 2006, Armstrong, 2002), and there exists a need to disentangle the effects of low birthweight from maternal smoking during pregnancy and rapid growth in infancy, all interrelated and confounding factors. Other potential risk factors have not received enough attention to date, such as the association between maternal depression and child obesity, as well as how family processes may be related to child obesity (O’Brien, 2007).
Another important yet understudied area is the distinct developmental path that a child’s level of adiposity may follow (Adair, 2008, Li, 2007). The
frequently used cross-sectional design for studies on childhood obesity has not allowed for the identification of distinct developmental patterns (Mustillo, 2003). The Cole curves to delineate obesity are useful; however, as the relationship between BMI and increased disease risk is unclear (Cole, 2000, Wang 2004), it is important that new methods for examining the development of child obesity be investigated.
According to the “Barker hypothesis”, early-life metabolic adaptations may aid in survival by selecting an appropriate trajectory of growth in response to environmental cues (Hales & Barker, 2001). In the present study, we take a closer look at many early life factors, as well as the trajectories of BMI development which follow. Since this study is a non-US birth cohort, longitudinal in nature, and able to investigate numerous perinatal risk factors simultaneously, it has the potential to make an important contribution to the existing literature.
3.1 Study Design and Participants
The present study is a secondary analysis of data drawn from the Quebec Longitudinal Study of Child Development (QLSCD). A random population sample of families with a 5-month old infant in the year 1998 was recruited in the Canadian province of Quebec (n=2120). The participants were recruited via the Quebec Master Birth registry managed by the Ministry of Health and Social Services. Trained interviewers conducted yearly interviews in the home with the mother or “Person Most Knowledgeable” about the child (PMK), the mother in 98% of cases. The first interview was conducted in 1998, when the baby was approximately 5 months old. Interviews were then conducted yearly until the child reached the age of 8 years. Information was gathered regarding family
characteristics, parental, and child behaviors. At every data collection, informed written consent was obtained from all participating parents (Appendix A & B: letter to parents and consent form). The larger QLSCD study has been previously approved by the Ethics committee of Santé Québec (Appendix C). The present study was approved by the Ethics Committee of the Faculty of Medicine of the University of Montreal (Appendix D).
3.2 Attrition Analyses
Longitudinal height and weight data (over 5 time points) was available for 1957 of the 2120 children (Attrition Rate: 7.69 %) to be included in the group-based developmental trajectory estimations. Therefore, the analyses sample included 1957 participants. Socioeconomic Status differed between the children
included and not included in the trajectory models. Specifically, mothers with a lower level of education and with lower income were less well represented in the analyses sample. However, all analyses used weighted scores to ensure that the analysis sample was representative of the target population even though attrition occurred. Table II represents the demographic characteristics of the participating families.
Table II. Demographic Characteristics of Sample at 5 months (n=1957)
%
Sex of child (girl) 49.7
Ethnic Origins Canadian 65 French 26.5 Irish 4.5 Indian 2.7 British 2.6 Italian 2.6 Scottish 1.7 Other* 7,5
Mother Obtained High School Diploma 82.8 Family Income <$15,000 11.6 $15,000-30,000 17.6 $30,000-60,000 40.5 >60,000 30.2 Mean SD
Mother's Age (years) 26.69 8.906
* "Other" includes all categories of ethnic origin with less than 1% membership
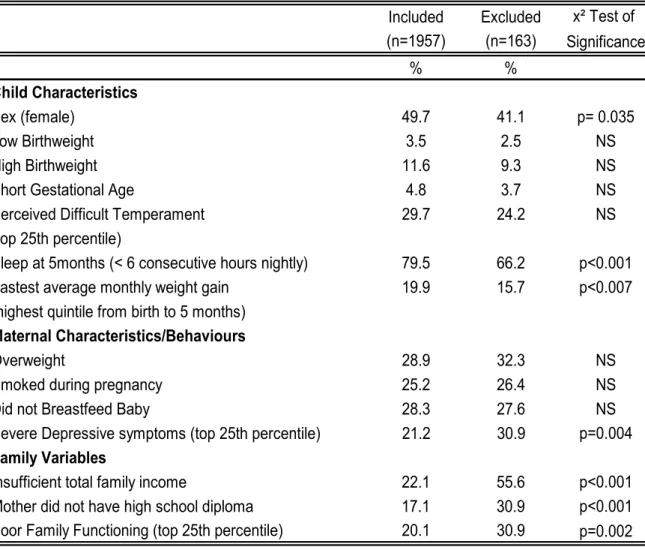
Table III examines differences between the included and excluded families for a variety of variables deemed pertinent by our literature review. In doing so, we see that, not only are families of lower SES less well represented in the trajectory groups, but also those with decreased levels of family functioning, and
with mothers who experience greater levels of depressive symptoms. On the other hand, children who experience less sleep at night and faster early weight gain (two of the identified potential risk factors for later obesity) are more well-represented in our trajectory groups than in the group that was excluded due to a lack of longitudinal data.
Table III. Attrition Analyses: Comparison of Characteristics-Included and Excluded Families
Included Excluded x² Test of (n=1957) (n=163) Significance % % Child Characteristics Sex (female) 49.7 41.1 p= 0.035 Low Birthweight 3.5 2.5 NS High Birthweight 11.6 9.3 NS
Short Gestational Age 4.8 3.7 NS
Perceived Difficult Temperament 29.7 24.2 NS
(top 25th percentile)
Sleep at 5months (< 6 consecutive hours nightly) 79.5 66.2 p<0.001
Fastest average monthly weight gain 19.9 15.7 p<0.007
(highest quintile from birth to 5 months)
Maternal Characteristics/Behaviours
Overweight 28.9 32.3 NS
Smoked during pregnancy 25.2 26.4 NS
Did not Breastfeed Baby 28.3 27.6 NS
Severe Depressive symptoms (top 25th percentile) 21.2 30.9 p=0.004
Family Variables
Insufficient total family income 22.1 55.6 p<0.001
Mother did not have high school diploma 17.1 30.9 p<0.001 Poor Family Functioning (top 25th percentile) 20.1 30.9 p=0.002
3.3 Measures
Group based trajectories of BMI (Dependant Variable)
Measures of height and weight were obtained yearly during the interview with the PMK. The data collected when the child was 5 months of age through to 5 years was by maternal report, and is found in the Computerized Questionnaire
Completed by the Interviewer (ELDEQ, 2000). Specifically, mothers were asked
“What is his/her height in feet and inches or in metres/centimetres (without shoes on)?” and “What is his/her weight in kilograms (and grams) or pounds? (ELDEQ, 2000). At 5 years, this information was obtained through a telephone interview with the PMK, as part of the Paper Questionnaire Completed by the Interviewer (ISQ, 2007). At 6, 7 and 8 years, this data was obtained during the Physical
Health Evaluation, through anthropometric measurement of the child by the
trained interviewer using standard procedures adapted by the ELDEQ team from the ESSEA (l’Enquête sociale et de santé auprès des enfants et des adolescents
québécois, 1999) study (ISQ, 2007).
The height and weight variables were validated using the CDC growth charts (NCHS, 2000), and aberrant data was removed. For example, QLSCD statisticians verified whether the responses for height and weight were appropriate given the minimum and maximum cut-offs defined by the CDC curves (ISQ, 2001).
BMI was calculated using the equation BMI=kg/m². Group-based trajectories of BMI were then modelled using the SAS Proc Traj program (SAS version 9.1.3) and the data from the resulting trajectories was used to form the 3-category dependant variable indicating group membership.
Starting in 2002 (age four), the exact age of the child at data collection became less precise because all children began to be measured at roughly the same time of year in order for the data collection to be synchronized with the school system. Children’s ages could therefore potentially vary up to one year from one another (ISQ, 2003), however it was not possible to take this into account in trajectory group modelling.
Risk Factors (Independent Variables)
Potential risk factors were chosen based on evidence of associations in the existing literature as well as plausible hypotheses. We have chosen to analyze early life risk factors, including relevant factors in the prenatal period and infancy (before two years of age). This is a logical cut-off for the present study, not only because it aids in providing clarity to the research question, but also because a distinct parting in children’s BMI is observed at approximately this time point (~2.5 years). That is, the atypically elevated BMI trajectory group and the other two trajectory groups (obtained in the first phase of analysis) became highly distinct (i.e. raising versus flat) after 2 ½ years. Unless otherwise specified, all variables used were obtained during the home interview with the PMK when the child was 5 months of age.
Child Characteristics
Sex: The sex of the child was obtained from hospital records and coded as a dummy variable (boy= 1, girl=0).
Birthweight: obtained from hospital records and transformed into a 3-category variable representing low (<2500 g), normal (2500-4000 g) and high
birthweight (>4000 g). This categorisation represents a common way to characterize birth weight in newborns (Hirschler, 2008, WHO, 2001).
Birth order: Birth order at 5 months was obtained via maternal questionnaires. The mother was asked how many children she had had before the birth of the child participating in the study. A 3-category variable was created, indicating if the child was 1st born(=0), 2nd born (=1), or 3rd or later (=2) (Li, 2007, Reilly, 2005).
Gestational Age was obtained from hospital records. A variable contrasting preterm births (<37 weeks = 0) from the rest of sample was created (Reilly, 2005, WHO, 2001).
Difficult temperament: Difficult temperament was assessed via a questionnaire to the PMK. Seven items, taken from the widely used and well-validated Infant
Characteristics Questionnaire (John Bates, University of Indiana) formed the
scale at age 5 months (1998). It is a renowned and widely used scale, considered to be the best measurement tool for this variable in population studies (ISQ, 2003).Scores were afterwards standardized to a 10 point scale, with higher values representing a more difficult temperament. For this study, a variable contrasting the top 25th percentile (=1) from the rest of the sample (=0) was created. Sleep
duration: The child’s consecutive sleep duration at 5 months was divided into 2
categories (< 6 consecutive hours nightly=0, > 6 hours = 1) (Touchette, 2005, 2008).
Average weight gain from birth-5 months: There has been a recent narrowing of focus from growth acceleration in the first two years to the first few weeks of life (Kinra, 2009). This variable is intended to assess rapid early life weight gain, and was calculated using the equation: (weight at 5 months)/(weight at birth) /(Age at
5 months-Age at birth (0) ). The variable was then divided into quintiles and the two highest quintiles (=1) were compared to the rest (=0).
Maternal Health Behaviours and Characteristics
Smoking during pregnancy: Smoking during pregnancy was treated as a dummy variable indicating whether the mother reported smoking (=1) or not (=0) during pregnancy.
Maternal BMI: Mothers reported their height and weight when their baby was 17 months old. BMI was calculated using the equation BMI=kg/m². A dummy variable was created to distinguish mothers with a BMI 25 kg/m² (=1), representing overweight or obesity, versus those with a BMI <25 kg/m² (=0), which includes individuals of normal or low weight (Cole, 2000).
Depressive symptoms (when the child was 30 months olds): A reduced version (12 questions) of the CES-D depression scale was used (Radloff, 1977).This scale measures both the frequency of depression in a population, as well as the
occurrence and severity of depression in an individual the week prior to the interview. A variable contrasting mothers with more severe depressive symptoms (top 25th percentile=1) from the rest of the sample (=0) was created (O’Brien, 2007).
Breastfeeding (assessed when the child was 17 months old): A 3-category breastfeeding variable was created (did not breastfeed=2, less than 3 months=1, and more than 3 months=0), as a dose-response relationship between
breastfeeding and reduced levels of overweight has been observed in the literature (Von Kries, 1999, Harder, 2005),
Initiation of Solid Foods: Mothers were asked at what age their child started receiving solid foods. The variable was divided into <4 months (=1), >4 months (=0) (Bronner, 1999).
Young Mother: Mothers were asked their age at the birth of their first child. A “young mother” was defined as a mother who was 21 years of age or less at the birth of her first child, and was coded as 1=young mother and 0=not.
Family Characteristics
Socioeconomic Status (when the child was 5 months): Maternal Education and
Insufficient Income Status were used as measures of Socioeconomic Status. Maternal education was treated as a dummy variable indicating if the mother had
(=0) or not (=1) a high-school diploma. In the province of Québec, this
corresponds to the completion of mandatory schooling. Insufficient household
income was calculated according to Statistics Canada’s guidelines taking into
account the family income in the past year, the number of people in the household, and the family zone of residence (urban versus rural, population density). Income was coded as sufficient (0) or not (1).
Family functioning (when the child was 5 months old): Family functioning was assessed with an 8-item scale, developed by researchers of the
Chedoke-McMaster hospital (Chedoke-McMaster University) and widely used and validated in Canada and abroad. This scale measures the functionality of the family (eg.: “there are lots of bad feelings in our family”; “in times of crises, we can turn to each other for support”; “we don’t get along well together”). Mothers answered on a scale from 1 (strongly agree) to 4 (strongly disagree). Higher values indicate less functional households. The variable was re-coded into two categories
separating the top quartile (poor functioning) from the rest (below 75th percentile=0, 75th percentile and above =1).
Maternal immigrant status: Maternal immigrant status was treated as a dummy variable (immigrant=0, non-immigrant=1).
3.4 Summary of Data Analysis
The objectives of the data analysis were two-fold: 1) To identify
distinctive groups of developmental trajectories of BMI from 5 months to 8 years of age and; 2) To determine risk factors that predict a child’s membership in the atypically elevated trajectory group.
The analysis proceeded in two phases. First, the distinctive clusters of developmental trajectories were identified using a semi-parametric, mixture model (Nagin, 1999), and confirmed by a non-parametric algorithm, KML (Genolini & Falissard, 2009, submitted).Group-based trajectories were modeled using the SAS Proc Traj program and the procedure described below. Second, logistic regression analyses were used to examine the capacity of the risk factors to distinguish membership in the atypically elevated trajectory group as opposed to each of the other two trajectory groups, controlling for the levels of the other risk factors. Factors associated with membership in the moderate group were also explored.
3.5 Data Analysis, Phase 1: Trajectory Modeling
3.5.1 Trajectory Model Selection