UNIVERSITÉ DU QUÉBEC À CHICOUTIMI
MEMOIRE PRESENTE A
L'UNIVERSITÉ DU QUÉBEC À CHICOUTIMI COMME EXIGENCE PARTIELLE
DE LA MAÎTRISE EN INGÉNIERIE
PAR CANGJI SHI
INVESTIGATION AND CHARACTERIZATION OF FLUIDITY AND MICROSTRUCTURE OF RECYCLED AL-B4C MATERIALS
ÉTUDE DE LA FLUIDITE ET CARACTERISATION
MICROSTRUCTURALE D'UN COMPOSITE A
MATRICE MÉTALLIQUE AL-B
4C RECYCLÉ
RESUME
Ces dernières années, les composites à matrice métallique (CMM) AI-B4C ont été de plus en plus utilisés comme composants absorbeur de neutrons dans l'industrie nucléaire. Au cours des procédés de fabrication, le processus de déchets de la fonderie et des procédés de transformation (extrusion et de laminage) peut atteindre 50 à 60% du total des matériaux produits. Alors, la nécessité de recycler les composites à matrice métallique AI-B4C devient plus urgent d'atteindre les objectifs environnementaux et de réduire le coût de production. La refusions est une méthode prometteuse de recyclage des rebuts de fabrication en raison de sa simplicité. Pour le processus de coulée de métal liquide, une bonne fluidité est une condition nécessaire afin que les matériaux soient recyclé en utilisant la méthode de refusion. Les caractéristiques de renfort, tels que la taille, la forme et la fraction volumique de particules de céramique ont un effet direct sur la fluidité de composites à base d'Al. En outre, les agglomérats de particules, les ségrégations et dispersion des particules, la présence de films d'oxyde, et l'apparition de la réaction induite par des particules influence les comportements fluidifiant du composite liquide.
L'étude présentée dans ce mémoire porte sur l'évolution de la fluidité de rebuts d'Al-B4C recyclés. Dans ce projet, l'évolution de la fluidité des billettes coulées et et des plaques extrudées du composite Al-10 vol.% B4C, ainsi que lingots et tôles laminées du composite Al-16 vol.% B4C est étudiée par des tests de fluidité sous vide. Afin de comprendre les différents matériaux, une évolution micro structurales des matériaux d'origine, des échantillons prélevés des creusets, ainsi que des échantillons de fluidité avec le temps de maintien est analysé par des microscopes optique et électronique. La morphologie et la distribution des particules de B4C, ainsi que les produits de réaction dans ces échantillons sont quantitativement caractérisées par d'analyseur d'images. De plus, l'influence de la microstructure sur le comportement fluidifiant de ces matériaux est discutée. En outre, les méthodes de caractérisation micro structurale des composites Al-B4C sont développées et présentées dans ce travail de recherche.
Les méthodes ont été appliquées avec succès pour décrire et analyser quantitativement la fraction volumique des particules, la distribution, l'agglomération des particules et la fraction volumique effective. En général, les techniques d'analyse d'images sont introduites pour des mesures quantitatives ultérieures sur des particules
II
distinctes. Un paramètre d'homogénéité P appropriées pour la caractérisation de l'homogénéité de distribution est proposé être le rapport de la variance de la distribution des zones de cellules sur la variance correspondantes obtenues à partir d'une distribution aléatoire des particules avec la même quantité de particules. Les agglomérats de particules sous forme de clusters et réseaux induite par les films d'oxyde sont identifiés. Et la fraction volumique effective des particules est introduite afin de refléter la résistance à l'écoulement de la ségrégation et l'agglomération dans une microstructure CMM.
Les résultats montrent que la fluidité des composites a matrice métallique AA6063-10vol.% B4C, coulées ou extrudées diminue quel l'augmentation du temps de maintien. La baisse de la fluidité des billettes coulées est beaucoup plus rapide que celle des plaques extrudées au cours de la période de maintien du métal liquide (8.5 h). Les microstructures des matériaux de récupération, en forme de billettes et de plaques extrudées, sont très différentes. L'extrusion peut considérablement améliorer l'uniformité de la microstructure. On croit que cette différence microstructure à une influence significative sur les particules et sur le comportement à l'écoulement du composite refondu. Au cours de la refusions et de maintien, la distribution des particules solides des billettes coulées devient plus mauvais que celle des plaques extrudées, séchant que les particules issues des réactions s'attachent et se rapprochent particules B4C, le qui indique une forte tendance à former des agrégats. Alors, cela provoque une diminution rapide de la fluidité. D'autre part, les plaques extrudées (rapport d'extrusion: 22:1) montrent une distribution plus uniforme des particules et moins agglomérats des particules, ce qui induit un maintien d'une bonne fluidité.
Dans les composites a matrice métallique AA1100-16 vol.% B4C, la fluidité des tôles laminées est légèrement plus élevé que celle de l'lingot coulés au début de la refusions. Avec le temps de maintien, la fluidité des tôles laminées et lingots coulés diminuait de façon significative. Lors du prolongement du temps de jusqu'à 150 min, la fluidité des tôles laminées est plus ou moins la mêmes que celle les lingots coulés. Au début de refusions, les tôles laminées ont montre une meilleure homogénéité de la répartition des particules, que les lingots coulés en raison de l'effet de l'uniformité de la déformation par laminage. Le pendant, en raison d'une sévère déformation du laminage à chaud (97% taux de réduction), la couche protectrice TiB2 autour des surfaces B4C dans les tôles laminées est sérieusement endommagée. Avec une longue période de maintien, la fraction volumique effective des tôles laminées augmente plus rapidement du à une sévère réaction interraciale et une tendance à l'agglomérat des particules. En conclusion, cela conduit à une rapide détérioration de la fluidité au cours de la période de maintien.
Ill
ABSTRACT
In recent years, AI-B4C Metal Matrix Composites (MMCs) have been increasingly used as neutron absorber components in the nuclear industry. During manufacturing processes, the process scrap from the casting and transformation processes (extrusion and rolling) can reach 50 to 60% of the total materials produced. The need to recycle AI-B4C composites becomes more urgent to meet environmental goals and to reduce the production costs. Remelting is a promising method to recycle process scrap materials because of its simplicity. For the liquid metal casting process, good fluidity is a basic requirement for the materials to be recycled with the remelting process. The reinforcement characteristics such as size, shape and volume fraction of ceramic particles have an effect on the fluidity of Al-based composites. Moreover, the particle agglomerates, particle settling and pushing, presence of oxide films, and the appearance of reaction-induced particles influence the flow behavior of the composite melt.
The study presented in this thesis was carried out to investigate the fluidity evolution of AI-B4C recycled scrap. In this project, the fluidity evolution of scrap from AA6063-10 vol.% B4C cast billets and extruded plates, as well as AA1100-16 vol.% B4C cast ingots and rolled sheets is investigated by means of vacuum fluidity tests. In order to understand the different materials, the microstructure evolution of original materials, crucible samples, as well as fluidity samples as different holding times is examined with optical and electron microscopes. The morphology and distribution of the B4C particles and its reaction products in these samples are quantitatively characterized by an image analyzer. Furthermore, the influence of microstructure on fluidity behavior of these materials is discussed.
The methods for characterization of AI-B4C composites microstructure are developed in this research. These methods have been successfully applied to describe and quantitatively analyze the particle volume fraction, distribution, agglomeration and particle effective volume fraction. General image analysis techniques are introduced to distinct particles for subsequent quantitative measurements. An appropriate homogeneity parameter P for charactering the distribution homogeneity is proposed to be the ratio of variance of distribution of cell areas to the corresponding variance obtained from a random particle distribution with the same amount of particles. The particle agglomerates in the form of clusters and networks induced by oxide films are identified. And the effective volume fraction of particles is introduced to reflect the flow resistance of particle segregation and agglomeration in the AI-B4C MMC microstructure.
The results show that the fluidity of either cast or extruded AA6063-10 vol.% B4C metal matrix composites decreases with the increase of the holding time. The fluidity decline of the cast billets is much faster than that of the extruded plates during the melt holding period (8.5 h). The microstructures of original scrap materials in forms of cast billet and extruded plates are very different. The extrusion can considerably improve the
IV
uniformity of the microstructure. It is believed that this microstructure difference has a significant influence on the particle and flow behavior of the composite melts after remelting. During the subsequent remelting and holding, the solid particle distribution of cast billets becomes remarkably worse than that of extruded plates, with the fact that more reaction-induced particles are attached and close to the B4C particles, indicating a strong tendency to form particle aggregates. Hence this causes a rapid decrease of the fluidity. On the other hand, the extruded plates (extrusion ratio: 22:1) show a more uniform particle distribution and less particle agglomerates and thus maintain a good fluidity.
In AA1100-16 vol.% B4C MMCs, the fluidity of the rolled sheets is slightly higher than that of the cast ingots at the beginning remelting. With the holding time, the fluidity of both the rolled sheets and cast ingots decreased significantly. As prolonged holding period to 150 min, the fluidity of rolled sheets is more or less the same as the cast ingots. At the beginning of remelting, the rolled sheets show better homogeneity of particle distribution than the cast ingots because of the uniformity effect of rolling deformation. However, due to a severe deformation of hot rolling (97% reduction ratio), the TiB2 protective layer around B4C surfaces in rolled sheets is seriously damaged and broken down. With a long term holding, the effective volume fraction of rolled sheets increases more rapidly as a result of severe interfacial reaction and a much stronger tendency for particle agglomerates. Thus, it leads to a quick deterioration of fluidity during holding period.
VI
ACKNOWLEDGMENTS
I would like to express sincerely all my especial thanks to my supervisors,
Professors X.-Grant Chen and Z. Zhang, for continual supports, encouragement, technical
discussions and direction along this work.
I also convey all my thanks to Professor André Charette, for his kind accompany and
research direction in my first year, and all members of the research group for their
assistance during my Master's research, particularly to M. Bouchard, technician of the
Chair for his help with the fluidity tests and sample preparation; also to Dany Racine for
his assistance and suggestions in image analysis. Many thanks also go to Junfeng Guo
who recommended me to UQAC and gave me much assistance when I came here.
Finally, I would like to express my profound gratitude to the members of my family,
especially my parents and Ying Huang for their emotional and spiritual supports.
This work was carried out with financial support of Natural Sciences and
Engineering Research Council of Canada - NSERC, Rio Tinto Alcan, through the
NSERC/Rio Tinto Alcan Industrial Research Chair in Metallurgy of Aluminium
VII
TABLE OF CONTENTS
RESUME I ABSTRACT Ill ACKNOWLEDGMENTS VI TABLE OF CONTENTS VII LIST OF FIGURES X LIST OF TABLES XIII CHAPTER 1
DEFINITION OF THE PROBLEM 2 1.1 INTRODUCTION 2 1.2 PROBLEMS 3 1.3 OBJECTIVES 4 1.4 METHODOLOGY 5 CHAPTER 2 LITERATURE REVIEW 7 2.1 INTERFACE OF AL-B4C COMPOSITES 7 2.1.1 Interfacial reactions of A1-B4C composites 8 2.1.2 Interfacial reaction thermodynamics 11 2.2 FLUIDITY 13 2.3 FLUIDITY OF COMPOSITE 18 2.4 INFLUENCING FACTORS OF REINFORCEMENT ON FLUIDITY 20 2.4.1 Particle volume fraction 20 2.4.2 Particle surface area 21 2.4.3 Particle size 22 2.4.4 Particle shape 23 2.4.5 Particle agglomeration 24 2.4.6 Interfacial reaction 24 2.5 INFLUENCE OF MECHANICAL DEFORMATION ON FLUIDITY 25 2.6 CHARACTERIZATION OF COMPOSITE 25
VIII
2.6.1 Particle volume fraction 25 2.6.2 Particle distribution 27 2.6.3 Particle agglomeration 29 CHAPTER 3 EXPERIMENTAL PROCEDURES 31 3.1 FLUIDITYTEST 31 3.3.1 Material preparation 31 3.3.2 Vacuum fluidity test procedures 33 3.2 MICROSTRUCTURE ANALYSIS 35 3.2.1 Sample preparation 35 3.2.2 Quantitative analysis of microstructure 35 3.2.2.1 Particle volume fraction 36 3.2.2.2 Particle distribution 38 3.2.2.3 Particle agglomeration 44 3.2.2.4 Particle effective volume fraction 48 3.3 E L E C T R O N M I C R O S C O P Y 50 CHAPTER 4
RESULTS AND DISCUSSION 89 4.1 CAST AND EXTRUDED RECYCLED MATERIALS (AA6063-10 VOL.% B4C) 89 4.1.1 Fluidity evolution 89 4.1.2 Original scrap materials 90 4.1.2.1 Microstructure of B4C and reaction-induced particles 90 4.1.2.2 Microstructure of particle agglomerates 91 4.1.3 Crucible samples 93 4.1.3.1 Microstructure of B4C and reaction-induced particles 93 4.1.3.2 Microstructure of particle agglomerates 94 4.1.3.3 Quantitative analysis of B4C and reaction-induced particles 96 4.1.4 Fluidity samples 100 4.1.4.1 Quantitative analysis of particle agglomerates 100 4.1.4.2 Quantitative analysis of B4C and reaction-induced particles 101 4.1.5 Mechanism of flow arrest and explanation of fluidity evolution 104 4.2 CAST AND ROLLED RECYCLED MATERIALS (AAl 100-16 VOL.% B4C) 109 4.2.1 Fluidity evolution 109 4.2.2 Original scrap materials 110 4.2.2.1 Microstructure of B4C and reaction-induced particles 110 4.2.2.2 Microstructure of particle agglomerates 110
IX
4.2.3.1 Microstructure of B4C and reaction-induced particles 112 4.2.3.2 Quantitative analysis of B4C and reaction-induced particles 116 4.2.4 Fluidity samples 118 4.2.4.1 Quantitative analysis of particle agglomerates 118 4.2.4.2 Quantitative analysis of B4C and reaction-induced particles 119 CHAPTER 5
CONCLUSIONS AND SUGGESTIONS FOR FUTURE WORK 123 5.1 CONCLUSIONS 123 5.2 SUGGESTIONS FOR FUTURE WORK 125 REFERENCES 126 APPENDICES 135
X
LIST OF FIGURES
Figure 2.1: Microstructures of theAl-B4C composite sample [9] 9 Figure 2.2: Backscattered electron image of the AI-B4C composite sample[9) 9 Figure 2.3: A dark field image (TEM) of the A1-B4C composite sample[9] 10 Figure 2.4: Thermodynamic-reaction-series map for Al - B4C composites at 1180°C and
heat-treated under various isothermal conditions between 800 °C and 1400°C [31] 12 Figure 2.5: Calculated isopleths Ti- B4C phase diagram[41] 13 Figure 2.6: Flow and solidification front of a pure metal in channel[13] 15 Figure 2.7: Flow arrest in long-freezing-range alloys in a channel[13] 16 Figure 2.8: Fluidity vs. vol.%of SiC particles inA356 andA357 cast in permanent mold[481 21 Figure 2.9: Variation of spiral fluidity (cast in permanent mold) as a function of specific surface
area of ceramic particles [10] 22 Figure 2.10: Fluidity vs. particle size of mica in Al—4.5% Cu alloys cast in permanent mold [501.23 Figure 2.11: Fluidity vs. particle shape of SiC in A356 alloys cast in permanent mold[501 24 Figure 2.12: Construction of a Dirichlet cell for a given point[641 28 Figure 3.1: The scrap materials used in Fluidity tests: (a) AA6063-10 vol.% B4C cast billets; (b)
AA6063-10 vol.% B4C extruded plates; (c) AA1100-16 vol.% B4C cast ingots; (d) AA1100-16 vol.% B4C rolled sheets 32 Figure 3.2: A vacuum fluidity test setup 34 Figure 3.3: Sketch of vacuum fluidity test setup 34 Figure 3.4: A fluidity sample 34 Figure 3.5: Optical microscope and image analysis system (Clemex) 36 Figure 3.6: (a) optical image of A1-B4C composite; (b) thresholded image 38 Figure 3.7: Sample image: (a) original image; (b) thresholding image 41 Figure 3.8: Centroids of B4C particles: (a) centroids image; (b) tessellated image 42 Figure 3.9: Random dots image: (a) original image; (b) tessellated image 43
XI
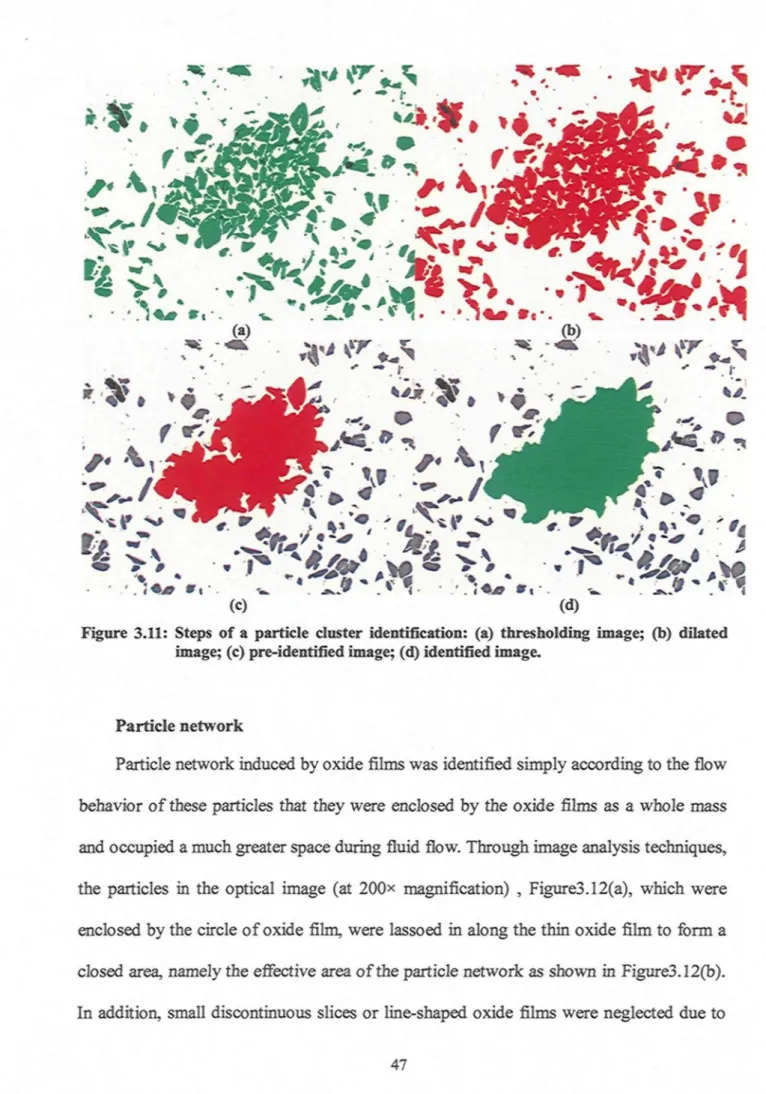
Figure 3.10: (a) An optical image of a cluster; (b) A second electron image (SEM) of a cluster in an etched fluidity sample with 510 min holding 45 Figure 3.11: Steps of a particle cluster identification: (a) thresholding image; (b) dilated image; (c)
pre-identified image; (d) identified image 47 Figure 3.12: Steps of a particle network identification: (a) original image; (b) identified image.. 48 Figure 3.13: The effective volume models and the effective volume fraction measurements in the
image analysis: a) original micrograph and (b) model image for small particle aggregates; c) and d) for a dense particle cluster; e) and f) for a particle network induced by oxide films or reaction products 50 Figure 4.1: Fluidity evolution of cast and extrusion Al-10 vol.% B4C MMCs.90
Figure 4.2: Micrographs of Al-10 vol.% B4C composite scrap: (a) cast billets; (b) extruded plates. 91 Figure 4.3: Particle clusters: (a) in cast billets; (b) in extruded plates 92 Figure 4.4: Oxide films: (a) in cast billets; (b) in extruded plates 92 Figure 4.5: Micrographs of the crucible samples with 510 minutes holding time: (a) cast billets; (b)
extruded plates 93 Figure 4.6: Particle clusters of 510 min holding crucible samples of: (a) cast billet; (b) extruded
plate 94 Figure 4.7: oxide film induced segregation of 510 min holding etched crucible samples of: (a)
extruded plate; (b) (c) cast billet 95 Figure 4.8: Second electron images (SEM) of etched crucible samples with 510min holding time:
(a) circle oxide film; (b) extended oxide film 95 Figure 4.9: Oxide films in the crucible sample of extruded plate with 510 min holding time: (a)
tiny oxide films; (b) folded oxide films 96 Figure 4.10: The ratios of A13BC particles (attached to B4C particles) in cast and extruded
composites with holding time 98 Figure 4.11 : The ratios of A1B2 particles (attached to B4C particles) of cast and extruded
composites with holding time 98 Figure 4.12: Homogeneity evolution of particle distribution in cast and extruded samples with
holding time 100 Figure 4.13: (a) Volume fraction of particle clusters; (b) Volume fraction of particle networks
induced by oxide films 101 Figure 4.14: Evolution of particle effective volume fraction of the fluidity samples 101 Figure 4.15: (a) particle volume fraction at the flow end of the fluidity samples; (b) particle
XII
effective volume fraction at the flow end of the fluidity samples with holding time. 104 Figure 4.16: Relationship between relative viscosity and volume concentration of powders of
various mean statistical diameters [74] 105 Figure 4.17: Microstructure of longitudinal section near the fluidity sample tip of Al-10 vol.%
B4C cast billet with 510 holding time 105 Figure 4.18: Fluidity evolution of cast and rolled Al-16 vol.% B4C MMCs 109 Figure 4.19: Micrographs of Al-10 vol.% B4C composite scrap: (a) cast ingots; (b) rolled sheets.
110 Figure 4.20: Particle clusters: (a) in cast ingots; (b) in rolled sheets I l l Figure 4.21: Oxide films: (a) in cast ingots; (b) in rolled sheets I l l Figure 4.22: Micrographs of the fluidity samples with 150 minutes holding time: (a) cast ingots;
(b) rolled sheets 112 Figure 4.23: Second electron images (SEM) of etched original materials: (a) cast ingots; (b) rolled sheets 114 Figure 4.24: Second electron images (SEM) of etched crucible samples with 60 min holding: (a)
cast ingots; (b) rolled sheets 115 Figure 4.25: Homogeneity evolution of particle distribution in cast and rolled samples with
holding time 118 Figure 4.26: (a) Volume fraction of particle clusters; (b) Volume fraction of particle networks
induced by oxide films 119 Figure 4.27: Evolution of particle effective volume fraction of the fluidity samples 120 Figure 4.28: (a) particle volume fraction at the flow end of the fluidity samples; (b) particle
effective volume fraction at the flow end of the fluidity samples with holding time. 121
XIII
LIST OF TABLES
Table 3.1: The chemical compositions of matrix alloys AA6063 and AA1100 33 Table 4.1 : Volume fraction of B4C particles and reaction-induced particles with holding time...97 Table 4.2: The flow lengths, particle effective volume fractions at flow tips 107 Table 4.3: Volume fraction of B4C particles and reaction products with holding time 116
CHAPTER 1
CHAPTER 1
DEFINITION OF THE PROBLEM
1.1 INTRODUCTION
In recent years, AI-B4C composite materials have been increasingly used as neutron
absorber components in the nuclear industry. This is due to their special capability of
capturing neutrons, and then lightweight, superior thermal conductivity and mechanical
properties[M]. Generally, processing techniques for Al MMCs can be classified into: 1) liquid mixing process, 2) semi-solid process and 3) powder metallurgy process [5'6]. The liquid mixing process is an effective method to economically produce large quantities of
Al-based metal-matrix composites. This process has been employed to produce most of
the commercial Al-based metal-matrix composites ^ . However, during this process, B4C
usually is unstable in liquid aluminum and reacts with the Al melt to form reaction
products, AI3BC, AIB2 and AI4C3 '•8'9^. In order to limit the decomposition of B4C particles and improve their wettability in the liquid metal casting process, Ti is added to AI-B4C
composites forming a TiB2 barrier layer around the B4C particle surfaces [9].
The fluidity of Al-based alloys and composites has been studied by several
researchers [1011]. In an alloy with rich solute, the flow arrest is due to a choking of the flow at the leading tip of the stream. When a critical concentration of solid is reached at
the leading tip, the viscosity then rises rapidly and the flow ceases abruptly [12>13]. The reinforcement characteristics such as size, shape and volume fraction of ceramic particles
have an effect on the fluidity of Al-based composites '-14'. It is reported that the volume fraction of the reaction-induced particles increases and its fluidity deteriorates with the
increase of melt holding time [9]. Moreover, the particle agglomerates, particle settling and pushing, presence of oxide films, and the appearance of reaction-induced particles
influence the flow behavior of the composite melt [15l Furthermore, during remelting, the fluidity of the composites can be influenced by different working processes due to their
effect on the distribution of reinforcement particles ^l6\ However, the literature related to the recycling of metal matrix composites and the fluidity evolution of the scrap materials
during remelting is very limited.
Quantitative characterization of the material microstructure is one of the means of
investigating of the influence of the microstructure on the fluidity and mechanical
properties. Image analysis techniques may be used to estimate the volume fraction
evolution of solid particles [17' 18]. Besides, various methods have been developed for characterizing the spatial distribution of discrete secondary phase bodies on
two-dimensional sections, including field methods, inter-particle spacing methods and
tessellation methods ^l9\Moreover, numerous approaches for assessment of clustering have been proposed and applied in composite materials, such as the Euclidean distance;
nearest neighbor distance; radial distribution function; and some others P°~2l\
1.2 PROBLEMS
During manufacturing processes, the process scrap from the casting and
transformation processes (extrusion and rolling) can reach 50 to 60% of the total
environmental goals and to reduce production costs. Compared to standard aluminum
alloys, the fluidity of metal matrix composites is already limited due to the presence of a
large quantity of ceramic particles. For the liquid metal casting process, the fluidity of the
composites can greatly influence the ability of the composites to be recycled for reuse.
Remelting is a promising method to recycle process scrap materials because of its
simplicity. Good fluidity is a basic requirement for the materials to be recycled with the
remelting process. However, during the remelting process, since there are strong
chemical reactions between B4C and Al, the fluidity behavior of the scrap should be
studied to better understand and optimize the recycling process, and micro structure of the
remelted composite needs to be examined to understand the mechanism of the fluidity
evolution.
1.3 OBJECTIVES
1. Investigate the fluidity evolution as a function of the holding time for two process
scrap materials, namely AA6063-10 vol.% B4C (cast billets and extruded plates)
and AA1100-16 vol.% B4C (cast ingots and rolled sheets).
2. Study the influence of casting, extrusion and rolling processes on micro structural
features, such as particle distribution, particle agglomeration and interfacial
reaction products.
3. Study the impact of particle amount, particle segregation and agglomeration, as
well as particle distribution on the fluidity evolution.
4. Attempt to propose widely applied approaches for micro structure characterization
1.4 METHODOLOGY
1. A vacuum fluidity test setup is used to investigate the evolution of the fluidity of
cast billets, extruded plates and rolled sheets with prolonging of holding time.
2. The methods for characterization of the microstructure of AI-B4C composites are
developed in terms of particle volume fraction, distribution agglomeration and
effective volume fraction using optical microscopy, scanning electron microscopy
(SEM) and optical image analysis techniques.
3. The microstructures of original materials and remelted samples are examined and
quantitatively analyzed to establish the relationship between micro structure and
CHAPTER 2
CHAPTER 2
LITERATURE REVIEW
2.1 INTERFACE OF AL-B
4C COMPOSITES
Interfaces in composites are regions of finite dimension at the boundary between the
reinforcement and the matrix where compositional and structural discontinuities can
occur over distances varying from an atomic mono layer to over five orders of magnitude
in thickness [22]. The nature of interfaces that develop in composites during fabrication and subsequent service is critical to their response to mechanical stresses, and thermal
and corrosive environments1231. The development of a suitable interfacial bond between the reinforcements and matrix is, therefore, a primary requirement for optimum
performance of a composite ^24'25\
Using the liquid metal process, AI-B4C MMCs are manufactured at temperatures
well above the liquidus of the aluminum matrix, and the processing time can amount to a
few hours. In addition, B4C is not stable in an aluminum melt, as the particles may react
with aluminum to form reaction products, AIB2, AI4C3, and AI3BC, which deteriorate the
fluidity of the melt and certain mechanical properties t2>25"27]. it is reported that titanium addition can improve the uniformity of the particulate distribution within aluminum
matrix ^27\ Through the formation of a layer rich in titanium on the surface of the particulates, this can limit decomposition of the B4C particles f27]. In addition, it is also found that the amount of the reaction products in the composites increases with the
increase of holding time. However, the rate of the increase is reduced by the increase of
the content of titanium in the composites.
2.1.1 Interfacial reactions of A1-B4C composites
Since B4C is not stable in an aluminum melt, the particles may react with the
aluminum to form reaction products which deteriorate the fluidity of the melt and certain
mechanical properties t2-8-27-28]. it was reported that when the AI-B4C temperature is between660 °C and 868 °C, the reaction products are AI3BC and AIB2 ^\ To overcome
the reactivity problem of B4C particles, titanium is added into the composite melt to form
a barrier layer on the surface of the B4C particulate, thus limiting the interfacial reactions
between the B4C and liquid aluminum[2l27].
Z. Zhang et al. [9] have found that by adding higher levels of Ti (approximately 2%) in Al-10% B4C composite, most B4C particles become stable in the aluminum matrix. No
significant degradation of B4C is observed.
Figure 2.1 shows an optical metallograph of AI-B4C composites. In this micrograph,
secondary reaction-induced solid particles around the B4C particles appear in the
aluminum matrix. These particles are the interfacial reaction products. The color of one
type of particle is yellow and that of another one is gray when seen under the optical
microscope. Most of the gray particles are connected or close to the B4C particles. The
Figure2.1: Microstructures of the A1-B4C composite sample '9|.
Several of the yellow particles were examined using an electron probe
microanalyzer (EPMA) [9]. They were to be AIB2. The backscattered electron image of
the AI-B4C composite sample is shown in Figure 2.2. A Ti-rich layer enclosing B4C particles and some reaction product particles distributed inside and outside of this layer were found. The reaction product particles consisted of Al, B, and C elements as detected by EDS analysis.
The Ti-rich layer was determined to be composed of fine T1B2 crystals (crystal size:
0.1-0.5um) and the reaction products were AI3BC crystals (crystal size: 0.3-0.8um) by
means of transmission electron microscopy. Figure 2.3 is a TEM dark field image of the
sample. In this image, there are two B4C particles. The smaller one is located at the lower right corner. The B4C particle surfaces are covered a layer of AI3BC crystals and then a
layer of fine TiB2 crystals that encloses the AI3BC layer and the B4C particles. Outside
the TiB2 layer, there is another layer of AI3BC crystals which continues to grow during
the melting period. Therefore, the gray particles seen in the optical metallographs include
two phases: TiB2 and AI3BC. Based on the above observation, the microstructure of the
Al-10% B4C composite consists of B4C particles and AI3BC, AIB2, and TiB2 phases. The
addition of Ti during remelting reacts with B4C to form a TiB2 layer around the B4C
particles.
Figure 2.3: A dark field image (TEM) of the A1-B4C composite sample'91.
reactions and their reaction products (AI3BC, TiB2, and AIB2) have also been
demonstrated [m°\
2.1.2 Interfacial reaction thermodynamics
It took several decades for material scientists to identify the reaction products of
Al-B4C composites. In 1989, based on the previous researches, Halverson^31^ investigated the reaction thermodynamic of AI-B4C in a larger temperature range from 800 °C to 1400 °C
which is illustrated in Figure 2.4. The significant conclusion from this paper is that it
reports the appearance of the X phase which formed around the B4C evolves and
consequently ties up most of the free carbon required to form AI4C3 and thus protects the
B4C particulates from being attached by Aluminum. This result was proved to be correct
by later research studies [8>32]. This is a specific feature that differentiates the AI-B4C couple from other reactive couples such as Al-TiC [33]or Al-SiC [32-34-36l at the interface of which AI4C3 appears as a major reaction product. Due to its hygroscopic nature and poor
mechanical properties, AI4C3 is always undesirable.
The X phase mentioned by Halverson was determined to be AI3BC by Viala ^i7\ Based on Viala's detailed report[8], as long as the temperature is lower than 660 °C, i.e. in the solid state of aluminum, the reaction between B4C and aluminum becomes very
slow. Nevertheless, in the range from 660 °C to 827 °C, the reaction rate increases
sharply, forming the ternary carbide (AI3BC) and diboride (AIB2). Above 868 °C, AI3BC
is still formed, while AI3B48C2 (P -AIB12) replaces AIB2. The other phases (AIBI2C2 and
AI4C3) are formed only at the higher end of the investigated temperature interval of
985 °C ~ 1370 °C. With the onset of formation of the boron rich AIB12C2 phase, the
phase plays an important role in preventing the B4C particle from being attacked by
aluminum. The equations corresponding to these chemical reactions are as follows:
4 B4C(S) + 13 A1(L) <=> 4 A13BC(S) + AlBi2(S) (T >985°C) [39] 2B4C(S) + 9A1 (L) « 3A1B2(S) + 2A13BC(S) (T <897 °C) [8'40]
(2.1)
(2.2)
Tens of hours ) ( One to ten hours
C Tens of hours J
AI.C,
AI8,.C.
Figure2.4:Thermodynamic-reaction-series map for Al - B4C composites at 1180°C and heat-treated under various isothermal conditions between 800 °C and 1400°C|31'.
Taking into account the addition of titanium in the matrix, the reactions between
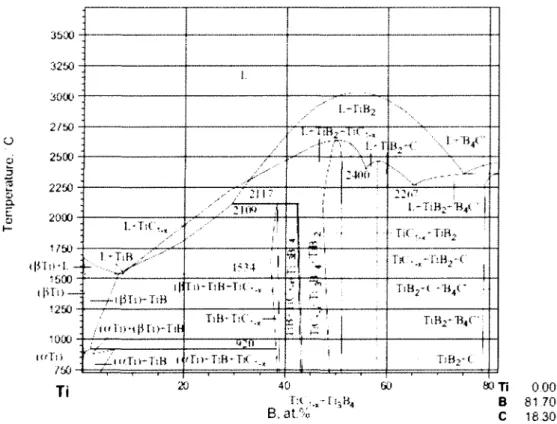
Ti-B4C are briefly summarized here. The Ti-Ti-B4C phase diagram is illustrated in Figure 2.5
^4l\ The changes in free energy and enthalpy of the possible reactions with titanium at 1023 °C are shown as below[34]:
(2.3) (2.4)
B4C + 3Ti <=> 2TiB2 + TiC
which means this is an exothermic reaction. The AG° and AH° for this reaction are
generally more negative than those for the reaction between aluminum and B4C particles,
with values of-335 KJ/mol and -556 KJ/mol, respectively [2]. After a period of holding above the melting point, all the titanium was consumed and converted into TiB2 [1'34], and the size of the TiB2 particles ranges from approximately 0.1 ~ 1 urn .
3500 - 3250- 30002 / 5 0 -J : o 2500 -5 :
1
2 2 5°
-a. 5 2000 - 1600-( |i 11 » —i 1250-; 1000-^ ( i ' Xi ) l.-T.C... ,--/.lii^T.B " ' 1. / / :in TiB-TiC..,—>•' l i t - l i B - T H . • • ..-•• 1 . - T Ï B2 w ' : 4 w ' ' 1 "* i .- t i *"" ! I 1 B2- C " ' • . , ' 'B4 * i.-TîB2~'B4( " T«C-%,-T.B2 TiB>-C .' -40 I":C. B. at.% 60 son B C 0.00 81.70 18 30 TiFigure 2.5:Calculated isopleths of the Ti- B4C phase diagram |41<.
2.2 FLUIDITY
The fluidity is the ability of molten metal to flow in a long channel of small cross
sections [42]. The fluidity of an alloy is influenced by the temperature, the composition, the density and the viscosity of the alloy, thermal properties of the metal and the mold
and test variables such as applied metal head and channel diameter [43]. For a composite, the addition of particles to the melt implies that additional parameters which influence the
fluidity above those presented for the pure alloy must also be considered, namely, volume
fraction, size and shape of particles, reactions, segregation, clustering, gas and
inclusions1'51.
To evaluate the fluidity of metals, there are two common types of fluidity tests: the
spiral fluidity test and the vacuum fluidity test ^li'42\ The fluidity is measured in terms of the length along which the molten melt flows in the long channel before it is stopped by
solidification ^42\ Flemings developed the following equation to evaluate the fluidity of pure metal, assuming that friction, acceleration, and separation of the flow are negligible
[42]
Lf = BsEl (H + AT)
2h(TM ~T0) (2.5)
where:
Lf: Fluidity length (fluidity),
ps: Density of the solid metal,
a: Radius of cross-session of channel,
v: Velocity of the molten metal,
H: Latent heat of fusion,
C: Specific heat of molten metal,
AT: Superheat,
h: Heat-transfer coefficient,
To: Temperature of the mold.
The model indicates that the velocity of the molten metal is one of the key factors
influencing the fluidity, as the temperature of melt and mold, as well as the interface
heat-transfer coefficient are fixed for a metal. However, the melt viscosity has a strong
influence on its velocity to fill the mold channel under pressure.
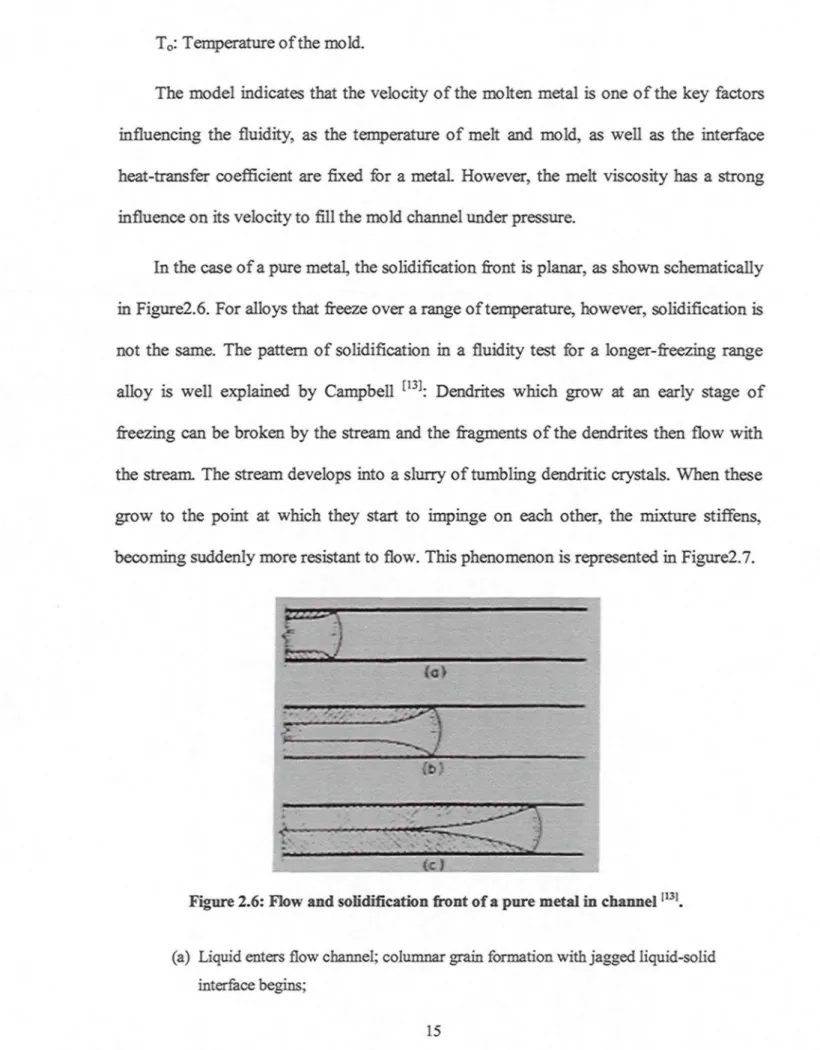
In the case of a pure metal, the solidification front is planar, as shown schematically
in Figure2.6. For alloys that freeze over a range of temperature, however, solidification is
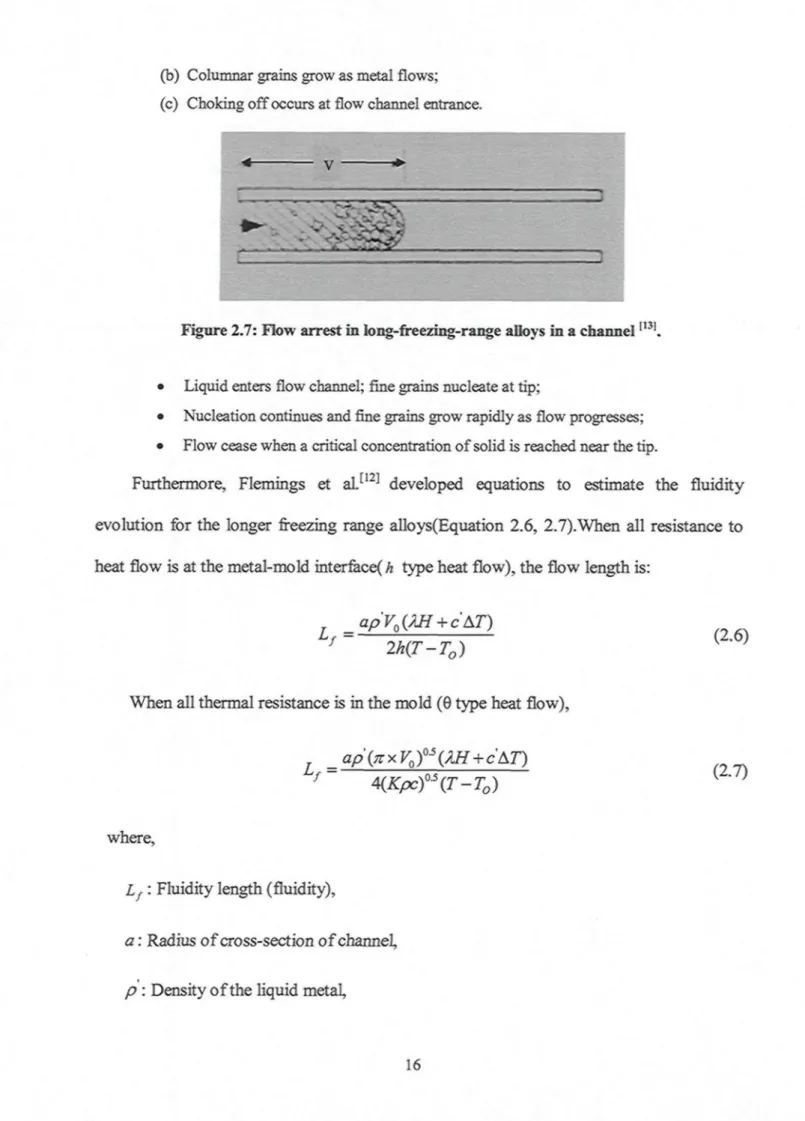
not the same. The pattern of solidification in a fluidity test for a longer-freezing range
alloy is well explained by Campbell [13J: Dendrites which grow at an early stage of
freezing can be broken by the stream and the fragments of the dendrites then flow with
the stream. The stream develops into a slurry of tumbling dendritic crystals. When these
grow to the point at which they start to impinge on each other, the mixture stiffens,
becoming suddenly more resistant to flow. This phenomenon is represented in Figure2.7.
It)
• ....;. _ (O „_.__.__..
Figure 2.6: Flow and solidification front of a pure metal in channel[131.
(a) Liquid enters flow channel; columnar grain formation with jagged liquid-solid interface begins;
(b) Columnar grains grow as metal flows; (c) Choking off occurs at flow channel entrance.
V ;
-. - •
Figure 2.7: Flow arrest in long-freezing-range alloys in a channel|I3!.
• Liquid enters flow channel; fine grains nucleate at tip;
• Nucleation continues and fine grains grow rapidly as flow progresses; • Flow cease when a critical concentration of solid is reached near the tip.
Furthermore, Flemings et al.[12] developed equations to estimate the fluidity
evolution for the longer freezing range alloys(Equation 2.6, 2.7).When all resistance to heat flow is at the metal-mold interface^ type heat flow), the flow length is:
aPVo(m + cAT)
f 2h(TT)2h(T-To K })
When all thermal resistance is in the mold (6 type heat flow),
f 4(Kpc)0*(T-To)
where,
Lt •• Fluidity length (fluidity),
a : Radius of cross-section of channel, p : Density of the liquid metal,
c : Specific heat of the molten metal, Vo : Initial velocity of the molten metal, A : Critical solid concentration,
H : Heat of fusion, AT: Superheat,
h : Heat-transfer coefficient,
T : Metal solidification temperature, To : mold temperature,
K : Conductivity of mold, p : Mold density,
C : Specific heat of mold.
Equations 2.6 and2.7 assume that solid particles form during flow in a fluidity
channel and travel downstream with the liquid; flow stops when the mean solid
concentration near the flow tip reaches a certain value, A (critical solid concentration),
and flow velocity is constant until flow stops. Regardless of the heat flow being either h
or 9 type, or intermediate, it can be shown that A can be calculated from the test variables
as
A = (( )f )TT __ TT (2.8)
2.3 FLUIDITY OF COMPOSITE
Addition of solid particles into the melt affects the fluidity by the modification of
solidification time and flow properties in which the ceramic particles added to the liquid
phase do not have the same thermal properties as the liquid metal. Thus, the solidification
time of a composite melt will be different from that of the pure alloy, due to change in the
latent heat caused by the volume fraction of the solid phase, and a change in the
superheat and effective thermal conductivity of the melt. For the description of composite
fluidity, Equation2.9 was proposed by introducing the fraction of reinforcement particles
and their properties into the equation ^ll\
h = Z™ T[ iHm (1 - & ) + {CmWm +CdWd)AT]
z"iIm~Io) (2.9)
where:
p: Density of the solid metal,
(p: Volume fraction,
C: Specific heat,
H: Latent heat,
W: Weight fraction of matrix (m) and reinforcement particles (d).
This equation indicates that the density, fraction and thermal properties of particles
have an effect on the fluidity. It is reported that decrease in fluidity with increase in SiC
volume fraction predicted by the equation is consistent with the experimental
observations, provided v and h do not change significantly [15]. However, the factors important to composite fluidity but not considered in Equation 2.9 such as settling,
agglomeration, and pushing of particles, presence of gas and oxides and reaction-induced
changes may result in deviations between theory and experiment ^l5\ Moreover, the effect of reinforcement particles on the mechanism of flow arrest in the channel in a fluidity test
could also influence the composite fluidity as predicted by Equation2.9.
It was found that one of the major factors for the decrease of fluidity was the
increase in the viscosity of the melt for an AI-AI2O3 composite ^l0\ However, the increase of the viscosity is more than that predicted by Equation2.10 [44]. The reasons resulting in the extra increase viscosity and involving the change of surface areas are the variation of
shape and size of particles at a given volume percent. Moreover, the fluidity o f the
composites is related to the surface area o f particles, and a linear relationship between the
fluidity and the surface area is observed [9].
s ) </> < 0.25 (2.10)
where:
ns: Viscosity of suspension,
r|0: Viscosity of suspending medium,
q>: Volume fraction of dispersed phase.
The predictive capability of the Flemings model is limited at present for metal
matrix composites. This can be attributed to the noninclusion of factors such as particle
size, shape, agglomeration, and the effect of interfacial reactions, which lead to an
increase in the effective solid fraction in the slurry. K.R. Ravi et al. [45] modified the Flemings model by incorporating (i) the solidification behavior of alloys; (ii) the decrease
viscosity of composite slurries due to reinforcement size, shape, and volume fraction, and
proposed Equation2.11 to evaluate the spiral fluidity length of aluminum Al-SiCp
composites without interfacial reaction and with interfacial reaction by using the
volume-averaged properties of the particle-melt mixture such as density, specific heat, critical
solid fraction, and latent heat.
2g(H-Hswfien)
flfi) K
Lf 2h(T-To) ( / r
where:
pc : Volume-averaged density,
AHC : Volume-averaged specific heat,
j-criticai. Volume-averaged critical solid fraction,
Cc : Volume-averaged latent heat.
2.4 INFLUENCING FACTORS OF REINFORCEMENT ON
FLUIDITY
2.4.1 Particle volume fraction
In the case of particle-dispersed composites, the fluidity at any given temperature is
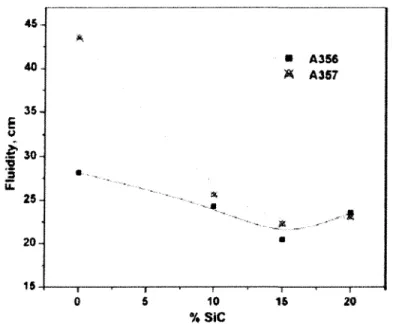
diminished relative to the particle free base alloy [U46'47]. Surappa and Rohatgi [10] observed a decrease in spiral fluidity with the addition of reinforcement like mica,
graphite, silicon carbide and alumina particles in the size range 40-200 um in various Al
and A357 alloys cast in permanent mold (Figure2.8). Z. Zhang et al. ^ found that an
increase in the volume fraction of solid particles in Al-10% B4C composite results in the
decline of the fluidity.
4 5 -4 0 . 35-v ûû 2 5 - 20- 16-... 1 ' 1 at , ! , • a A3S6 A357 ,-- -' •* 1 ! 10 15 % SiC 20
Figure 2.8: Fluidity vs. vol.% of SiC particles in A356 and A357 cast in permanent mold1481.
2.4.2 Particle surface area
It was also observed that the fluidity of the Al-based composites was related to the
size and shape of reinforcing particles (AI2O3, SiC and B4C) f9>10<49]. The composite fluidity decreased with a decrease in particle size and with an increase of angularity for a
given percentage of the reinforcement. The relationship between the fluidity length (F, in
cm) and the AI2O3 particle surface area (x, in m /100 g) could be expressed by Equation
2.12, where a and b are constants [10].
F = a-bx (2.12)
It was suggested that the decrease in the Al-alumina composite fluidity with an
increase in the melt ^l0\ Surappa and Rohatgi ^ observed that spiral fluidity tested in a permanent mold casting decreased linearly with the total surface area per unit weight of
the particles (Figure 2.9)
48
1O0 2 0 0 3 0 0 4 0 0 SQO Surface area of alumina particl**,m2/100g
Figure2.9:Variation of spiral fluidity (cast in permanent mold) as a function of specific surface area of ceramic particles |101.
2.4.3 Particle size
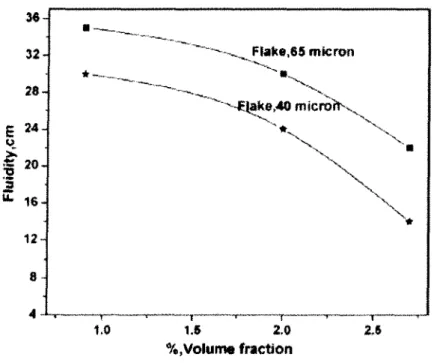
The fluidity of Al-4.5Cu-mica composites [50] (cast in permanent mold) decreases with a decrease in the reinforcement particle size for a given volume fraction of particles
(Figure2.10). Yarandi et al. [51] found that the A356 alloy-SiCp composite (cast in a permanent mold) containing 15 vol.% SiCp of 9 urn diameter had the lowest flow ability, lower than that of composite containing 20 vol.% SiCp of 14 urn diameter, indicating that particle size has a strong influence on flow and spiral length. The decrease with size has
resistance to fluid flow as a result of stagnant boundary layers around the particles.
1
I
2 2 u. 32- 28- 24- 20- 16-• 12-8 4 1.0 "^^--^^^Flak8,65 micron ^--€lake,40 microhv^ ~ * \ \ . . \ 1.5 2.0 2.6 %,Volume fractionFigure 2.10:Fluidity vs. particle size of mica in Al-4.5% Cu alloys cast in permanent mold |501
2.4.4 Particle shape
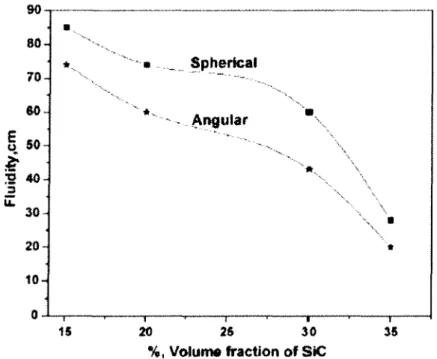
The morphology of the reinforcement influences the fluidity of composite melts
because of its effect on the surface area-to-volume ratio of the dispersed phase.
Increasing angularity (deviation from perfect sphericity) of the reinforcing particles leads
to a progressively greater decrease in the fluidity at a given temperature and volume
90 80-4 70 60 I SO
â
S 40- 20- 10-0 15 — i — 20 Spherical Angular — i — 2$ 30%, Voluiro fraction of SiC
—r~ 35
Figure 2.11:Fluidity vs. particle shape of SiC in A356 alloys cast in permanent mold[501
2.4.5 Particle agglomeration
The distribution of SiC particles in the Al melt is not perfectly uniform and the
presence of particles increases the viscosity of the melt[14]. Besides, the particle clusters and networks have an important contribution to the deterioration of the composite
fluidity^.
2.4.6 Interfacial reaction
A study on the relations between fluidity and reaction products has been done, and
analysis of the fraction of the reaction products of Al-10%B4C metal matrix composite
and the surface area has been performed by means of an image analyzer ^9\ Two main interface reaction phases, AIB2 and AI3BC, exist in the composite. The fluidity of
minutes of holding time, the deterioration of fluidity is much faster than at all other
holding times. Exactly during this period (400 min), the surface area increases more
quickly, about 60% of the total increase in amount. The increase of surface area directly
results in the decrease of fluidity. Therefore, the increase of reaction products during the
holding time would greatly impact the fluidity of AI-B4C composites [9].
2.5 INFLUENCE OF MECHANICAL DEFORMATION ON
FLUIDITY
During remelting, the fluidity of the composites through casting and transformation
processes can be influenced due to the distribution of reinforcement particles during these
processes ^l4'l6\ In composites processed by molten metal mixing methods, the particle distribution is influenced by the mixing and the solidification rate[16]. The reinforcement particles are rejected at the solid/liquid interface and segregate to interdendritic regions
after solidification. As well, a slow solidification rate would lead to very inhomogeneous
particle distribution. Secondary fabrication processing such as extrusion or rolling, can
homogenize the structure to some extent during the severe work deformation[16].
2.6 CHARACTERIZATION OF COMPOSITE
2.6.1 Particle volume fraction
Addition of solid particles into the melt affects the fluidity by the modification of
solidification time and flow properties ^2&\ For the composite fluidity, Equation2.8 indicates that the fluidity will decrease with an increase in volume fraction of solid
For quantitative evaluation of the volume fraction of particles in the composites, the
image analysis technique can be used to relate the measurements performed on
two-dimensional images to the three-two-dimensional structures that are represented and sampled
by those images. If a structure or phase can be identified in an image, and that image is
representative of the whole specimen, then the area fraction that the phase occupies in the
image is a measure of the volume fraction that it occupies in the whole specimen [52]. Actually, this relationship is one of the oldest known relationships in quantitative
stereo logy, used in mineral analysis 150 years ago ^ . This requires some clarification in
which the image must be representative in the sense that each phase has an equal chance
of being examined; thus, the sections must be uniformly and randomly placed in the
specimen. In most real structures, this is ensured by collecting many images from
multiple fields of view spread throughout the specimen in an unbiased way. Then the
measured area fractions of the phases may be equal to the volume fraction of these
phases[52].
Therefore, using image analysis method, estimation of the volume fraction of phases
is to count (in a binary image) all the pixels that represent the analyzed phase and use this
number in the image as a reference value [17'5 :
V -A -N»
where, Vv denotes volume fraction, AA denotes area fraction, Np denotes the number of pixels that corresponding to the phase being analyzed, and No is the total number of pixels in the image.
2.6.2 Particle distribution
Reinforcement distributions play an important role in various aspects of the
processing and final mechanical behavior of particulate metal matrix composites
(PMMCs). In general, a non-uniform distribution of particles in the aluminum matrix and
the presence of these particles increase the viscosity of melt, resulting in decrease of
fluidity [29]. Moreover, controlled particle distribution in the matrix is very important for composite material applications since it greatly impacts the mechanical properties such as
tensile strength and elongation of the materials ^ .
Various methods have been developed for characterizing the spatial distribution of
discrete secondary phase bodies on two-dimensional sections, such as field methods,
inter-particle spacing methods and tessellation methods ^l9\
The simplest field methods involve comparing numbers of particles in defined
areas^54l Others focus on the variance of the number of particles in a box of specified area, moved randomly around the field of study, or from the rate of decrease of this
variance with increasing box size ™5'56\ Inter-particle spacing methods, most of which are based on the measurement of nearest neighbor distances between particle centroids, offer
improvements over field methods by their ability to differentiate different types of
distribution and quantify local clustering characteristics t57"601.
Tessellation methods represent a further improvement over inter-particle spacing
methods in that the more general surroundings of individual secondary phase particles
may be uniquely characterized t61"631. Established Dirichlet tessellation methods utilize the centroids of particles to construct a network of polygon cells such that any point
other centroids, as shown in Figure 2.12 [64]. It is given by the inner envelope of the perpendicular bisectors of the lines joining the given point to the other points. Based on
the tessellated cell structure, a variety of parameters relating to spatial distribution may be
derived, including "neighboring particle" parameters (defined as cells sharing cell
boundaries) and near-neighbor distance (defined as the shortest distance between
corresponding particle centroids) [19]. For example, Lloyd [65] studied the particle distribution in two particle reinforce MMCs. A more clustered composite could be
distinguished from a more homogeneous one by a large tail at the long separation end of
a near neighbor histogram.
Figure 2.12: Construction of a Dirichlet cell for a given point| M |.
In addition to identifying the near neighbors of each particle, the cells themselves
can provide useful information about the distribution. Several studies [66'67] has shown that a clustered distribution would be expected to generate a wide range of cell sizes,
ranging from small cells in heavily clustered regions to large cells in particle denuded
zones. A more homogeneous distribution would have a narrower range of cell sizes.
Furthermore, a most appropriate parameter for characterizing the homogeneity of particle
variance of random distribution with the same average areal density of particles by
Dirichlet tessellations [68].
Alternatively, the tessellation can be carried out using a "growth process" [69]. Growth occurs from the particle periphery in all directions at the same rate and continues
until each cell comes into contact with all of its neighboring cells. Growth tessellations
can have non-linear cell boundaries, in contrast to Dirichlet cells. However, compared
with the Dirichlet method, a large particle is always contained within a large cell when
the growth method is used, and even a long, thin particle is always contained within a
long, thin cell, whereas this is not always the case using the Dirichlet method.
2.6.3 Particle agglomeration
Clustering of second-phase has been recognized as a factor influencing materials
properties and behavior, such as ductility and formability, toughness and fatigue life ^10\ Furthermore, the presence of particle agglomerates results in an increase of the flow
resistance to the composite melt and deteriorates the fluidity of the composite ^9\ Particle cluster is one type of particle agglomerates, forming a dense solid particle complex.
Particle network is a less dense agglomerate induced by oxide films or reaction products.
These agglomerates are formed during the composite preparation and melt holding. They
likely move as a whole mass during the fluid flow and occupy a much greater space than
the sum of individual solid particles. Consequently, the effective volume of solid particles
in the melt is remarkably increased due to these agglomerates. Li et al. have noted that
particle cracking is more likely to occur in larger particles that are located in clusters [71l A variety of approaches to assess clustering have been proposed and applied in
composite materials. These methods include the Euclidean distance; nearest neighbor
distance; radial distribution function; and some others t20-21'72!. All of these consider the distance between the particles from an absolute measure: i.e. if two particles are within 5
um of each other, they form a cluster. G. Langelaan et al. [73] have described another method to characterize the clustering of intermetallic particles in an aluminum alloy by
considering the size of each particle and estimating the size of its strain field based on
Eshelby's work. Accordingly, any particle with overlapping strain fields would be defined
CHAPTER 3
CHAPTER 3
EXPERIMENTAL PROCEDURES
A vacuum fluidity test setup was used to investigate the evolution of the fluidity of
cast billets, extruded plates and rolled sheets as a function of the melt holding time.
Subsequently, the microstructural features and interfacial-reaction-induced particles
observed in the remelted aluminum composites were identified using optical microscopy.
Furthermore, the characteristics of B4C particles and interfacial reaction-induced particles,
such as particle volume fraction, distribution and particle agglomerates, and effective
volume fraction were examined and quantitatively analyzed to establish the relationship
between microstructure and fluidity evolution by using optical microscopy, scanning
electron microscopy (SEM) and image analysis.
3.1 FLUIDITY TEST
3.3.1 Material preparation
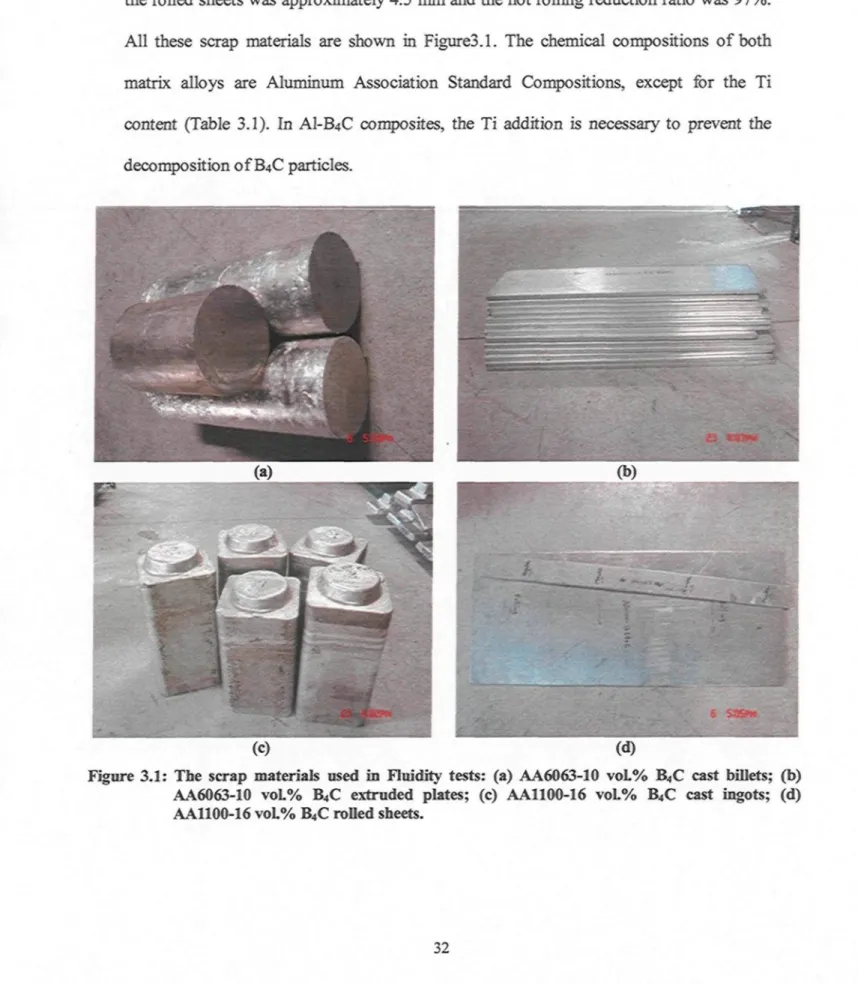
The process scrap of AA6063-10 vol.% B4C Direct Chill (DC) cast billets and their extruded plates, as well as AAl 100-16 vol.% B4C DC cast ingots and their rolled sheets
fabricated by Rio Tinto Alcan, were used in this investigation. The average B4C particle
size in both materials was approximately 17 jam. The AA6063-10 vol.% B4C cast billets
had a diameter of 7 inches. The extrusion plates were rectangular with a section
100-16 vol.% B4C cast ingots had a rectangular section of 6 x 6 inches, while the thickness of
the rolled sheets was approximately 4.5 mm and the hot rolling reduction ratio was 97%.
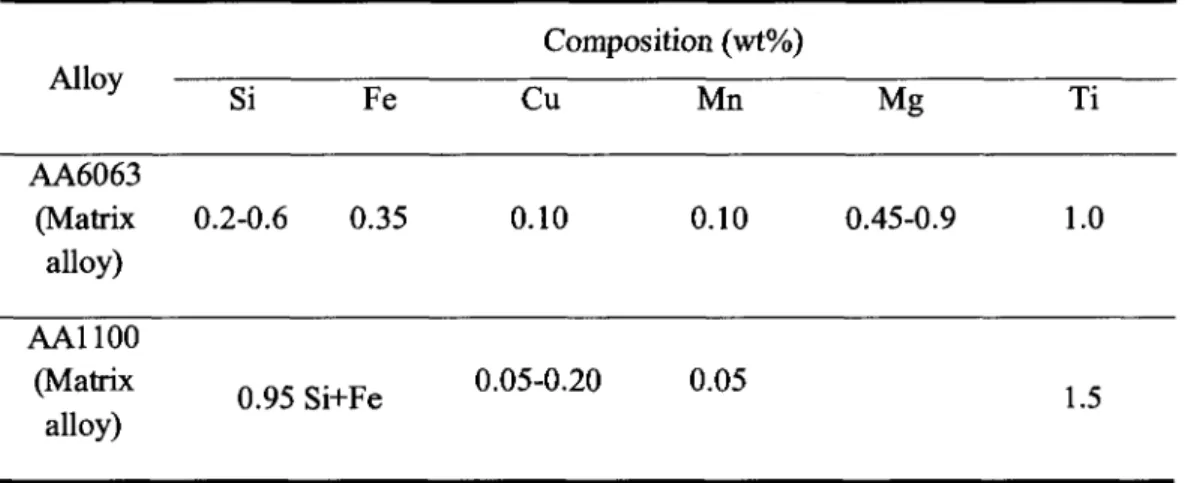
All these scrap materials are shown in Figure3.1. The chemical compositions of both
matrix alloys are Aluminum Association Standard Compositions, except for the Ti content (Table 3.1). In AI-B4C composites, the Ti addition is necessary to prevent the
decomposition of B4C particles.
(c)
Figure 3.1: The scrap materials used in Fluidity tests: (a) AA6063-10 voL% B4C cast billets; (b) AA6063-10 voL% B4C extruded plates; (c) AA1100-16 voL% B4C cast ingots; (d) AA1100-16 voL% B4C rolled sheets.
Table 3.1: The chemical compositions of matrix alloys AA6063 and AA1100. Alloy AA6063 (Matrix alloy) AA1100 (Matrix alloy) Si 0.2-0.6 0.95 Fe 0.35 Si+Fe Composition (wt%) Cu 0.10 0.05-0.20 Mn 0.10 0.05 Mg 0.45-0.9 Ti 1.0 1.5
3.3.2 Vacuum fluidity test procedures
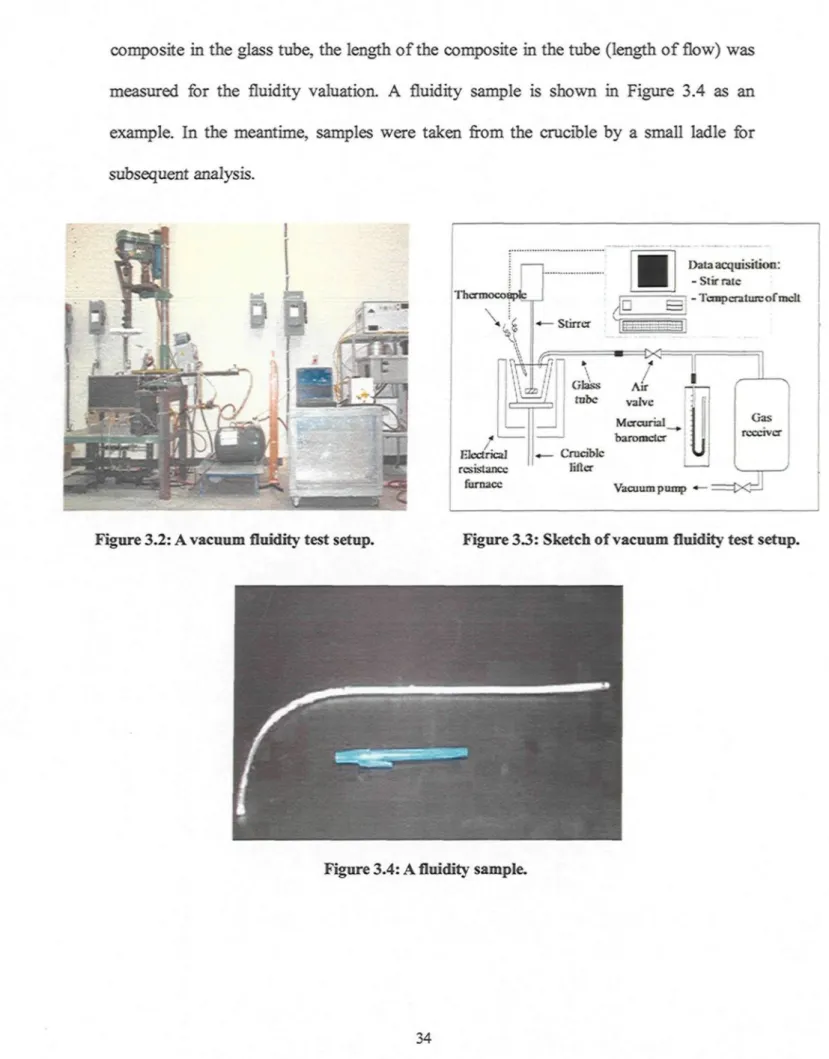
The experimental system for fluidity test is illustrated in Figure 3.2, as well as the
schematic diagram (Figure3.3). The AI-B4C MMCs were sectioned and remelted in the
electrical resistance furnace and held under mechanical stirring at a speed of 200 rpm
using an impeller to ensure a uniform distribution of B4C particles in the liquid. The melt
temperature was maintained at 730 °C ± 2 °C for approximately 510 min (for Al-10 vol.%
B4C composites) or 150 min (for Al-16 vol.% B4C composites). The holding time was
counted when the composite began to be remelted (around 660 °C). The consuming time
was about 30 min from remelting to the target temperature of 730 °C. In the fluidity tests,
the composite melt was drawn into a 6 mm internal diameter glass tube under the
predetermined 215 mmHg pressure. It should be noted that the curved part of the glass
tube was heated on the flat surface of a heater to a temperature of about 100 °C to prevent
breakage by thermal shock. While taking the fluidity samples, the tubes were immersed
into the melt, approximately 12.25 mm deep from the melt surface. A crucible lifter was
used to maintain a constant immersion depth of the glass tube in the melt. Fluidity
composite in the glass tube, the length of the composite in the tube (length of flow) was
measured for the fluidity valuation. A fluidity sample is shown in Figure 3.4 as an
example. In the meantime, samples were taken from the crucible by a small ladle for subsequent analysis.
Figure 3.2: A vacuum fluidity test setup.
~ -TcmpcraluicofmcU
Electrical resistance
furnace Vacuum pump
Figure 3.3: Sketch of vacuum fluidity test setup.
3.2 MICROSTRUCTURE ANALYSIS
3.2.1 Sample preparation
Sections from the scrap materials of cast billets, extruded plates and rolled sheets
before remelting were used for preparing metallography samples. In addition, the fluidity
samples of cast billets, extruded plates and rolled sheets, with holding times of 30, 60, 90,
120, 150, 330, 510 minutes respectively, were transversely sectioned at different positions
along the flow path, from flow entrance to flow end. Metallography samples were also
obtained from the crucible (called "crucible sample") at holding times of 30, 90, 150, 510
minutes. All these samples were subsequently embedded in a phenolic hot mounting resin
with carbon filler for grinding and polishing. The steps for preparation of metallographic
samples of AI-B4C composite are summarized in Appendix A. The finished samples were
taken for micro structure examination using an optical microscope and image analyzer
system. Fluidity samples of each material with holding times of 60 and 510 minutes, as
well as their original materials were mildly etched with 2.5 vol.% NaOH base solution at
50-60 °C for 60 seconds to reveal the micro structure of the thin oxide film, as well as
deeply etched using 10 vol.% NaOH base solution at 50-60 °C for approximately 70
seconds for the investigation of the spatial micro structure of particle agglomerates and
the change of T1B2 layer due to severe extrusion and rolling deformation processes.
3.2.2 Quantitative analysis of microstructure
The optical microscope equipped with a digital camera (Nikon ME 600) and an
image analysis system (CLEMEX JS-2000, PE4.0) allows the examination and
quantitative analysis of the microstructure, as illustrated in Figure 3.5.To investigate the
characterization of AI-B4C composite microstructures were developed in this research. These methods were applied to describe and quantitatively analyze the microstructures,
such as particle volume fraction, distribution, agglomeration and particle effective
volume fraction to establish the relationship between the microstructure of the composite and fluidity evolution.
Figure 3.5: Optical microscope and image analysis system (Clemex).
3.2.2.1 Particle volume fraction
To investigate the influence of particle volume fraction evolution on the fluidity of AI-B4C metal matrix composites during remelting and holding, the volume fraction
measurements of B4C particles and the reaction-induced particles with holding time was performed by analyzing the images obtained under optical microscopy. Images were
taken from the crucible samples of cast billets, ingots, extruded plates and rolled sheets
with holding times of 30, 90, 150, 510 minutes separately. For precise identification and quantitative measurement of the particles in the samples, the image analysis was carried out at 500x magnification and over 900 continuous fields (approximately 25 mm2) on the
surface of a crucible sample, which typically represented the entire micro structure.
The image analysis ran with a routine that the user must program in advance. The
routine developed for the measurement of particle volume fraction in AI-B4C composite
is shown in Appendix B, which could distinguish and characterize particles present in the
samples. Firstly, the distinction of different particles needed to be done by image analysis
as shown in Figures 3.6(a) and (b). In Figure3.6(a), which shows the microstructure of an
AI-B4C composite, the reaction-induced particles were fine TiB2 particles, gray AI3BC
particles around the dark gray particles of B4C and yellow AIB2 particles. The
Figure3.6(b) is the thresholded image, in which each of the different particles as shown in
Figure3.6(a) was identified by the intensity of light, hue and saturation of color (IHS)
associated with a given binary plane (bitplane), represented by a single color. Thus, the
optical image was covered with green areas corresponding to the bitplane (Intensity:
110-200, Hue: 61°-250° and Saturation: 0%-100%) associated with the A13BC particle, the red bitplane (I: 121-200, H: l°-60° and S: 0%-100%) for the AlB2particle, the blue bitplane (I: 50-110, H: 0°-360° and S: 0%-99%) for B4C and the pink bitplane (I: 120-200, H: 250°-359° and S: 0%-100%) corresponding to TiB2. Each of the bitplanes correlated with one type of particles. Finally, the area fractions (i.e. volume fraction) of
the solid particles represented by identified bitplanes were quantitatively and statistically
(a) (b)
Figure 3.6:(a) Optical image of A1-B4C composite; (b) thresholding image.
3.2.2.2 Particle distribution
In this project, a homogeneity parameter was proposed for characterizing the
variance of the particle distribution of cast, extruded and rolled AI-B4C metal matrix
composites to understand the influence of particle distribution on the fluidity evolution of
these materials after remelting and holding. To investigate particle distribution, the
crucible samples of cast billet and extruded plate with 10 vol.% B4C at 150 and 510 min
holding time were prepared, while such samples of cast ingot and rolled sheet with 16
vol.% B4C were taken at 30 and 150 min separately. These samples were then mounted
and metallographically polished for examination.
One mosaic image (942.5um><837um) was selected for the particle distribution
analysis, which could be considered to typically represent the particle distribution of the
whole mass. This image was captured at 500x magnification under the optical
microscope, consisting of 5x6 field images (Figure 3.7(a)). After that, according to
particle intensity, hue and saturation optical parameters, thresholding was performed to
for each category of particles, the distribution was analyzed. Take B4C particles for
example, the centroid of each B4C particle was recorded (Figure3.8(a)). In order to
generate data for comparison with the actual distributions, an image of random
distributions were created using a random number generator proposed by Park and
Miller[74] (Figure3.9(a)), with the same image size and identical particles quantity as those on the mosaic image. Subsequently, Dirichlet tessellation was carried out on the
sets of centroids on the sample image, as well as the random dots generated as shown in
Figure3.8(b) and 3.9(b), in which the centroids are ultimately dilated by the same rate in
all directions within their respective zones of influence until impingement occurs. A zone
of influence is a boundary that is situated at an equal distance between a centroid and its
neighbors. It should be noted that, for both tessellation images, edge cells are removed as
microstructurally unrepresentative. Finally, the tessellation cell areas for both images
were recorded by the image analyzer. The routine for characterization of particle
distribution homogeneity is listed in Appendix C.
In order to quantitatively identify the distribution homogeneity, one promising
parameter P has been extracted, which is based on the variance of the cell area
distribution. The larger the value of P, the more non-homogeneous the particle
distribution (random distribution P=l).
Variance of measured areas (urn4):
V = -f
j(A
i-A)
2(3.1)
1 "
rand / • \^i-rand
Homogeneity parameter:
rand
where, A is the average of the measured cell area, Armd is the average area of random distribution.
According to Equation (3.3), the homogeneity parameter P of B4C particles (Figure
3.8(a)) is PB4C =2.41, and Prandom=l, which consistent with the corresponding micro structure of distribution.
* t
i * * •
' ^ / i J ï^- 'lr^ ->•
(b)
(a)
(a)