by
Kuldeep KUMAR
MANUSCRIPT-BASED THESIS PRESENTED TO ÉCOLE DE
TECHNOLOGIE SUPÉRIEURE IN PARTIAL FULFILLMENT FOR THE
DEGREE OF DOCTOR OF PHILOSOPHY
Ph.D.
MONTREAL, JUNE 11, 2018
ÉCOLE DE TECHNOLOGIE SUPÉRIEURE
UNIVERSITÉ DU QUÉBEC
BY THE FOLLOWING BOARD OF EXAMINERS
Prof. Christian Desrosiers, Ph.D, Thesis Supervisor
Software and IT Engineering Department at École de technologie supérieure
Prof. Jean Marc Lina, Ph.D, Chair, Board of Examiners
Electrical Engineering Department at École de technologie supérieure
Prof. Matthew Toews, Ph.D, Member of the jury
Automated Production Engineering Department at École de technologie supérieure
Prof. Maxime Descoteaux, Ph.D, External Evaluator
Département d’informatique, Faculté des Sciences at Université de Sherbrooke
THIS THESIS WAS PRESENTED AND DEFENDED BEFORE A BOARD OF EXAMINERS AND PUBLIC
MAY 31 2018
This Ph.D. dissertation presents my research work carried out between 2013 and 2018 at École de technologie supérieure, under the supervision of professor Christian Desrosiers. The main objective of this research is to develop methods based on machine learning for human brain fingerprinting, an important step toward a fully-personalized analysis of brain characteristics.
This work resulted in a total of 3 journal papers, and 6 conference/workshop papers, published or under peer review, for which I am the first author. In addition, abstracts and posters based on this work were presented at leading venues. This dissertation focuses on the content of the three journal papers, presented in Chapters 2, 3 and 4. Other publications are listed in Appendix II. The Introduction section presents background information on human brain fingerprinting, as well as the main problem statement, motivations and objectives of this research. A review of relevant literature and key concepts follows in Chapter 1. After presenting the three journal papers (Chapters 2 to 4), Chapter 5 draws a brief summary of contributions and highlights some recommendations for further research.
First and foremost, I would like to express my profound and sincere gratitude to my Ph.D. su-pervisor, Prof. Christian Desrosiers. It all started with a MITACS Globalink internship during summer 2011. The interaction during that brief internship was the main reason I returned for Ph.D at ÉTS. I received immeasurable guidance and support during my Ph.D. study at École de technologie superiéure (ÉTS). I feel fortunate to have worked with him for the past years. His vision and passion for research, his curiosity to details and intense commitment to his work, have all inspired me. During this important period in my career and life, he provided encouragement, sound advice, and fruitful ideas. He always encouraged me to expand my horizons, giving me several opportunities to attend international conferences and support to do an international internship.
I am grateful to Prof. Kaleem Siddiqi, for instilling many research practices during the Shape Analysis Course, and for constant help and support in building my course project into a fruitful research. He has been a great source of inspiration and learning for me. I am glad to have an opportunity to work with Prof. Matthew Toews, who has been like a second supervisor for my Ph.D. I am always inspired by his enthusiasm and excitement for research ideas. I learned a lot from great discussions on my project, his feedback and constant support. My sincere thanks also go to Prof. Olivier Colliot, who provided me an opportunity to visit their team as an intern, and provided precious support and constructive feedback on my research. I thank the great support from Pietro Gori, Benjamin Charlier and researchers at Aramis Lab.
I also want to acknowledge and thank the jury members, Prof. Jean Marc Lina, and Prof. Maxime Descoteaux, for accepting to review my thesis, and sharing meaningful and interesting comments with me.
The smooth completion of this project was made possible by the financial support from MI-TACS, through their Globalink Graduate Fellowship program and their Globalink Research
Internship Award-Inria. I also appreciate the funding support from the FRQNT-REPARTI In-ternational training scholarship, and kind support and help from Prof. Denis Laurendeau.
I would also convey my heartfelt thanks to researchers contributing to the Human Connectome Project (HCP) and ADNI projects. The datasets from HCP and ADNI were a great resource for my research. I am also grateful to Sherbrooke Connectivity Imaging Lab (SCIL) for providing a labeled data used in one of my projects.
Though only my name appears on the cover of this thesis, many partners and collaborators contributed to these works. I would like to acknowledge my colleagues that have graduated or are still at ÉTS: Atefeh, Mellie, Faten, Rémi, Xavier, Houda, Fariba, Jihen, Veronica, Edgar, Laura, Gerardo, Ruth, Helmi, Arlen, Pierre-Luc, Bashar, Ruben, Alpa, Erick, Otilia, and oth-ers. Many thanks go to friends and colleagues in LIVIA and other groups: Smarjeet Sharma, Laurent Chauvin, and Jose Dolz. I am grateful to Prof. Luc Duong for great suggestions and encouraging talks, and Prof. Sylvie Ratté for making the lab lively. A warm thanks to Samuel, and Patrice for the servers. My sincere gratitude also goes to many collaborators for helping me in both living and research during my Ph.D. studies.
I would also like to thank my colleagues at Space Applications Center, Ahmadabad. In particu-lar, Santanu Chowdhury Sir, Meenakshi madam, Krishna Sir, and the AIPD. I am also grateful to the support and encouragement from my college friends, the KF’s, and my friends from school.
Last but not the least, I would give my special thanks to my wife, Saleem Yadav, for the constant support and encouragement over the last year of my Ph.D. My grandparents and my brother Sandeep for their unconditional support. Finally, my sincere and heartfelt thanks to my parents Ranbir Singh and Sumitra Devi. You are the source of inspiration for me. This thesis
“Success is the sum of small efforts, repeated day in and day out”
Kuldeep KUMAR RÉSUMÉ
Comprendre la structure et la fonction du cerveau humain est un problème de taille, essentiel au développement de traitements efficaces pour les maladies neurologiques comme la maladie d’Alzheimer et la maladie de Parkinson. Alors que la plupart des études font des inférences au niveau de groupes d’individus, les chercheurs ont établi que la structure et la fonction du cerveau varient d’un individu à un autre. Motivés par cette observation, plusieurs travaux récents se sont consacrés au développement de caractérisations compactes de cerveaux indi-viduels, appelées empreintes du cerveau. Jusqu’à présent, ces études se sont principalement concentrées sur des empreintes à base d’une seule modalité, en particulier, utilisant la con-nectivité fonctionnelle. Cependant, plusieurs aspects importants n’ont pas été abordés dans ces études. Premièrement, le potentiel des empreintes cérébrales basées sur la connectivité structurelle n’a pas été exploré à fond. Ceci est en partie dû aux défis découlant des données de tractographie, y compris l’absence d’un étalon de comparaison et la variabilité des faisceaux de fibres. Deuxièmement, en raison des difficultés liées à la combinaison de plusieurs modalités dans un modèle unique, le développement d’une empreinte cérébrale multimodale demeure à ce jour un problème non-résolu. Cependant, puisque chaque modalité capture des propriétés uniques du cerveau, la combinaison de plusieurs modalités pourrait fournir une information plus riche et plus discriminante. Cette thèse aborde ces défis à travers trois contributions dis-tinctes.
La première contribution consiste en des approches efficaces, basées sur l’apprentissage de dictionnaires par noyaux et les aprioris de parcimonie, pour la segmentation des fibres de la matière blanche et la caractérisation de leur variabilité inter-sujet. Le principe général des approches proposées est d’apprendre un dictionnaire compact de fibres capable de décrire l’ensemble des données, et d’encoder les faisceaux comme une combinaison parcimonieuse de plusieurs prototypes du dictionnaire. Ces approches permettent d’assigner des fibres à plus d’un faisceau, ce qui les rend mieux adaptées aux scénarios où les fibres ne sont pas clairement séparées, les faisceaux se chevauchent, ou lorsqu’il existe une variabilité inter-individuelle im-portante. De plus, ces approches n’exigent pas une représentation explicite des fibres et peuvent être adaptées à n’importe quelle représentation de fibres ou mesure de distance / similarité. Des expériences sur un jeu de données étiquetées et des données du Human Connectome Project (HCP) mettent en évidence la capacité de ces approches à regrouper les fibres en faisceaux plausibles, et illustrent les avantages de l’utilisation d’aprioris de parcimonie.
La deuxième contribution est une nouvelle empreinte cérébrale, appelée Fiberprint, la pre-mière à capturer la géométrie des fibres de matière blanche dans les individus. Cette empreinte utilise les approches d’apprentissage de dictionnaire provenant de la première contribution pour représenter les fibres de sujets dans un espace commun correspondant aux faisceaux
proémi-nents. Des empreintes cérébrales compactes sont générées en appliquant une fonction de re-groupement pour chaque faisceau, encodant les propriétés uniques des fibres telles que leur densité le long des faisceaux. Dans une analyse à grande échelle utilisant les données de 861 sujets du HCP, l’empreinte proposée est capable d’identifier des exemplaires du même individu ou des sujets génétiquement liés en utilisant un nombre limité de fibres.
Enfin, la troisième contribution de cette thèse est une première méthode automatique pour générer des empreintes cérébrales à partir de données multimodales. L’idée de base de cette méthode est de représenter chaque image comme un ensemble de caractéristiques locales, et d’utiliser ces caractéristiques multimodales pour représenter des sujets dans un sous-espace de basse dimension appelé variété. Des expériences utilisant l’IRM pondérée T1/T2, l’IRM de diffusion et l’IRM fonctionnelle au repos de 945 sujets du HCP démontrent l’avantage de combiner plusieurs modalités, les empreintes multimodales étant plus discriminantes que celles générées par les modalités individuelles. Les résultats mettent également en évidence le lien entre la similarité des empreintes et la proximité génétique, les jumeaux monozygotes ayant des empreintes plus similaires que les jumeaux dizygotes ou non-jumeaux.
Le travail présenté dans cette thèse peut être bénéfique à diverses études en neuroscience. Ainsi, les approches de segmentation présentées dans la thèse fournissent un moyen flexible et effi-cace pour analyser des courbes 3D comme celles provenant de la tractographie, et conviennent aux analyses à grande échelle de la connectivité structurelle. Fiberprint, qui est la première empreinte cérébrale caractérisant la géométrie des fibres de la matière blanche, offre une tech-nique puissante pour explorer les différences individuelles en termes de connectivité de la matière blanche et leurs relations avec la génétique. En incluant des informations sur la mi-crostructure le long de faisceaux, l’empreinte proposée pourrait également être utilisée pour définir de nouveaux biomarqueurs pouvant détecter et suivre la progression de maladies neu-rologiques comme la maladie de Parkinson. Enfin, l’empreinte cérébrale multimodale issue de cette recherche complémente les efforts en cours pour analyser les caractéristiques indi-viduelles du cerveau en permettant de comparer et de contraster la contribution de différentes modalités d’imagerie. Elle peut ainsi mener à de nouvelles connaissances sur la variabilité de la structure et de la fonction du cerveau, ce qui pourrait aider au développement de stratégies de traitement personnalisées.
Mots clés: Empreintes cérébrales, Différences individuelles, IRM, Données de jumeaux, HCP, Représentation parcimonieuse, Apprentissage de dictionnaire, Méthodes à noyaux, Fibres de matière blanche, Imagerie multi-modale, Variété
Kuldeep KUMAR ABSTRACT
Understanding the structure and function of the human brain is an outstanding problem that is critical to the development of efficient treatments for neurological diseases like Alzheimer’s and Parkinson’s. While most studies make group level inferences, researchers have estab-lished that structure and function show variability across individuals. Motivated by these, re-cent studies have focused on defining compact characterizations of individual brains, called brain fingerprints. So far, these studies have mostly focused on single modalities, with func-tional connectivity based fingerprints gaining considerable research interest. However, there are certain aspects which have not been addressed. First, the potential of fingerprints based on structural connectivity has not been fully explored. This is in part due to the challenges arising from fiber tracking data, including lack of gold standard and bundle variability. Sec-ond, due to the challenges of combining multiple modalities in a single framework, defining a multi-modal brain fingerprint remains to this day an elusive task. Yet, since each modality captures unique properties of the brain, combining multiple modalities could provide a richer, more discriminative information. This thesis addresses these challenges through three distinct contributions.
The first contribution consists of efficient approaches, based on kernel dictionary learning and sparsity priors, for segmenting white matter fibers and characterizing their inter-subject vari-ability. The general principle of the proposed approaches is to learn a compact dictionary of training streamlines capable of describing the whole dataset, and to encode bundles as a sparse combination of multiple dictionary prototypes. These approaches allow streamlines to be as-signed to more than one bundle, making them more suitable for scenarios where streamlines are not clearly separated, bundles overlap, or when there is important inter-individual variability. Additionally, they do not require an explicit representation of the streamlines and can extend to any streamline representation or distance/similarity measure. Experiments on a labeled set and data from HCP highlight the ability of our approaches to group streamlines into plausible bundles, and illustrate the benefits of employing sparsity priors.
The second contribution is a novel brain fingerprint, called Fiberprint, which is the first to cap-ture white matter fiber geometry in individual subjects. This fingerprint leverages the sparse dictionary learning approaches of the first contribution to map streamlines of subjects to a com-mon space representing prominent bundles. Compact fingerprints are generated by applying a pooling function for each bundle, encoding unique properties of streamlines such as their den-sity along bundles. In a large-scale analysis using data from 861 HCP subjects, the proposed Fiberprint is shown capable of identifying exemplars from the same individual or genetically-related subjects, with only a small number of streamlines.
Lastly, the third contribution of this thesis is a first data-driven framework to generate brain fingerprints from multi-modal data. The key idea is to represent each image as a bag of lo-cal features, and use these multi-modal features to map subjects in a low-dimension subspace called manifold. Experiments using the T1/T2-weighted MRI, diffusion MRI, and resting state fMRI data of 945 HCP subjects demonstrate the benefit of combining multiple modalities, with multi-modal fingerprints more discriminative than those generated from individual modal-ities. Results also highlight the link between fingerprint similarity and genetic proximity, with monozygotic twins having more similar fingerprints than dizygotic or non-twin siblings. The work described in this thesis can be of benefit to various neuroscience studies. The seg-mentation approaches presented in the thesis provide a flexible and efficient way to analyze 3D curves like tractography streamlines, and is suitable for large-scale analyses of structural connectivity. The proposed Fiberprint, which is the first brain fingerprint characterizing white matter fiber geometry, offers a powerful technique to explore individual differences in terms of white matter connectivity and its relationship to genetics. By including along-tract infor-mation on microstructure, it could also be used to define novel biomarkers for detecting and tracking the progression of neurological diseases like Parkinson’s. Finally, the multi-modal brain fingerprint stemming from this research complements ongoing efforts to analyze indi-vidual brains characteristics by allowing to compare and contrast the contribution of different imaging modalities. It can thus lead to new insights on the variability of both brain structure and function, which could help the development of personalized treatment strategies.
Keywords: Brain fingerprinting, Individual differences, MRI, HCP twin data, Sparse coding, Kernel dictionary learning, White matter fibers, Multi-modal, Manifold
INTRODUCTION . . . 1
0.1 Problem statement and motivation . . . 1
0.2 Research objectives and contributions . . . 3
0.3 Thesis outline . . . 7
CHAPTER 1 LITERATURE REVIEW . . . 9
1.1 Basics of the human brain . . . 9
1.2 Imaging the brain: basics of MRI . . . 10
1.2.1 sMRI: imaging the anatomy . . . 12
1.2.2 dMRI: imaging white matter architecture . . . 13
1.2.3 fMRI: imaging brain activity . . . 13
1.3 Individual differences in neuroimaging . . . 14
1.3.1 Genetic basis of individual differences . . . 15
1.3.2 Individual differences in brain disorders . . . 16
1.3.3 Brain fingerprinting . . . 17
1.4 Streamline clustering and analysis . . . 20
1.5 Methodological concepts explored in the thesis . . . 23
1.5.1 Sparse coding . . . 23
1.5.2 Manifold embedding . . . 24
1.5.3 Bag of features . . . 26
1.6 Summary . . . 26
1.6.1 Studies on individual differences: potential and utility . . . 27
1.6.2 Brain fingerprinting: challenges and opportunities . . . 27
CHAPTER 2 WHITE MATTER FIBER ANALYSIS USING KERNEL DICTIONARY LEARNING AND SPARSITY PRIORS . . . 29
2.1 Abstract . . . 29
2.2 Introduction . . . 29
2.3 Related works . . . 32
2.3.1 White matter fiber analysis . . . 32
2.3.2 Sparse coding for neuroimaging . . . 34
2.4 Kernel dictionary learning for streamline clustering . . . 35
2.4.1 Dictionary learning and the k-means algorithm . . . 35
2.4.2 Kernel k-means . . . 36
2.4.3 Non-negative kernel sparse clustering . . . 37
2.4.4 Extension 1: group sparse kernel dictionary learning . . . 39
2.4.5 Extension 2: kernel dictionary learning with manifold prior . . . 41
2.5 Experimental results and analysis . . . 42
2.5.1 Data and pre-processing . . . 42
2.5.3 Comparison of methods and distance measures . . . 46
2.5.4 Impact of sparsity . . . 47
2.5.5 Group sparsity prior . . . 48
2.5.6 Manifold regularization prior . . . 50
2.5.7 Validation on HCP data . . . 51
2.5.8 Application to automated tractography segmentation . . . 52
2.6 Discussion . . . 54
2.6.1 Main findings . . . 55
2.6.2 Limitations and additional considerations . . . 57
2.7 Conclusion . . . 58
2.8 Supplement results . . . 59
2.8.1 Non-negative kernel sparse clustering: Algorithm summary . . . 59
2.8.2 Group sparse kernel dictionary learning: Algorithm summary . . . 60
2.8.3 Kernel dictionary learning with manifold prior: Algorithm summary . . 62
2.8.4 Group sparsity and manifold prior visualization . . . 63
2.8.5 Results on multi-subject MIDAS dataset (KSC+MCP) . . . 64
2.8.6 Additional results on Human Connectome Project subjects . . . 65
2.8.7 Multi-subject clustering as dictionary . . . 66
2.8.8 Application: automated segmentation of new subject streamlines . . . . 68
CHAPTER 3 FIBERPRINT: A SUBJECT FINGERPRINT BASED ON SPARSE CODE POOLING FOR WHITE MATTER FIBER ANALYSIS . . . . 71
3.1 Abstract . . . 71
3.2 Introduction . . . 72
3.3 Related work . . . 75
3.3.1 Representation and analysis of white matter fiber geometry . . . 75
3.3.2 Sparse coding for neuroimaging . . . 76
3.3.3 Subject fingerprinting . . . 77
3.4 Materials and methods . . . 78
3.4.1 Data and pre-processing . . . 79
3.4.2 Learning the fiber trajectory dictionary . . . 80
3.4.3 Generating the subject fingerprints . . . 84
3.5 Experiments and results . . . 87
3.5.1 Impact of method parameters . . . 88
3.5.1.1 Pooling function . . . 90
3.5.1.2 Dictionary size . . . 92
3.5.1.3 Independent dictionary sets . . . 93
3.5.1.4 Encoding sparsity . . . 93
3.5.1.5 Fiber tracking parameters . . . 94
3.5.1.6 Inclusion of cerebellum . . . 96
3.5.1.7 Number of fingerprint fiber trajectories . . . 96
3.5.2 Subject identification . . . 98
3.5.2.1 Same subject identification . . . 99
3.5.2.3 Comparison with a global fingerprint based on T1-weighted
images . . . 104
3.5.3 Bundle-wise significance analysis . . . 106
3.5.3.1 Differences across genetically-related subjects . . . 107
3.5.3.2 Differences related to gender . . . 107
3.6 Discussion . . . 108
3.6.1 Findings related to the parameter study . . . 108
3.6.2 Findings related to subject identification tests . . . 111
3.6.3 Findings related to bundle significance tests . . . 112
3.6.4 Informativeness of fiberprint compared to fingerprints based on whole T1-weighted images . . . 113
3.6.5 Additional considerations . . . 113
3.7 Conclusion . . . 115
3.8 Supplement results . . . 116
3.8.1 Dictionary bundle visualization . . . 116
3.8.2 Comparison of subject fingerprint across instances and Encoding sparsity117 3.8.3 Impact of Handedness on subject identification . . . 118
3.8.4 Impact of age on twin identification . . . 118
3.8.5 Twin fingerprint analysis . . . 119
3.8.6 Additional Plots on bundle significance tests . . . 121
CHAPTER 4 MULTI-MODAL BRAIN FINGERPRINTING: A MANIFOLD AP-PROXIMATION BASED FRAMEWORK . . . 125
4.1 Abstract . . . 125
4.2 Introduction . . . 126
4.3 Materials and methods . . . 131
4.3.1 Data and pre-processing . . . 132
4.3.2 Multi-modal brain fingerprint . . . 134
4.3.2.1 Bag of feature (BoF) representation of subjects . . . 134
4.3.2.2 Subject proximity graph . . . 135
4.3.2.3 Manifold embedding . . . 136
4.3.2.4 Out-of-sample extension . . . 137
4.3.3 Computational efficiency . . . 138
4.3.4 Evaluation measures . . . 139
4.4 Experiments and results . . . 141
4.4.1 Manifold approximation analysis . . . 142
4.4.2 Identification of genetically-related subjects . . . 145
4.4.3 Impact of various factors . . . 149
4.4.3.1 Image alignment . . . 149
4.4.3.2 Scan resolution . . . 150
4.4.3.3 Inclusion of skull . . . 150
4.4.3.4 Subject age . . . 151
4.4.4 Comparison to baseline fingerprint . . . 151
4.4.6 Applications . . . 153
4.4.6.1 Zygosity label correction . . . 153
4.4.6.2 Retest and duplicate scan identification . . . 154
4.4.6.3 Local feature correspondence analysis . . . 155
4.5 Discussion . . . 161
4.6 Conclusion . . . 166
4.7 Supplement results . . . 167
4.7.1 Mean Average Precision results . . . 167
4.7.1.1 Significance testing across twin/sibling types . . . 167
4.7.1.2 Significance testing: Modality vs Modality comparisons . . . 169
4.7.1.3 DTI vs HARDI dMRI measures . . . 169
4.7.1.4 rfMRI network matrices as fingerprints . . . 171
4.7.1.5 FreeSurfer derived measures as fingerprint . . . 173
4.7.1.6 Comparison of sibling types: FS, MHS, PHS . . . 173
4.7.2 Relative informativeness of fingerprints . . . 175
4.7.3 Mean recall@k results . . . 175
4.7.3.1 Mean recall@k plots . . . 175
4.7.3.2 Fingerprint comparisons using mean recall@10 . . . 177
4.7.4 Impact of age . . . 178
4.7.5 Extension to T1w-by-T2w ratio images (myelin content) . . . 178
4.7.6 Scale-space visualization of features correspondences . . . 179
CHAPTER 5 CONCLUSION . . . 181
5.1 Summary of contributions . . . 181
5.2 Limitations and recommendations . . . 183
Appendices . . . 187
APPENDIX I PUBLICATIONS DURING PH.D. STUDY . . . 187
APPENDIX II CODE AVAILABILITY . . . 191
APPENDIX III COPYRIGHT PERMISSIONS FOR FIGURES USED IN LITERATURE REVIEW . . . 193
Page Table 1.1 Summary of brain fingerprinting studies . . . 28 Table 2.1 Clustering accuracy of our KSC method (Smax= 3), kernel k-means
(KKM), spectral clustering (Spect), and hierarchical clustering (HSL), using the Hausdorff, MCP and EP distances, on the SCIL dataset. For KSC, KKM and Spect, the mean accuracy over 10 initializations with m=10 is reported. The best results for a distance
and accuracy metric are shown in boldface type. . . 45 Table 2.2 Clustering accuracy of proposed methods using MCP distances
and three types of priors: L1 norm sparsity alone (L1), with group sparsity (L1+L21), and with manifold regularization (L1+Manifold). Reported values are the mean accuracy over 10 initializations with (input) m=10 clusters. The best result for each
accuracy metric is shown in boldface type. . . 49 Table 3.1 Same-subject instance identification. Mean precision@1 (in %)
for a varying number of fiber trajectories using the RMS pooling function and all 851 subjects, in a nearest neighbor analysis. The second column shows results for fingerprints generated from the full brain. The third column shows result for without-cerebellum fingerprints. The right columns evaluate the contribution of fiber trajectories from a specific hemisphere. Note that the without-cerebellum fingerprints are obtained by removing without-cerebellum bundles from the full brain fingerprint, and the hemisphere specific fingerprints are obtained from the full brain fingerprints by keeping hemisphere-specific bundles only. Also, the first column indicates the number of fiber trajectories used for generation of the full brain fingerprint. Maximum precision@1 of 0.4% was obtained for the randomly generated lists of k-nearest neighbors using the full brain
fingerprint. . . 100 Table 3.2 Informativeness of our fiberprint compared to a fingerprint based
on whole T1-weighted images for identifying genetically-related subjects. Column 1 gives the proportion of twins/siblings identified by both fingerprints, Column 2 and 3 the proportion of twins/siblings identified by only one fingerprint, and column 4 the proportion of twins/siblings not identified by any of the fingerprints. A sibling is considered as identified if his/her fingerprint is within
the list of k = 30 nearest neighbors. Number of identification tasks:
164-MZ, 164-DZ, and 215-NT. We report mean over 5 fiberprint instances. 106 Table 3.3 Same-subject instance identification. Mean precision@1 (in %)
for a varying number of fiber trajectories using the RMS pooling function and 80 Left handed and 80 Right handed subjects, in a nearest neighbor analysis. The second column shows results for fingerprints generated from the full brain. The third column shows result for without-cerebellum fingerprints. The right columns evaluate the contribution of fiber trajectories from a specific hemisphere. Note that the without-cerebellum fingerprints are obtained by removing cerebellum bundles from the full brain fingerprint, and the hemisphere specific fingerprints are obtained from the full brain fingerprints by keeping hemisphere-specific bundles only. Also, the first column indicates the number of fiber trajectories used for generation of the full brain fingerprint. Maximum precision@1 of 0.6% was obtained for the randomly
generated lists of k-nearest neighbors using the full brain fingerprint. . . . 121 Table 4.1 Demographics. We considered the HCP1200 release subjects with
structural MRI, diffusion MRI, and resting state fMRI netmats data, and for which the HasGT field is true (genetically verified data). The family structure and links are obtained from the output of hcp2blocks.m script listed in data release manual. The sibship sizes
are between 1 and 6. . . 133 Table 4.2 Mean average precision (MAP) obtained with different modality
combinations for the identification of genetically-related subjects:
monozygotic twins (MZ), dizygotic twins (DZ) and full siblings (FS). . . 146 Table 4.3 Relative informativeness of fingerprints from different modalities.
Comparison between modalities or their combination for the task of identification of a given sibling type. The reported values are relative percentages of MZ/DZ twin identification for two modalities, with Mod1 representing successful identifications by modality 1 only. The total number of identification tasks is 238 and 126 for MZ and DZ respectively. Note: identification of twin 1 for twin 2 and vice-versa are considered two separate tasks. The identification is considered a success if the twin is identified within
the 10 nearest neighbors of a subject (among 944 subjects). . . 148 Table 4.4 Analysis of self-reported zygosity to genetically verified zygosity
detection. Relative percentage of DZ-to-MZ twin identifications by the proposed framework and the full-image baseline. Total number
of identification tasks is 56. Identification is considered a success if
the twin is identified within the 10 nearest neighbors of a subject. . . 154 Table 4.5 Differences in feature match counts obtained for different sibling
types in various brain regions, using T1w and T2w. We report Holm–Bonferroni corrected p-values (-log10 scale) measured using an unpaired t-test. Significant results with corrected p-value < 0.01
are highlighted using bold font. . . 159 Table 4.6 Hemisphere asymmetry analysis. For a given modality and
twin type, we compare feature match count differences across hemisphere for major structures. Differences are reported as Holm–Bonferroni corrected p-values (-log10 scale) measured using an unpaired t-test, significant results (corrected p-value < 0.01)
highlighted using bold font. . . 161 Table 4.7 Significance testing across twin/sibling types for a given modality,
using the distribution of average precision (AveP) values obtained for the the task of twin/sibling identification. We report -log10 p-values for unpaired t-test for MZvsDZ, MZvsFS, and DZvsFS for each modality. Note the samples sizes are matched for each comparison (number of MZ pairs and FS pairs are matched to DZ pairs) based on age, and are fixed across modalities. p-values
≤ 0.01 are in bold. . . 168
Table 4.8 Modality vs modality comparison and contrast. Comparisons between two modalities (or their combinations), for a given sibling type, for the task of identification of a given sibling type. -log10 p-values are reported for unpaired t-test performed using the distribution of average precision values. p-values ≤ 0.01 are in
bold. (All MRI= T1w+T2w+FA+rfMRI) . . . 170 Table 4.9 Mean average precision (MAP) table comparing diffusion MRI
based measures: DTI and GQI based indices (native space) for the
task of genetically related subject identification. . . 171 Table 4.10 Functional Connectivity Profiles as fingerprint: Impact of Nodes
and correlation. Mean average precision (MAP) table comparing resting state fMRI network matrices (netmats) for the task of genetically related subject identification. Manifold approximation is obtained in the form of a subject proximity graph by computing similarity between netmats using the Pearson Correlation (Finn
Table 4.11 Freesurfer derived measures as fingerprint. Mean average precision (MAP) table comparing freesurfer derived measures: Vol, Thck, Area, Vol+Thck+Area as fingerprints for the task of genetically related subject identification. The measures are obtained from the csv file provided by HCP (each measure converted to zscore column-wise i.e. across subjects, and NxN subject proximity graph computed using pairwise Pearson correlation, Vol measures are ICV
corrected.) . . . 173 Table 4.12 Non-twin sibling comparison. Mean average precision (MAP) table
comparing different modalities for the task of non-twin sibling identification (full-siblings (FS), maternal half-siblings (MHS),
paternal half-siblings(PHS)). . . 174 Table 4.13 Relative informativeness of fingerprints from two modalities.
Percentage of full sibling (FS) identification for two modalities. Total number of identification tasks is 1092. We consider 10 nearest neighbors, and if the sibling (one for a given task) is identified within these neighbors, identification is considered a success (among 944
subjects). (All MRI= T1w+T2w+FA+rfMRI) . . . 174 Table 4.14 Comparison across fingerprints. Mean recall@10 values. Note: the
data size and processing may vary across the fingerprints, however, the values are on HCP data with more than 850 subjects in each case,
thus providing an approximate comparison. . . 177 Table 4.15 Impact of age along with significance testing (right half of the
table, with corresponding hypothesis in last columns). Mean avg precision (MAP) table comparing different modalities for the task of genetically-related subject identification, with MZ/DZ divided into 2 groups based on median age of 29, and FS divided into 2 groups based on median age difference of 3 years. In both case, set1 correspond to sibling pairs with age (difference) below or equal to the median, and set2 to those above the median. Right side shows
-log10p-values for unpaired t-test, with p-values < 0.01 in bold font. . . . 178 Table 4.16 Impact of skull inclusion and extension to T1w/T2w MRI ratio
images (myelin content). Mean average precision (MAP) table comparing different modalities for the task of genetically related subject identification. Facial features are not analyzed, and all
Page Figure 0.1 Sketch of the chapters of the thesis. . . 8 Figure 1.1 Diagram of a neuron (Source:https://en.wikipedia.org/wiki/Neuron) . . . . 9 Figure 1.2 Left: Coronal slice of a healthy human brain with tissue types
(Source: http://elearningbiology.weebly.com); Right: Functional areas of human brain (Source: https://en.wikipedia.org/wiki/
Human_brain) . . . 10
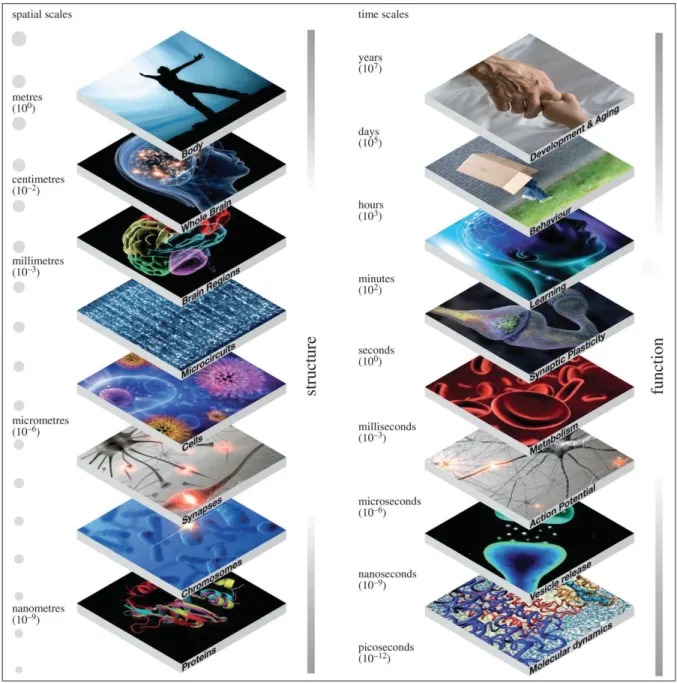
Figure 1.3 Illustration of brain as a multi-scale (spatial and temporal) organ.
(Source: (Frackowiak and Markram,2015)) . . . 11 Figure 1.4 Illustration of the basic principle of MRI. (Source: (Source:
(Hassibi et al.,2009)) . . . 12 Figure 1.5 Illustration of individual differences in structure, function, and
white matter architecture. Top left: folding patterns of the cortex surface (structure) (Source: (Durrleman, 2010)); Right: resting state fMRI based functional areas (Source: (Wang et al., 2015)); Bottom left: corticospinal tract bundles (green and red represent, a low and a high membership of a streamline to the bundle,
respectively.) (Source: (Kumar et al.,2017c)) . . . 16 Figure 1.6 Overview of brain fingerprinting approaches. Top row: functional
connectome fingerprint generation summary (Source: (Pedersen et al.,2015)); Middle row: diffusion MRI based Local connectome fingerprint (Source: (Yeh et al., 2016c)); and Bottom row:
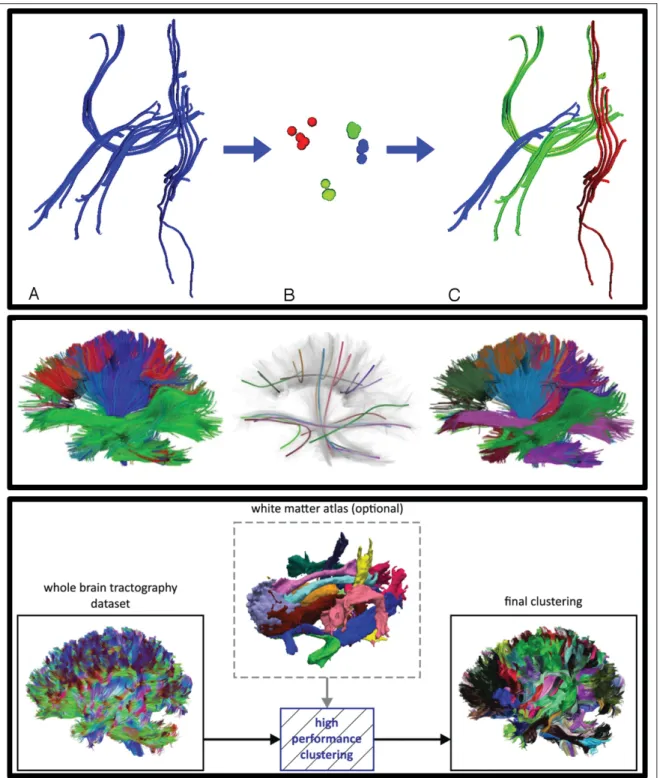
structural MRI based Brainprint (Source: (Wachinger et al.,2015a)) . . . 19 Figure 1.7 Illustrative examples of clustering approaches. Top row: Spectral
embedding based streamline clustering (Source: O’Donnell et al. (2006)), Middle row: QuickBundles, bundle centroid estimation based approach (Source: (Garyfallidis et al., 2012)). Bottom row:
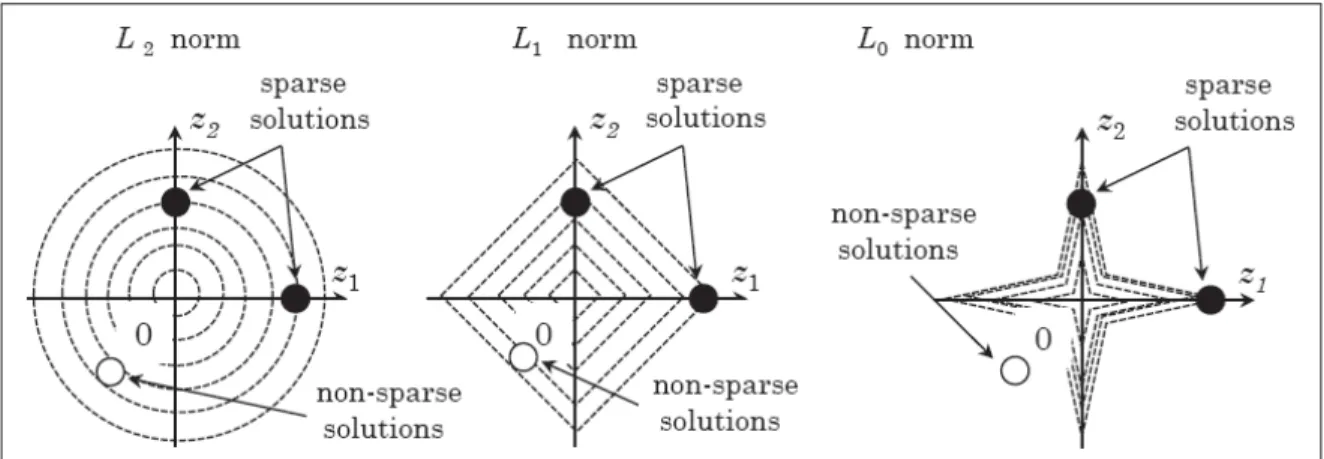
Atlas based approach (Source: (Ros et al.,2013)) . . . 21 Figure 1.8 Illustrative example of sparse coding. . . 24 Figure 1.9 Illustrative example of L0, L1 and L2 norms in the 2D plane.
Figure 2.1 Illustrative example. Clustering of the corpus callosum by our method: hard clustering (left), and membership of each streamline to two bundles (center and right). Dark green represents a zero
membership and bright red a maximum membership to the bundles. . . . 31 Figure 2.2 Right sagittal (top) and inferior axial (bottom) views of the ground
truth, and bundles obtained by KSC (Smax = 3) using the Haus,
MCP and EP. . . 46 Figure 2.3 Mean ARI obtained on the SCIL dataset by KSC (Smax = 1, 2, 3),
KKM and Spect, using Haus (left), MCP (center), EP (right); for
varying m. . . 47 Figure 2.4 Membership level of streamlines to two different bundles (left
and center), and importance of each streamline in defining the prototype of a bundle (right). Blue means a null membership/importance, while non-zero values are represented by
a color ranging from green (lowest value) to red (highest value). . . 48 Figure 2.5 (a) Mean ARI obtained on the SCIL dataset by GKSC, MCP+L1,
MCP+Manifold and Spect, using MCP; for varying m; (b) mean and standard deviation of final m for varying input m; (c)
Distribution of bundle sizes for a sample run using m = 20. . . 48 Figure 2.6 (a) Mean number of non-zero assignment weights per streamline,
for λ2/μ = 80 and increasing λ1/μ. (b) Mean number of streamlines per bundle, for λ1/μ = 0.1 and increasing λ2/μ. (c)
Cost function value at each of a sample run for MCP+L1+L21. . . 50 Figure 2.7 (a) Percentage overlap with EP based Laplacian prior matrix,
compared with baseline initialization of spect, for varying m. (b) Mean of avg SI for KSC+MCP clustering of 10 unrelated HCP
subjects for varying m. . . 51 Figure 2.8 Color coded visualization of sparse code memberships of
streamlines in Corpus Callosum (CC) (row-1,2), left Inferior Occipitofrontal Fasciculus (IOF) and Cortico-Spinal-Tract (CST)
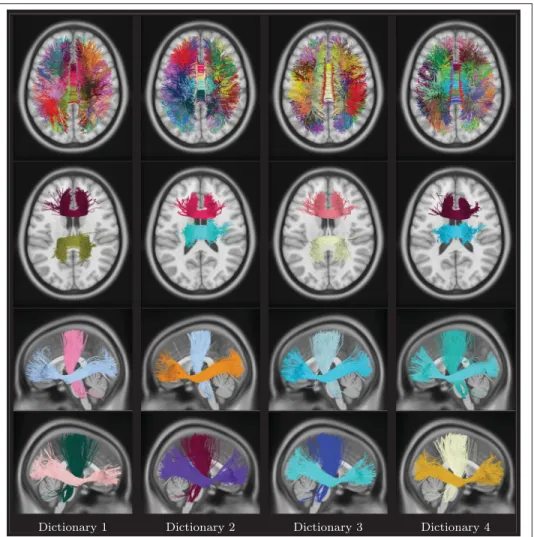
(row-3,4); and right IOF and CST (row-5,6). . . 53 Figure 2.9 Unsupervised multi-subject dictionary visualization. Four different
dictionaries and corresponding bundles. Top row: Axial view of full dictionary with a unique color assigned to each bundle; Second row: Anterior Body, and Central Body bundles in Corpus Callosum; Third row: Left CST, and Left IOF bundles; Last row: Right CST, and Right IOF bundles. Each dictionary has a different
color code, while the bundles respect that dictionary color-code.
(m=50 bundles). . . 54 Figure 2.10 Automated segmentation visualization. Top row: full segmentation
of 4 HCP subjects using dictionary D1, with a unique color assigned to each cluster, and same color code as D1. Rows 2-7: sparse code (bundle membership) visualization for the posterior body CC, anterior body CC, left IOF, left CST, right IOF, and right CST bundles. Membership values are represented by a color
ranging from green (no membership) to red (highest membership). . . 55 Figure 2.11 Right sagittal (top) and inferior axial (bottom) views of the ground
truth (left), and bundles obtained by MCP+L1+L21 (middle,
m=20, final m=10), and MCP+L1+Lap (right, m=10). . . 64 Figure 2.12 MIDAS: Mean of average SI using MCP: varying m mean over
12 subjects (left); for m = 35 for each subject (middle);
Convergence plot (right for KSC+MCP ) . . . 65 Figure 2.13 Visualization of clustering output for 10 unrelated HCP subjects
using KSC, for m = 50. . . 66 Figure 2.14 Visualization of clustering output for subject 1 using KSC, for
varying m. . . 67 Figure 2.15 Automated segmentation of 5 instances of subject 1 using
dictionary D1. . . 68 Figure 3.1 Pipeline of the proposed Fiberprint approach based on sparse code pooling.78 Figure 3.2 Dictionary visualization. Visualization of m = 50 fiber trajectory
prototypes learned from 10 subjects, with an unique color assigned to each dictionary prototype. For this simplified visualization each fiber trajectory is assigned to a single prototype by taking the maximum for each row of the matrix A. (superior axial, left
sagittal, and anterior coronal views respectively) . . . 83 Figure 3.3 Visualization of sparse code representation of fiber trajectories
from four subjects. Each fiber trajectory is assigned to a single bundle by taking the maximum of the sparse code vector. Bundles are represented using the same colors as in Figure 3.2. (superior axial (top), left sagittal (middle), and anterior coronal (bottom)
views respectively) . . . 85 Figure 3.4 Color coded visualization of sparse code memberships of fiber
corticospinal bundles from four subjects. Green and red represent, a low and a high membership of a fiber trajectory to a bundle, respectively. Fiber trajectories with a zero membership to the
bundle are removed for a simplified visualization. . . 86 Figure 3.5 Subject fingerprint visualization. Color coded bar plot
representation for four subjects (rows) and three pooling functions
(RMS, Mean, and Max; columns), plotted as a value per bundle ID. . . . 88 Figure 3.6 Subject fingerprint visualization. Color coded bundles from four
subjects representing the magnitude of their corresponding RMS pooling function values. We use the same color code scheme as in Figure 3.5. (superior axial (top), left sagittal (middle), and anterior
coronal (bottom) views respectively) . . . 89 Figure 3.7 Impact of pooling functions. Euclidean distance between
fingerprints of 10 subjects with 5 instances each (top). Probability normalized histogram (middle) and box plot (bottom) for distances between same subject (SS) and different subject (DS) instances for all 851 subjects. Pooling functions: RMS, Mean, and Max (left to
right columns respectively) . . . 91 Figure 3.8 Impact of the size of the dictionary and the level of sparsity Smax
on subject fingerprint. Box plot of Euclidean distances between same-subject (red) and different-subject (blue) instances for seven different dictionary sizes using all 851 subjects (left); and for
varying level of the sparsity parameter Smaxusing 10 subjects (right). . . 92 Figure 3.9 Impact of independent dictionary sets and fiber tracking parameters
on subject fingerprints. Box plots of Euclidean distances between same-subject (red) and different-subject (blue) instances using 10 subjects for: independent sets of dictionaries; the number of output fiber trajectories; the fiber tracking approach; the turning angle threshold; and the minimum length of fiber trajectories. (d-prime
values are reported along the right axis of each plot) . . . 95 Figure 3.10 Impact of cerebellum exclusion on subject fingerprint. Probability
normalized histogram (top) and box plot (bottom) for Euclidean distances between same subject (SS) and different subject (DS) instances for all 851 subjects. Note that the fingerprint without cerebellum is obtained by removing the bundles corresponding to
cerebellum from the full subject fingerprint. . . 97 Figure 3.11 Impact of the number of fiber trajectories used to generate a subject
(red) and different-subject (blue) instances for all 851 subjects (left). Bar plot of RMS pooled features corresponding to four different bundles of a subject, obtained with varying numbers of
fiber trajectories (right). . . 98 Figure 3.12 Comparison of QSDR+rigid alignment (blue) and DTI+affine
alignment (red) based tractographies for subject 1 and subject 2 (left). Mean recall@k for DTI+affine alignment based fiberprint
identification using 851 QSDR+rigid alignment fiberprints (right) . . . . 102 Figure 3.13 Color-coded bar plot representation of a subject’s fiberprint,
compared across the different alignment and signal reconstruction methods. Column 1 is a fiberprint based on QSDR and rigid alignment (Figure 3.5); columns 2 and 3 show fiberprint instances
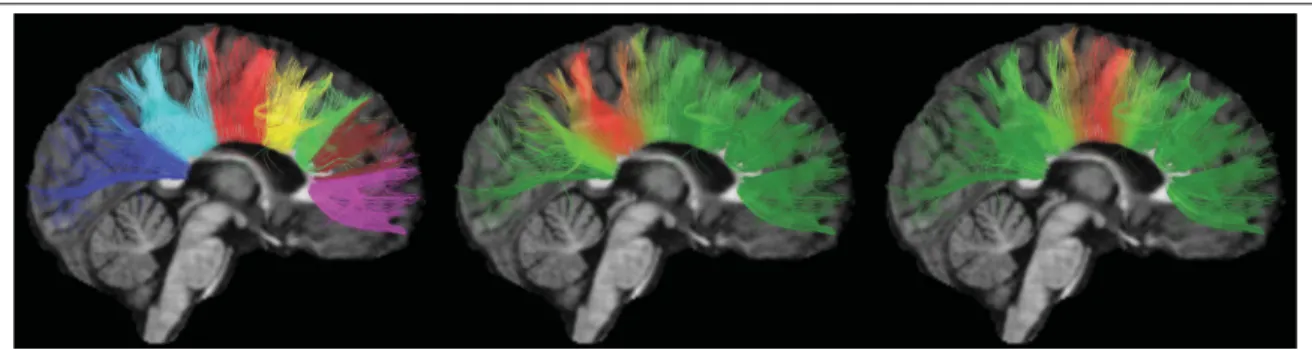
obtained with DTI and affine alignment. . . 102 Figure 3.14 Genetically-related subject identification. The mean recall@k for
MZ-twin (82-pairs), DZ-twin (82-pairs), Non-Twin siblings (166 pairs) using Fiberprint (left) and full T1w images rigidly aligned to MNI space as fingerprint (middle). The age difference impact on Non-Twin sibling identification, with 0 ≤ Δage1 ≤ 3, and 3 < Δage2 ≤ 11, 3 being the median age difference (right). In all plots, the chance factor is measured via a random list of nearest
neighbors (rnd). . . 103 Figure 3.15 Differences between fingerprints of genetically-related subjects.
Probability normalized histogram and box plot of Euclidean
distances between instances belonging to MZ, DZ, and Non-Twin siblings 105 Figure 3.16 MZ vs NT. Differences between MZ-twin and Non-Twin siblings.
Color coded bundle visualization for Holm-Bonferroni corrected p-values (in -log10scale) obtained using a Wilcoxon rank-sum test. (superior axial, anterior coronal, and left sagittal views (top row);
inferior axial, posterior coronal, and right sagittal views (bottom row);) . 108 Figure 3.17 DZ vs NT. Differences between DZ-twin and Non-Twin siblings.
Color coded bundle visualization for Holm-Bonferroni corrected p-values (in -log10scale) obtained using a Wilcoxon rank-sum test. (superior axial, anterior coronal, and left sagittal views (top row);
inferior axial, posterior coronal, and right sagittal views (bottom row);) . 109 Figure 3.18 Male vs Female. Differences related to gender. Color coded
bundle visualization for Holm-Bonferroni corrected p-values (in -log10 scale) obtained using a Wilcoxon rank-sum test. (superior axial, anterior coronal, and left sagittal views (top row); inferior
axial, posterior coronal, and right sagittal views (bottom row);) Note: for visualization purposes, fibers in non-signifcant bundles
are not shown. . . 110 Figure 3.19 Inter-hemispheric dictionary bundles with respective bundle IDs.
(Top two rows show superior axial view, bottom row shows inferior
axial view) . . . 116 Figure 3.20 Left hemisphere dictionary bundles with respective bundle IDs.
(Left sagittal view) . . . 117 Figure 3.21 Left hemisphere dictionary bundles with respective bundle IDs.
(Right sagittal view) . . . 118 Figure 3.22 Cerebellum dictionary bundles with respective bundle IDs. (Left
sagittal view in top row; right sagittal and posterior coronal view
in bottom row) . . . 119 Figure 3.23 Fingerprint comparison across two instances of a subject. Color
coded bar representation of subject fingerprint (subject 1, Instance 1 and 2); with Columns representing: RMS, Mean, and Max
pooling functions respectively . . . 120 Figure 3.24 Impact of age on MZ/DZ-twin identification; and the level of
sparsity Smax on subject fingerprint for m = 100. (Left) The
mean recall@k for MZ-Twin identification (82 pairs); where, 22 ≤ age1 ≤ 29, and 30 ≤ age2 ≤ 35, 30 is the median age for MZ-twin pairs. (Middle) The mean recall@k for DZ-Twin identification (82 pairs); where, 22 ≤ age1 ≤ 29, and 30 ≤ age2 ≤ 35, 29 is the median age for DZ-Twin pairs. (Right) Impact of the level of sparsity Smax on subject fingerprint
for m = 100. Note: mean recall@k for random lists of
nearest-neighbors is identified by rnd. . . 120 Figure 3.25 Euclidean distance based differences between fingerprints of
genetically-related subjects w.r.t. same-subject (SS) and different-subject (DS) instances. Probability normalized histogram and box plots of Euclidean distances for MZ twins (164 subjects), DZ twins (164 subjects), and Non-Twin siblings (215 subjects) using RMS
pooling function . . . 122 Figure 3.26 MZ vs NT. Differences between MZ-twin and Non-Twin siblings.
Color coded bundle visualization for Holm-Bonferroni corrected p-values (in -log10scale) obtained using an unpaired t-test. (superior axial, anterior coronal, and left sagittal views (top row); inferior
Figure 3.27 DZ vs NT. Differences between DZ-twin and Non-Twin siblings. Color coded bundle visualization for Holm-Bonferroni corrected p-values (in -log10scale) obtained using an unpaired t-test. (superior axial, anterior coronal, and left sagittal views (top row); inferior
axial, posterior coronal, and right sagittal views (bottom row);) . . . 123 Figure 3.28 Male vs Female. Differences related to gender. Color coded
bundle visualization for Holm-Bonferroni corrected p-values (in -log10 scale) obtained using an unpaired t-test. (superior axial, anterior coronal, and left sagittal views (top row); inferior axial, posterior coronal, and right sagittal views (bottom row); Note: for
visualization purposes, fibers in non-significant bundles are not shown. . 123 Figure 4.1 Pipeline of the proposed framework and analysis. For a given input
image, a BoF representation is first obtained by extracting local features. This representation is then converted to a fingerprint by matching features across the entire set of images, and embedding the resulting proximity graph into the manifold. The manifold approximation block shows the 2D embedding coordinates (i.e., fingerprint) of HCP subjects (red dots) obtained with T1w (top), FA (bottom) and combined T1w+FA (middle) images. The fingerprints of a specific subject (blue dot), his/her monozygotic twin (MZ, cyan dot) and full sibling (FS, green dot) are highlighted in each plot. The pairwise feature matches of these two sibling pairs, for T1w and FA images, are shown in the corner images of
the block. . . 131 Figure 4.2 Compact fingerprint analysis. Top row: representative 2D spectral
embedding visualization, blue and cyan dots show one pair of MZ twins and green dot shows their not twin (full) sibling; Bottom row: plots of eigenvalues (excluding the first), absolute dprime, and -log10 (p-value) (unpaired t-test) for Euclidean distances between
MZ pair vs DZ pair fingerprints with increasing number of eigenvectors. 143 Figure 4.3 Compact fingerprint comparison for genetically-related subjects.
Count-density histograms (top row) and probability-normalized curves (bottom row; gamma histogram fitting) of Euclidean
distances between twin/sibling pair fingerprints using 150 eigenvectors. . 144 Figure 4.4 Example of feature correspondences for a subject and his/her MZ
twin (rows 1-2), and the subject’s full sibling (FS) (rows 3-4).
Scale space is represented using circle radius (for the visible slice). . . . 156 Figure 4.5 Box plot comparison between MZ, DZ, and FS for pairwise feature
structures. Red, green and blue correspond to MZ, DZ, and FS
respectively. . . 158 Figure 4.6 Twin/Sibling identification. Mean recall@k plots for MZ,DZ
and full-siblings (FS). Plots for comparisons across modalities (top row); sMRI comparisons (second row); dMRI DTI comparisons (third row); dMRI GQI comparisons (fourth row); and reproducibility (last row). Mean recall@50 for random ranking of subjects are: MZ-0.063 ; DZ-0.056 ; FA-0.055. Note: y-axis represents mean recall@k, and it’s range is varied for plots
for better visualization. (All MRI= T1w+T2w+FA+rfMRI) . . . 176 Figure 4.7 Example of feature correspondences for a subject and his/her DZ
twin (top row), and the subject’s non-twin sibling (FS) (bottom row). Scale space is represented using circle radius (for the visible
slice). . . 179 Figure A.III.1 Copyright permissions for Figure 1.4 . . . 194 Figure A.III.2 Copyright permissions for Figure 1.5 (right column) . . . 195 Figure A.III.3 Copyright permissions for Figure 1.6 (bottom row) . . . 196 Figure A.III.4 Copyright permissions for Figure 1.7 (top row) . . . 197 Figure A.III.5 Copyright permissions for Figure 1.9 . . . 198
Algorithm 2.2 Non-negative kernelized orthogonal matching pursuit . . . 60 Algorithm 2.3 ADMM method for group sparse kernelized clustering . . . 61 Algorithm 2.4 Bartels-Stewart Algorithm summary . . . 62 Algorithm 2.5 ADMM method for kernelized dictionary learning with Laplacian prior 63
ADMM Alternating direction method of multipliers ADNI Alzheimer’s disease neuroimaging initiative ARI Adjusted rand index
CC Corpus callosum
CST Corticospinal tract
dMRI Diffusion MRI
DTI Diffusion tensor imaging
DZ Di zygotic
EP End points
FA Fractional anisotropy
fMRI Functional magnetic resonance imaging
FS Full siblings
GFA Generalized fractional anisotropy
GQI Generalized q-sampling imaging
HARDI High angular resolution diffusion-weighted imaging HCP Human connectome project
IFO Inferior fronto-occiptal fasciculus MCP Mean closest points
MD Mean diffusivity
MDF Minimum average direct-flip
MR Magnetic resonance
MRI Magnetic resonance imaging
MZ Mono zygotic
NARI Normalized adjusted rand index
NT Not twin
PPMI Parkinson’s progression markers initiative
RD Radial diffusivity
rfMRI Resting state functional magnetic resonance imaging QA Quantitative anisotropy
QB Quickbundles
QBI Q-ball imaging
QSDR Q-space diffeomorphic reconstruction
RI Rand index
stating the problem in a way that will allow a solution”
Bertrand Russell
The human brain is one of the most remarkable and complex structures known to man. Un-derstanding the functional and structural properties of this organ is an outstanding research challenge that can have a significant impact on the advancement of science and the well-being of the population. Among many other benefits, a better understanding of the brain would be a major step toward the effective treatment of neuro-degenerative diseases like Alzheimer’s. According to the World Alzheimer Report 2016, such diseases present a global healthcare cri-sis, with an estimated 47 million people suffering dementia worldwide and costing over $800 billion per year.
Researchers have established that brain structure (Mangin et al., 2004), function (Barch et al., 2013;Gordon et al.,2017a;Mueller et al.,2013) and white matter architecture (Bürgel et al., 2006; de Schotten et al., 2011) show variability across individuals (Gordon et al., 2017b). While most brain studies focus on group level inferences, recent advances in imaging hardware, as well as initiatives in precision medicine, have spawned considerable interest in the analysis of individual brains differences, a topic known as brain fingerprinting. Such analyses can help assess and optimize personalized treatment strategies, thereby reducing healthcare costs.
0.1 Problem statement and motivation
Fingerprinting studies are motivated by the fact that brain characteristics are largely determined by genetic factors that are often unique to individuals (Thompson et al.,2013). Various neuro-logical disorders like Parkinson’s (Geevarghese et al.,2015) and Autism (Goldman et al.,2013) have also been linked to specific brain abnormalities that are difficult to describe at the
popu-lation level. With the rapid improvements in MRI acquisition hardware and analysis tools, and thanks to large brain-related initiatives like the Human Connectome Project (HCP) (Van Essen et al., 2013) and UK Biobank (Sudlow et al.,2015), researchers are better poised to study in-dividual subjects in addition to groups (Dubois and Adolphs,2016;Gordon et al.,2017c), thus taking a step towards precision medicine (Hampel et al.,2017) and precision psychiatry (Finn and Constable,2016).
The importance of characterizing individual differences in brain MRI is evident from the re-cent surge in studies on this topic. For example, Yeh et al. (Yeh et al., 2016a) built a lo-cal connectome fingerprint using dMRI data and applied this fingerprint to the analysis of genetically-related subjects. Finn et al. (Finn et al., 2015) considered the correlation between time courses of atlas-defined nodes to generate a functional connectivity profile and used this profile to identify individuals across scan sessions, both for task and rest conditions. Liu et al. (Liu et al., 2018) use dynamic brain connectivity patterns for identifying individuals and predicting higher cognitive functions. Moreover, Miranda et al. (Miranda-Dominguez et al., 2014) proposed a linear model to describe the activity of brain regions in resting-state fMRI as a weighted sum of its functional neighboring regions. Their functional fingerprint, derived from the model’s coefficients, has the ability to predict individuals using a limited number of non-sequential frames. Various morphometry-based fingerprints have also been proposed for structural MRI modalities like T1- or T2-weighted images. For example, Wachinger et al. (Wachinger et al.,2015a) quantify the shape of cortical and subcortical structures via the spec-trum of the Laplace-Beltrami operator. The resulting representation, called Brainprint, is used for subject identification and analyzing potential genetic influences on brain morphology.
So far, studies on characterizing individual differences have focused on single modalities, with functional connectivity based approaches gaining considerable research interest (Finn and Con-stable, 2016;Poldrack et al., 2015;Gordon et al., 2017c). While applications to understand-ing individual differences in behavior, personality, and clinical utility have been investigated (Dubois and Adolphs,2016), various aspects of this research area remain uncharted. First, the
potential of fingerprints based on structural connectivity has not been fully explored. This is in part due to the challenges arising from fiber tracking data, including lack of gold standard, bundle variability, differences in fiber length, and variability in fiber tracking output. Since white matter organization is an important factor underlying neurological function and disease, there is thus a critical need for novel tools characterizing the individual differences in structural connectivity.
Second, due to the complexity of combining multiple modalities in a single framework, defin-ing a multi-modal brain fingerprint remains to this day an elusive task. Recent morphometry-based approaches, such as Brainprint (Wachinger et al.,2015a), could potentially be extended to other modalities like diffusion MRI. However, this requires solving non-trivial problems such as the cross-modality alignment of images with different resolutions, the segmentation and correspondence of neuroanatomical structures, etc. Computational efficiency is another important issue when dealing with large-scale, multi-subject and multi-modal datasets like HCP. Nonetheless, since each modality captures unique properties of the brain, combining multiple modalities could provide a richer, more discriminative information.
0.2 Research objectives and contributions
Following the challenges and limitations highlighted above, the objective of this research is to develop data-driven methods for characterizing individual differences in brain MRI. To-ward this goal, we propose a framework based on kernel sparse dictionary learning for the unsupervised clustering and segmentation of tractography streamlines. This framework en-ables to compare streamlines of different length and capture the complexity and variability of streamline bundles. We then use this framework to define a brain fingerprint, called Fiberprint, which characterizes white matter fiber geometry in individual subjects. Finally, we present a powerful approach using a bag-of-features image representation and manifold embedding to derive multi-modal brain fingerprints. The main contributions of this thesis can be further detailed as follows:
1) Kernel sparse dictionary learning for white matter fiber segmentation: Existing streamline clustering approaches assume crisp streamline-to-bundle membership. Due to lack of gold standard, variations in fiber tracking output, and different streamline lengths, this can be challenging in scenarios where streamlines are not clearly separated, bundles overlap, or when there is important inter-individual variability. Moreover, in various pattern recognition and neuroimaging applications, sparsity priors have shown robustness to variations due to noise or other factors. Based on this idea, the first contri-bution proposes novel frameworks based on kernel dictionary learning and sparsity priors for white matter fiber segmentation. The general idea of these approaches is to learn a compact dictionary of training streamlines capable of describing the whole dataset and to encode bundles as a sparse combination of multiple dictionary prototypes. Kernel dictionary learning allows capturing the non-linear relationship between streamlines and bundles, without the requirement for explicit embedding. The proposed methods allow streamlines to be assigned to more than one bundle, making it more suitable for above-mentioned scenarios. By exploiting group sparsity and manifold regularization, these methods provide robustness to the input number of clusters and allows incorporating anatomical constraints in the clustering.
The findings related to this contribution are presented in the following papers:
• Kumar Kuldeep, Siddiqi Kaleem, Desrosiers Christian. “White matter fiber
anal-ysis using kernel dictionary learning and sparsity priors”. Pattern Recognition, Elsevier. Submitted.
• Kumar Kuldeep, Gori Pietro, Charlier Benjamin, Durrleman Stanley, Colliot Olivier,
Desrosiers Christian. “White matter fiber segmentation using functional varifolds”. International Workshop on Mathematical Foundations of Computational Anatomy,
MICCAI 2017. Graphs in Biomedical Image Analysis, Computational Anatomy
• Kumar Kuldeep, Desrosiers Christian. “A sparse coding approach for the efficient
representation and segmentation of white matter fibers”. IEEE 13th International
Symposium on Biomedical Imaging (ISBI), 2016. (pp. 915-919).
• Kumar Kuldeep, Desrosiers Christian, Siddiqi Kaleem. “Brain Fiber
Cluster-ing UsCluster-ing Non-negative Kernelized MatchCluster-ing Pursuit”. International Workshop on
Machine Learning in Medical Imaging, MICCAI 2015. (pp. 144-152). Springer,
Cham.
• Kumar Kuldeep, Desrosiers Christian. “Group Sparse Kernelized Dictionary
Learn-ing for the ClusterLearn-ing of White Matter Fibers”. Workshop on Sparsity Techniques
in Medical Imaging, MICCAI 2014.
2) Brain fingerprint modeling white matter fiber geometry: Most fingerprint studies in the literature analyze individual brain differences from functional or structural MRI. While recent works have also investigated diffusion MRI for this task, they have done so at the level of single voxels, not brain fibers. Considering fibers instead of voxels provides additional information on white matter organization and structural connectiv-ity. The second contribution of this thesis is a brain fingerprint called Fiberprint, which is the first to characterize white matter fiber geometry. To achieve this goal, we exploit the concept of feature pooling that plays a key role in numerous pattern recognition tech-niques like deep learning. Leveraging the sparse dictionary learning framework proposed in the first contribution, we map streamlines of subjects to a common space representing prominent bundles and generate compact fingerprints by applying a pooling function for each bundle. Obtained fingerprints encode unique properties of streamlines along dic-tionary bundles, such as their density. A large-scale analysis using data from 861 HCP subjects is conducted to measure the impact on the fingerprint of various parameters, including pooling function, dictionary size, sparsity and fiber tracking method/parame-ters. Furthermore, zygosity and siblingship information from the HCP dataset is used
to analyze the relationship between genetic proximity and fingerprint similarity across different bundles.
The second contribution resulted in the following paper and poster:
• Kumar Kuldeep, Desrosiers Christian, Siddiqi Kaleem, Colliot Olivier, Toews
Matthew. “Fiberprint: A subject fingerprint based on sparse code pooling for white matter fiber analysis”. NeuroImage. 158: 242-259. 2017.
• Kumar Kuldeep, Desrosiers Christian, Siddiqi Kaleem, Colliot Olivier, Toews
Matthew. “Fiberprint: Identifying subjects and twins using fiber geometry based brain fingerprint”. Medical Imaging meets NIPS, NIPS 2017 (poster).
3) Multi-modal brain fingerprint using bag-of-features and manifold approximation: Current fingerprints encode brain characteristics from a single MRI modality. However, different modalities capture unique properties of the brain, and combining them can pro-vide a richer information on individual differences. The third contribution of this thesis proposes a first data-driven framework, based on a bag-of-features representation and manifold approximation, to generate brain fingerprints from multi-modal data. In this framework, images are represented as a bag of local features, and manifold approxima-tion is employed to map subjects in a common low-dimensional subspace. Experiments using the T1/T2-weighted MRI, diffusion MRI, and resting state fMRI data of 945 HCP subjects demonstrate the benefit of combining multiple modalities, and highlight the link between fingerprint similarity and genetic proximity.
The findings led to the following contributions:
• Kumar Kuldeep, Toews Matthew, Chauvin Laurent, Colliot Olivier, Desrosiers
Christian. “Multi-modal brain fingerprinting: a manifold approximation based framework”. NeuroImage, Elsevier. Under review
• Kumar Kuldeep, Chauvin Laurent, Toews Matthew, Colliot Olivier, Desrosiers
de-scriptors in brain MRI”. Workshop on Computational Diffusion MRI, MICCAI
2017. Book Series: Mathematics and Visualization. (pp. 219-228). Springer. • Kumar Kuldeep, Chauvin Laurent, Toews Matthew, Colliot Olivier, Desrosiers
Christian. “Multi-modal brain fingerprinting: a bag of features and manifold ap-proximation based twin analysis”. Montreal Artificial Intelligence & Neuroscience (MAIN 2017, poster).
• Kumar Kuldeep, Chauvin Laurent, Toews Matthew, Colliot Olivier, Desrosiers
Christian. “Analysis of genetically related subjects using multi-modal brain finger-prints”. 1st Symposium on Applications of Artificial Intelligence in Medicine (IAM
2018). (Best poster award)
The full list of publications that resulted from this research can be found in Appendix I.
0.3 Thesis outline
The work presented in this thesis is organized as follows (Figure 0.1). In Chapter 1, we present basic concepts of magnetic resonance imaging and give a review of relevant works on the genetic basis of brain structure and function, individual-based approaches for neurological disorders, characterizing individual differences using brain MRI, and other concepts relevant to the thesis: streamline clustering, sparse coding in neuroimaging, and multi-modal studies in neuroimaging. Chapter 2 then introduces the proposed streamline segmentation approaches, based on kernel dictionary learning and sparsity priors. The work presented in this chapter cor-responds to the paper “White matter fiber analysis using kernel dictionary learning and sparsity priors”, which was submitted to the Pattern Recognition journal. Following this, Chapter 3 presents our Fiberprint framework that combines kernel dictionary learning and sparse code pooling to generate compact characterizations of white matter fiber geometry in individual sub-jects. This chapter corresponds to the paper entitled “Fiberprint: a subject fingerprint based on sparse code pooling for white matter fiber analysis”, published in the NeuroImage journal. In
BoF Match T1w: FS BoF Match T1w: MZ Manifold approximation Spectral Embedding E
Chapter 4: Multi-modal brain fingerprinting Pooling
P
Sparse codes
Chapter 3: Fiberprint
Chapter 2: Kernel dictionary learning and sparsity priors
Figure 0.1 Sketch of the chapters of the thesis.
Chapter 4, we introduce our multi-modal brain fingerprinting framework, analyzing the con-tribution of various MRI modalities and their combinations in characterization of individual differences. The content of this Chapter corresponds to the paper “Multi-modal brain finger-printing: a manifold approximation based framework”, submitted to the NeuroImage journal. Chapter 5 summarizes the main contributions of this dissertation and discusses its limitations as well as possible extensions. Finally, Appendix I provides a complete list of papers resulting from this Ph.D. study, and Appendix II provides link to codes.
“If I have seen further it is by standing on the shoulders of giants”
Isaac Newton
1.1 Basics of the human brain
The human brain is one of the most complex structures known to man. It exerts centralized control over other organs of the body and is responsible for cognition, perception, emotion, thought, memory, and behavior. It makes us who we are (Seung,2012).
Figure 1.1 Diagram of a neuron (Source:https://en.wikipedia.org/wiki/Neuron)
The fundamental unit of the brain is the neuron (Fig. 1.1), a specialized cell that transmits nerve impulses and is vital to brain function. It is estimated that a typical healthy human brain contains around 100 billion neurons (Herculano-Houzel,2009), linked to one another via trillions of tiny contacts called synapse. This intricate wiring of the brain is responsible for receiving and processing signals encoding the various functions of the brain.
Figure 1.2 Left: Coronal slice of a healthy human brain with tissue types (Source:
http://elearningbiology.weebly.com); Right: Functional areas of human brain (Source:
https://en.wikipedia.org/wiki/Human_brain)
Anatomically, the human brain is made of three main tissue classes: gray matter, white matter, and cerebrospinal fluid (CSF, filling ventricles). Figure 1.2 (left) shows a typical coronal slice of human brain, highlighting tissue classes. Gray matter contains the cell bodies, dendrites, and axon terminals, and has a pinkish gray color in the living brain (hence the name). White matter is made of axons, which connect different parts of the brain to each other. Lastly, the CSF occupies the ventricular system around and inside the brain, acting as a cushion for the cortex.
The cerebral cortex of the brain can also be divided into different functional areas (Fig. 1.2, right). The frontal areas play an important role in reasoning, planning, language, memory, and motor control. The occipital lobe, rearmost part of the cortex, processes visual stimuli. Similarly, major functional areas and their functions can be inferred from the figure. A detailed description of functional areas can be found in (Damasio,1995;Gray,1878;Standring,2015).
1.2 Imaging the brain: basics of MRI
As shown in Figure 1.3, the brain can be analyzed at different spatial and temporal scales (Frackowiak and Markram,2015). Magnetic resonance imaging (MRI) provides a non-invasive approach to study the structure and function of the human brain at a macroscale, with a typical