1 INTRODUCTION
Extracting system dynamic features from a set of measurements can be realized using Blind Source Separation (BSS) techniques such as Principal Com-ponent Analysis (PCA), Independent ComCom-ponent Analysis (ICA) and Second-Order Blind Identifica-tion (SOBI) etc. (De Boe & Golinval 2003, Nguyen 2011). The main advantage of this type of methods is that they are very simple to use in practice.
With very little increment of computational effort, the extraction of even more sensitive dynamic fea-tures may be performed by exploiting the definition of Hankel matrices. An alternative PCA-based me-thod named Null Subspace Analysis (NSA) was pro-posed and applied in (Yan & Golinval 2006) on the example of an airplane mock-up. This idea was ex-ploited later in (Nguyen 2010) to enhance the use of other BSS techniques. These enhanced techniques were applied successfully to fault diagnosis in indus-trial systems (Rutten et al. 2009, Nguyen & Golinval 2011).
The aim of this paper is to present an example of application of a PCA-based damage detection tech-nique to a civil engineering structure, namely the Champangshiehl Bridge which is a two span con-crete box girder bridge located in Luxembourg.
2 DESCRIPTION OF THE CHAMPANGSHIEHL BRIDGE
The Champangshiehl Bridge shown in Figure 1 is a two span concrete box girder bridge built in 1966 and located in the centre of Luxembourg. The bridge has a total length of 102 m divided into two spans of 37 m (East side) and 65 m (West side) respectively (Fig. 2). It is pre-stressed by 112 steel wires as illus-trated in Figure 3. The bridge is supported by two abutments and one pylon made of reinforced con-crete. The West abutment consists of an expansion bearing built by a steel roll while the East abutment is fixed. The support at the pylon is made of an elas-tomer material.
Before its complete destruction, the bridge was monitored and a series of damages were artificially introduced as summarized in Table 1. The four dam-age cases considered are illustrated in Figure 4a-d. More details on the test campaign can be found in report (Scherbaum & Mahowald 2011).
Damage Detection on the Champangshiehl Bridge using Blind Source
Separation
V.H. Nguyen, C. Rutten & J.-C. Golinval
University of Liege, Belgium
J. Mahowald, S. Maas & D. Waldmann
University of Luxembourg, Luxembourg
ABSTRACT: This paper addresses the problem of damage detection in civil engineering structures using characteristic subspaces obtained from principal component analysis (PCA) of output-only measurements. Damage detection is performed by comparing subspace features between a reference (healthy) state and a cur-rent (possibly damaged) state. The damage indicator used in this study is the angular coherence between sub-spaces.
The considered damage detection procedure is illustrated on the Champangshiehl Bridge which is a two span concrete box girder bridge located in Luxembourg. Before its destruction, multiple damage levels were inten-tionally created by cutting a growing number of prestressed tendons. Vibration data were acquired by the Uni-versity of Luxembourg for each damaged state at many locations on the bridge. As previous studies demon-strated the large importance of environmental factors on modal identification, special care was taken to evaluate this influence during the test campaign.
Figure 1. Side view of the bridge (Scherbaum & Mahowald 2011).
12.5
Cutting line in the bottom plate for damage state #1
(x = 29.25m =0.45L)
Cutting line on the top for damage state #2
and #4 (x = 63.5m) 37 29.25 34.25 1.5 65 North South West East 37 Beam blanks (245t)
Figure 2. Longitudinal section of the bridge (Scherbaum & Mahowald 2011).
Table 1. Description of the damage scenarios accord-ing to the cuttaccord-ing sections shown in Figure 2.
Damage state
Damage Percentage cutting (100%
equals all tendons in the defined section cut)
# 0 Undamaged state 0.45L Over the pylon
# 1 Cutting straight lined tendons in the lower part of the bridge at 0.45L (20 tendons)
33.7% 0%
# 2 Cutting 8 straight lined tendons in the upper part of the bridge over the pylon
33.7% 12.6%
# 3 Cutting external ten-dons (56wires)
46.1% 24.2%
# 4 Cutting 16 straight lined tendons in the upper part of the bridge and also 8 pa-rabolic tendons 46.1% 62.12% 2,62 3.0 0,60 5,30 0,60 3.0 0,20 0,28 2,14 16 parabolic tendons 16 parabolic tendons 10 lower tendons 10 lower tendons
12 upper tendons 12 upper tendons
6.5
Sketch of 28
external tendons tendons formed represents 7 as a cluster
Figure 3. Cross section of the box girder with location of the tendons (Scherbaum & Mahowald 2011).
Cutting line x=29.25m
Figure 4a. Damage case # 1.
Cutting line x=63.5m
Figure 4b. Damage case # 2.
Cutting line x=63.5m
Figure 4c. Damage case # 3.
Cutting line x=63.5m
Figure 4d. Damage case # 4.
The measurement setup considered in the present work is given in Figure 5. Twenty sensors were lo-cated on both sides A and B of the deck (the distance between each sensor is about 10 m).
0 10 20 30 40 50 60 70 -0.2 -0.1 0 0.1 0.2 0.3 Time (s) A c c e le ra ti o n B 1 0
Figure 6. Example of response signal due to impact excitation (healthy state).
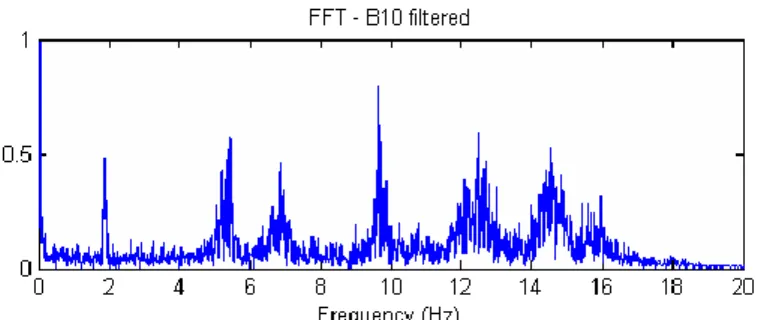
Figure 7. Frequency spectrum at coordinate B10 (healthy state).
Vibration monitoring was performed on the healthy structure and at each damage states for dif-ferent loading conditions and difdif-ferent types of forced excitation (Scherbaum & Mahowald 2011). However, only measurements obtained using impact excitation in the unloaded configuration of the bridge were exploited in the present study. As an ex-ample, Figure 6 shows the time response signal re-corded at coordinate B10 for a series of nine impacts realised on the deck, between coordinates B5 and B6. Figure 7 gives the corresponding frequency spectrum.
3 IDENTIFICATION OF NATURAL
FREQUENCIES USING THE STOCHASTIC SUBSPACE IDENTIFICATION (SSI) METHOD In many works related to health monitoring of civil engineering structures, a key issue is the extraction of representative features (e.g. modal parameters). A well established modal identification method pro-posed by Peeters & De Roeck (2001) relies on the use of stochastic subspace identification (SSI). The advantage of SSI is that it can be applied using out-put-only measurements. In the present work, SSI was applied on the free responses recorded after each im-pact excitation.
In Table 2, the two first natural frequencies ob-tained for the four damage cases (D1-D4) are com-pared to the natural frequencies of the healthy struc-ture.
Table 2. Change in the natural frequencies.
f1 f2 Value (Hz) f1 (%) Value (Hz) f2 (%) Healthy 1.92 5.54 D1 1.87 -2.6 5.45 -1.62 D2 1.95 1.6 5.24 -5.42 D3 1.82 -5.21 5.39 -2.71 D4 1.75 -8.85 5.3 -4.33
Table 2 shows that the decrease of the natural fre-quencies is proportional to the damage level for damage cases D1, D3 and D4. Only damage case D2 exhibits a different behaviour as the first natural fre-quency increases by an amount of 1.6 % with respect to the healthy structure. However, the second natural frequency is affected by the larger decrease (5.42 %) of all the damage states.
4 DYNAMIC FEATURE EXTRACTION USING PRINCIPAL COMPONENT ANALYSIS (PCA) Let us consider a dynamical system characterized by a set of vibration measurements collected in the ob-servation matrix X:
1 2... k ... N
X x x x x , m k x (1) where xk is the output vector at time step k, m is the number of output sensors and N is the number of time samples. As defined in (De Boe 2003), Princi-pal component analysis (PCA) provides a linear mapping of the data from the original dimension m to a lower dimension p. The dimension p corre-sponding to the number of principal components de-fines the order of the system. In practice, PCA is of-ten performed by singular value decomposition (SVD) of matrix X, i.e.T
X UΣV (2)
where U and V are orthonormal matrices, the col-umns of U defining the principal components (PCs). The order p of the system is determined by selecting the first p non-zero singular values in Σ which have a significant magnitude (“energy”) as described in (De Boe 2003). A threshold in terms of cumulated energies is often fixed to select the effective number of PCs that is necessary for a good representation of matrix X. In practice, a cumulated energy of 70% to 95% is generally adequate for the selection of the ac-tive PCs (De Boe 2003).
The null subspace (NSA) and enhanced-PCA method (EPCA) proposed in (Yan & Golinval 2006, Nguyen 2010) respectively are variant methods of the PCA method obtained by exploiting Hankel ma-trices of the dynamical system (Overschee & De Moor 1997). The data-driven block Hankel matrix is defined in Equation 3, where 2i is a user-defined
number of row blocks, each block contains m rows (number of measurement sensors), j is the number of columns (practically j = N-2i+1). The Hankel matrix
1,2i
H consists of 2im rows and is split into two equal parts of i block rows which represent past and future data respectively. Compared to the observation ma-trix X, the Hankel mama-trix is built using time-lagged vibration signals and not instantaneous representa-tions of responses. This enables to take into account time correlations between measurements when cur-rent data depend on past data. Therefore, the objec-tive pursued here in using block Hankel matrices rather than observation matrices is to improve the sensitivity of the detection method.
1 2 2 3 1 1 1 1,2 1 2 2 3 1 2 2 1 2 1 ... ... ... ... ... ... ... ... ... ... ... " " ... ... " " ... ... ... ... ... ... ... ... ... j j i i i j p i i i i j f i i i j i i i j past future H H H x x x x x x x x x x x x x x x x x x (3)
where the subscripts of H1,2i denote the subscript of the first and last element of the first column in the block Hankel matrix.
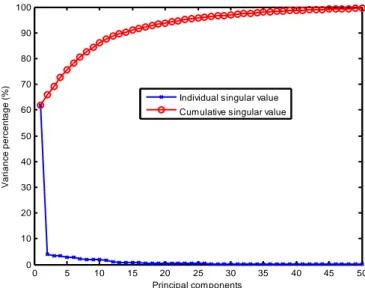
0 5 10 15 20 25 30 35 40 45 50 0 10 20 30 40 50 60 70 80 90 100 Principal components Va ri a n ce p e rce n ta g e (% )
Individual singular value Cumulative singular value
Figure 8. Energy diagram for the healthy structure.
Figure 8 gives the singular value (or energy) dia-gram constructed with a number of 50 blocks in the Hankel matrix of the healthy structure. It can be ob-served that the first principal component concen-trates the largest part (more than 60%) of the total energy of the system compared to the other principal components which correspond to much lower singu-lar values. A slight decrease of the energy can also
be observed between the 4th and the 5th singular value.
5 DAMAGE DETECTION BASED ON THE CONCEPT OF SUBSPACE ANGLE
The principal components contained in matrix U span a subspace which characterizes the dynamic state of the system. Without any damage or variation of environmental conditions, the characteristic sub-space Uremains unchanged. Any change in the dy-namic behaviour caused by a modification of the system state modifies consequently its characteristic subspace. This change may be estimated using the definition of subspace angles (Golub & Van Loan 1996).
As illustrated by a two-dimensional case in Figure 9, the concept of subspace angle can be seen as a tool to quantify existing spatial coherence between two data sets resulting from observations of a vibration system. It was used in (De Boe & Golinval 2003, Yan & Golinval 2006, Nguyen 2010) to detect changes in the dynamic behaviour of a structure (e.g. damage, onset of nonlinearity).
Figure 9. Illustration of the concept of subspace angle in a 2D-case. The reference and the current subspaces are defined by the active components Φ1, Φ2 of the corresponding Hankel matrices.
The application of the concept of subspace angle on the Champangshiehl Bridge data allows to detect all the damage cases (D1-D4) using the single first principal component (PC) of the Hankel matrix. The detection remains good and even more evident when 2, 3 and 4 PCs are used.
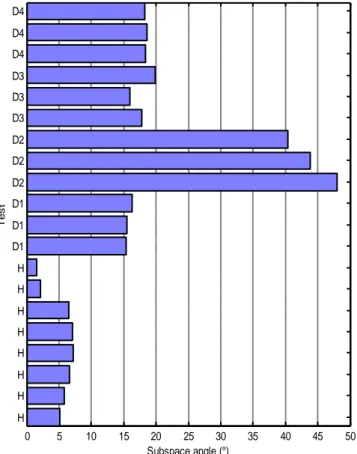
On the other hand, the use of more PCs (higher than 4) deteriorates the quality of the distinction be-tween the damaged and the healthy states. Indeed, the highest PCs (associated to small singular values i.e. low energy) come from noise present in the data and are not dynamic features of the system. As an example, the detection results obtained on the basis of 3 PCs is shown in Figure 10. In this figure, a total of 20 tests were considered: eight tests on the
healthy structure (H) and twelve tests corresponding to the four levels of damages D1-D4. It can be ob-served that all the damage cases are well detected and that damage cases D2 present the largest damage indexes. 0 5 10 15 20 25 30 35 40 45 50 H H H H H H H H D1 D1 D1 D2 D2 D2 D3 D3 D3 D4 D4 D4 Subspace angle (°) Te s t
Figure 10. Damage detection results using EPCA.
6 CONCLUSION
The philosophy pursued throughout this paper is to exploit experimental vibration measurements to ex-tract dynamic features of a system without resorting on modal identification results (i.e. natural frequen-cies and/or mode-shapes). To this purpose, tech-niques of the Blind Source Separation (BSS) family are considered and especially here, a variant of Prin-cipal Component Analysis based on the definition of Hankel matrices is used. In this method, the order (number of active principal components) is deter-mined by looking at the cumulated variance in the singular value diagram. Thus the problem of damage detection is tackled using the subspaces spanned by the active principal components. It consists in de-termining the angular coherence between subspaces obtained in current states with respect to a reference (healthy) state. The advantage of PCA over classical modal identification methods relies on its easiness of use. First results obtained on the Champangshiehl bridge are encouraging.
In further studies, the influence of environmental conditions on the damage detection results will be considered.
7 ACKNOWLEDGEMENT
The data for this work were provided by the Univer-sity of Luxembourg which is gratefully acknowl-edged.
REFERENCES
De Boe, P., Golinval, J.-C. 2003. Principal component analysis of a piezosensor array for damage localization. Structural Health Monitoring, 137-144.
De Boe P. 2003. Les éléments piézo-laminés appliqués à la dy-namique des structures, PhD dissertation, University of Liège.
Golub G.H., Van Loan C.F. 1996. Matrix computations. Balti-more, The Johns Hopkins University Press.
Nguyen V.Ha 2010. Damage Detection and Fault Diagnosis in Mechanical Systems using Vibration Signals. PhD disserta-tion, University of Liège.
Nguyen V. H., Golinval J.-C. 2011. Damage detection using Blind Source Separation techniques. Proceedings of the In-ternational Modal Analysis Conference (IMAC) XXIX, Jacksonville, USA.
Overschee P. V., De Moor B. 1997. Subspace identification for linear systems-Theory-Implementation-Applications. Kluw-er Academic PublishKluw-ers.
Peeters B, De Roeck G. 1999. Reference-based stochastic sub-space identification for output-only modal analysis. Me-chanical Systems and Signal Processing 13(6), 855-878. Peeters B., De Roeck G. 2001. Stochastic System Identification
for Operational Modal Analysis: A Review, Journal of Dy-namic Systems, Measurement and Control, Transaction of the ASME, vol 123, 659-667.
Rutten C., Loffet C., Golinval J.-C. 2009. Damage detection of mechanical components using null subspace analysis. 2th International Symposium ETE, Brussels, Belgium.
Scherbaum F., Mahowald J. 2011. Unpublished report Bridge Champangshiehl 2. University of Luxembourg.
Yan A-M., Kerschen G., De Boe P., Golinval J-C. 2005. Struc-tural Damage Diagnosis under Changing Environmental Conditions – Part I: a linear analysis and Part II: local PCA for nonlinear cases. Mechanical Systems & Signal Processing 19: 847-864, 865-880.
Yan A.-M., Golinval J.-C. 2006. Null subspace-based damage detection of structures using vibration measurements. Me-chanical Systems and Signal Processing 20, 611-626.