1
DEALING WITH THE NON-DETECTED AND NON-QUANTIFIED DATA.
THE EXAMPLE OF THE SERUM DIOXIN DATA IN THE FRENCH DIOXIN AND
INCINERATORS STUDY
Zeghnoun A1, Pascal M1, Fréry N1, Sarter H1, Falq G1, Focant JF2, Eppe G21. French Institute for Public Health Surveillance, 12 Rue du Val d’Osne, 94 415 St Maurice, France.
2. CART Mass Spectrometry Laboratory, Chemistry Department, University of Liège, Allée de la Chimie 3, B-6c Sart-Tilman, B-4000 Liège, Belgium
Abstract
Serum analysis of dioxins, furans and PCBs were performed in 1030 adults to identify the determinants of the body-burden of these compounds in the population neighbouring waste incinerators. Despite the use of a sensitive analytical method, several concentrations were not quantified or not detected. To handle this kind of data, we used two different methods: the substitution method and the Tobit model. The results of these two methods were then compared. Results showed that when the censoring intensity is less than 30%, the method for treatment of left-censored data makes little difference. However, when the censoring intensity is larger than 30%, the resulting analysis could be sensitive to the method for handling left-censored data.
Introduction
The French Dioxin and Incinerators Study1was carried out in 8 different areas in France around municipal solid waste incinerators to study whether serum dioxin levels were higher in people living in the vicinity of incinerators compared to referent people. In addition, some factors, such as local food consumption, were also studied to check whether it could influence their serum levels. 1030 adults (30-65 years) selected through a stratified two stage random sampling, provided blood serum samples for dioxin measurements. Exposure was assessed by concentrations of dioxins, furans and PCBs in human blood serum. In spite of low limit of quantification (LOQ) and limit of detection (LOD), several concentrations were not quantified or not detected2. Several methods are available for handling environmental exposure data in the presence of censored values. The substitution method substitutes a single value for each censored value. Common choices for this substituted value are zero, LOD (or LOQ), LOD/2 (or LOQ/2), and LOD/√2 (or LOQ/√2). Summary statistics and regression parameters are then estimated using the data above the LOD together with these substituted values. The substitution method is commonly used but it has no theoretical basis3. An alternative method is to use regression model for censored data known as Tobit regression4. This method does not require substitution for values less than the LOD or LOQ and use maximum likelihood to estimate regression parameters. When the censoring intensity (the percentage of censored values) is low, the different methods may not lead to significantly different results. However, as the censoring intensity increases, the impact of the handling of censored data on the resulting analysis increases. The choice of the most appropriate method when dealing with an elevated number of censored data is then essential5. In the present work, we investigate the impact of the two different methods on the estimation of the distribution of the dioxin concentrations. We also consider the regression of the blood serum dioxin concentrations on several covariates using Tobit regression.
Materials and Methods
The limit of detection and the limit of quantification are presented elsewhere2. Two methods were selected to handle censored data. The first method substitutes a censored value by:
- zero,
- LOD if the censored value is less than LOD or LOQ if it is less than LOQ, - LOD/2 if the censored value is less than LOD or LOQ/2 if it is less than LOQ, - LOD/√2 if the censored value is less than LOD or LOQ/√2 if it is less than LOQ, EPIDEMIOLOGICAL STUDY ON MSWI OPERATION
2
Taking into consideration that laboratories usually make a distinction between LOD and LOQ, an other possibility is to substitute by LOD/2 when the censored value fall between 0 and LOD, and to substitute by (LOD+LOQ)/2 when the censored value fall between LOD and LOQ.The second method uses statistical procedure for censored data named the Tobit regression model. In this model, we make a distinction between left-censored data when values are less than the LOD and interval censored data when values are between the LOD and the LOQ. The substitution method and the Tobit regression model were used: 1) in the estimation of the distribution of the dioxin concentrations, 2) and in the estimation of the relationship between dioxin concentrations and some selected covariates.
Preliminary investigation indicates that dioxin concentrations are consistent with a log-normal distribution. We therefore study the association between the logarithm of dioxin concentrations and some selected covariates (age, sex, BMI, social and occupational category, recent change of body weight, smoking status, location of the incinerators, urbanisation, chimney use, doing an exposed dioxin activity, living in exposed or not exposed area, background/local food consumption) using a Tobit regression models already developed in the French Dioxin and Incinerators Study to explain the variability of the dioxin concentrations. Maximum likelihood estimates are obtained using LIFEREG procedure implemented in SAS6which can be used with data that have both interval-censored data along with left-interval-censored data. The GLM procedure is used when the interval-censored values were substituted.
Results
Concerning the PCDDs, the censoring intensity ranged from 0% for 1,2,3,6,7,8 HCDD to 6.5% for 2,3,7,8 TCDD. For PCDFs, it ranged from 0% for 2,3,4,7,8 PCDF and 1,2,3,6,7,8 HCDF to 99.8% for 1,2,3,4,7,8,9 HCDF. Eight of 15 PCBs had 0% censored values. Two had more than 95% of censored values (PCB77 and PCB 81). The remaining PCBs had less than 13% of censored values except PCB105 (37.5%<LOQ). Six congeners were selected for this work representing a progressive censoring intensity: 1,2,3,4,6,7,8 HpCDD (2.3%<LOQ), 2,3,7,8 TCDD (6.5%<LOQ), 2,3,4,6,7,8 HCDF (13.7%<LOQ), 1,2,3,4,6,7,8 HpCDF (29.7%<LOQ), 2,3,7,8 TCDF (62.3%<LOQ), 1,2,3,7,8,9 HCDF (81.9%<LOQ).
Distribution of blood serum dioxin concentrations
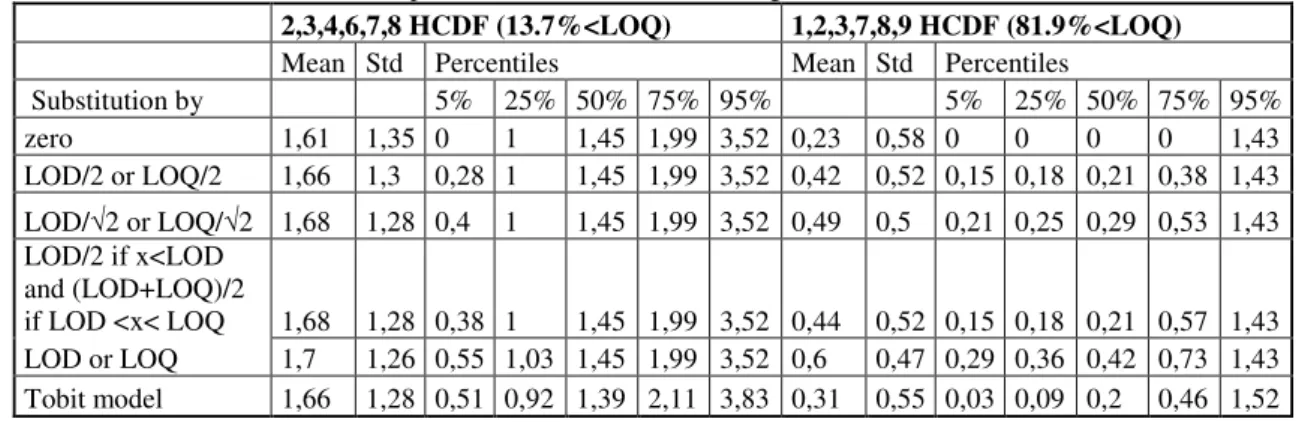
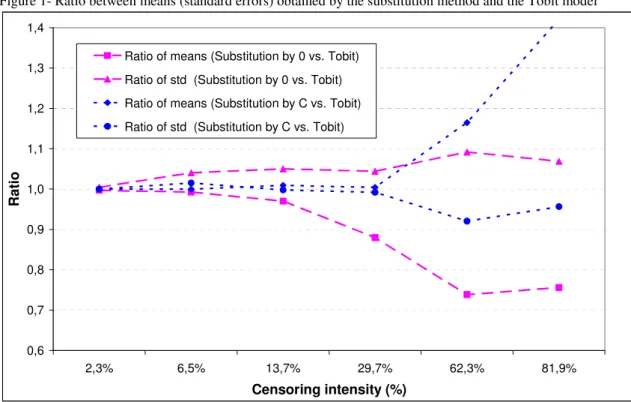
As shown in Figure 1, as the censoring intensity increases, the discrepancy between estimates of means (standard errors) obtained by substitution methods and Tobit regression model increases, particularly when the censoring intensity is greater than 30%. Table 1 shows that the distribution of dioxin concentrations is sensitive to the values used to substitute the censored values. Substitution by zero produces estimates which are low, while substitution by LOD or LOQ results in large estimates. The substitution by the other values produces intermediate estimates.
Table 1- Mean, standard error and percentiles for two selected congeners*
2,3,4,6,7,8 HCDF (13.7%<LOQ) 1,2,3,7,8,9 HCDF (81.9%<LOQ) Mean Std Percentiles Mean Std Percentiles
Substitution by 5% 25% 50% 75% 95% 5% 25% 50% 75% 95% zero 1,61 1,35 0 1 1,45 1,99 3,52 0,23 0,58 0 0 0 0 1,43 LOD/2 or LOQ/2 1,66 1,3 0,28 1 1,45 1,99 3,52 0,42 0,52 0,15 0,18 0,21 0,38 1,43 LOD/√2 or LOQ/√2 1,68 1,28 0,4 1 1,45 1,99 3,52 0,49 0,5 0,21 0,25 0,29 0,53 1,43 LOD/2 if x<LOD and (LOD+LOQ)/2 if LOD <x< LOQ 1,68 1,28 0,38 1 1,45 1,99 3,52 0,44 0,52 0,15 0,18 0,21 0,57 1,43 LOD or LOQ 1,7 1,26 0,55 1,03 1,45 1,99 3,52 0,6 0,47 0,29 0,36 0,42 0,73 1,43 Tobit model 1,66 1,28 0,51 0,92 1,39 2,11 3,83 0,31 0,55 0,03 0,09 0,2 0,46 1,52 * Congeners with the moderate and maximum censoring intensity
EPIDEMIOLOGICAL STUDY ON MSWI OPERATION
3
Regression results
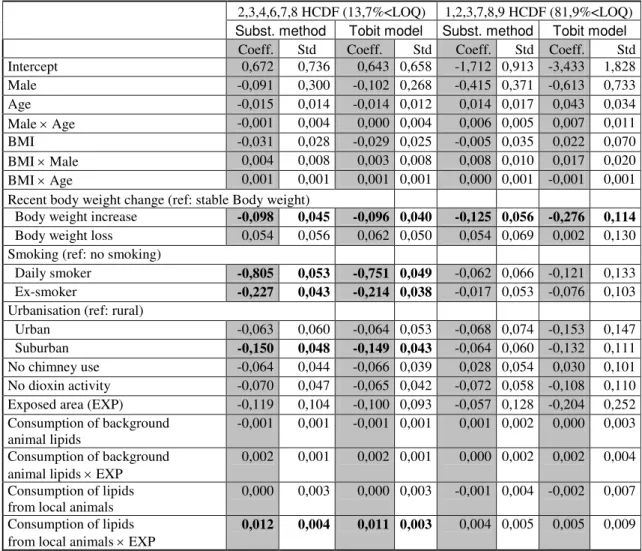
Concerning the results of the regression between the logarithm of the selected congener concentrations and the selected covariates, we found roughly similar regression coefficients when the censoring intensity was less than 30%. The disagreement between the substitution method and the Tobit model is large when the censoring intensity is larger than 30% (Table 2). Standard errors of the regression coefficients were roughly similar except with heavily censored data.
Figure 1- Ratio between means (standard errors) obtained by the substitution method and the Tobit model
0,6 0,7 0,8 0,9 1,0 1,1 1,2 1,3 1,4 2,3% 6,5% 13,7% 29,7% 62,3% 81,9% Censoring intensity (%) R a ti o
Ratio of means (Substitution by 0 vs. Tobit) Ratio of std (Substitution by 0 vs. Tobit) Ratio of means (Substitution by C vs. Tobit) Ratio of std (Substitution by C vs. Tobit)
C = LOD/2 if censored value is less than LOD and C = (LOD+LOQ)/2 if censored value fall between LOD and LOQ Conclusion
As in most studies7, when the censoring intensity is small, the method for treatment of left-censored data makes little difference. Furthermore, in this study the difference between the substitution method and the Tobit model is acceptable when the censoring intensity is less than 30%. However, when the censoring intensity is larger than 30%, the resulting analysis could be sensitive to the method for handling left and interval-censored data.
The substitution by zero clearly distorts the distribution and we recommend to not use it. Furthermore, as the choice of the values used to substitute the censored data is arbitrary, and as the distribution of dioxin concentrations is sensitive to the values used to substitute the censored data, simple substitution methods are not recommendable except when the censoring intensity is low. The Tobit model uses the censored data and the uncensored data in a regression procedure. It does not require substitution of censored values. We recommend to use it, particularly when the censoring intensity is moderately large.
EPIDEMIOLOGICAL STUDY ON MSWI OPERATION
4
Table 2- Comparison of parameter estimates* and their standard errors obtained by the substitution method**and the Tobit model for two selected congeners***2,3,4,6,7,8 HCDF (13,7%<LOQ) 1,2,3,7,8,9 HCDF (81,9%<LOQ) Subst. method Tobit model Subst. method Tobit model
Coeff. Std Coeff. Std Coeff. Std Coeff. Std
Intercept 0,672 0,736 0,643 0,658 -1,712 0,913 -3,433 1,828 Male -0,091 0,300 -0,102 0,268 -0,415 0,371 -0,613 0,733 Age -0,015 0,014 -0,014 0,012 0,014 0,017 0,043 0,034 Male × Age -0,001 0,004 0,000 0,004 0,006 0,005 0,007 0,011 BMI -0,031 0,028 -0,029 0,025 -0,005 0,035 0,022 0,070 BMI × Male 0,004 0,008 0,003 0,008 0,008 0,010 0,017 0,020 BMI × Age 0,001 0,001 0,001 0,001 0,000 0,001 -0,001 0,001
Recent body weight change (ref: stable Body weight)
Body weight increase -0,098 0,045 -0,096 0,040 -0,125 0,056 -0,276 0,114 Body weight loss 0,054 0,056 0,062 0,050 0,054 0,069 0,002 0,130 Smoking (ref: no smoking)
Daily smoker -0,805 0,053 -0,751 0,049 -0,062 0,066 -0,121 0,133
Ex-smoker -0,227 0,043 -0,214 0,038 -0,017 0,053 -0,076 0,103
Urbanisation (ref: rural)
Urban -0,063 0,060 -0,064 0,053 -0,068 0,074 -0,153 0,147
Suburban -0,150 0,048 -0,149 0,043 -0,064 0,060 -0,132 0,111
No chimney use -0,064 0,044 -0,066 0,039 0,028 0,054 0,030 0,101 No dioxin activity -0,070 0,047 -0,065 0,042 -0,072 0,058 -0,108 0,110 Exposed area (EXP) -0,119 0,104 -0,100 0,093 -0,057 0,128 -0,204 0,252 Consumption of background
animal lipids
-0,001 0,001 -0,001 0,001 0,001 0,002 0,000 0,003 Consumption of background
animal lipids × EXP
0,002 0,001 0,002 0,001 0,000 0,002 0,002 0,004 Consumption of lipids
from local animals
0,000 0,003 0,000 0,003 -0,001 0,004 -0,002 0,007 Consumption of lipids
from local animals × EXP
0,012 0,004 0,011 0,003 0,004 0,005 0,005 0,009 * Adjusted for Social and occupational category and for Location of the incinerators ** Substitution by LOD/2 if censored value is less than LOD and (LOD+LOQ)/2 if censored value fall between LOD and LOQ. *** Congeners with moderate and maximum censoring intensity. Characters in bold represent significant parameters (p<0.05).
References
1. Fréry N, Volatier JL, Zeghnoun A, Falq G, Mouajjah S, Thébault A, Pascal M, Bérat B, Grange D, De Crouy-Chanel P, Sarter H, Eppe G, Heyman C, Guillois-Becel Y, Lucas N, Mathieu A, Noury U, Pouey J, Schmitt M, Salines G. Organohalogen compounds 2007, submitted
2. Pascal M, Eppe G, Zeghnoun A, Falq G, Fréry N. Organohalogen Compounds 2007 submitted 3. Helsel DR. Environ. Sci. Thechnol. 1990; 24; 1766:1774.
4. Judge G, Griffiths WE, Hill RC, Lutkepohl H and Lee TC. New York, John Wiley 1985.
5. Helsel DR and Hirsch RM. U.S. Geological Survey, Techniques of Water-Resources Investigations
Book 4, Chapter A32002.
6. SAS institute. SAS/STAT User’s guide version 9. Cary, NC: SAS Institute Inc. 2004.
7. Baccarelli A, Pfeiffer R, Consonni D, Pesatori AC, Bonzini M, Patterson DG Jr, Bertazzi PA, LAndi MT. Chemosphere 2005 ; 898 :906.
EPIDEMIOLOGICAL STUDY ON MSWI OPERATION