HAL Id: hal-02166019
https://hal.inria.fr/hal-02166019
Submitted on 26 Jun 2019
HAL is a multi-disciplinary open access
archive for the deposit and dissemination of
sci-entific research documents, whether they are
pub-lished or not. The documents may come from
teaching and research institutions in France or
abroad, or from public or private research centers.
L’archive ouverte pluridisciplinaire HAL, est
destinée au dépôt et à la diffusion de documents
scientifiques de niveau recherche, publiés ou non,
émanant des établissements d’enseignement et de
recherche français ou étrangers, des laboratoires
publics ou privés.
Experimental Characterization of Variation in Power
Consumption for Processors of Different generations
Yewan Wang, David Nörtershäuser, Stéphane Le Masson, Jean-Marc Menaud
To cite this version:
Yewan Wang, David Nörtershäuser, Stéphane Le Masson, Jean-Marc Menaud. Experimental
Char-acterization of Variation in Power Consumption for Processors of Different generations. GreenCom
2019 : 15th IEEE International Conference on Green Computing and Communications, Jul 2019,
Atlanta, United States. pp.1-9, �10.1109/iThings/GreenCom/CPSCom/SmartData.2019.00133�.
�hal-02166019�
Experimental Characterization of Variation in Power
Consumption for Processors of Different generations
Yewan Wang Orange Labs, IMT Atlantique
Lannion, France yewan1.wang@orange.com David N¨ortersh¨auser Orange Labs Lannion, France david.nortershauser@orange.com St´ephane Le Masson Orange Labs Lannion, France stephane.lemasson@orange.com Jean-Marc Menaud IMT Atlantique Nantes, France jean-marc.menaud@imt-atlantique.fr
Abstract—Data centers are energy-hungry facilities. Building energy consumption predictive models for servers is one of the solutions to use efficiently the resources. However, physical experiments have shown that even under the same conditions, identical processors consume different amount of energy to complete the same task. While this manufacturing variability has been observed and studied before, there is lack of evi-dence supporting the hypotheses due to limited sampling data, especially from the thermal characteristics. In this article, we compare the power consumption among identical processors for two Intel processors series with the same TDP (Thermal Design Power) but from different generations. The observed power variation of the processors in newer generation is much greater than the older one. Then, we propose our hypotheses for the underlying causes and validate them under precisely controlled environmental conditions. The experimental results show that, with the increase of transistor densities, difference of thermal characteristics becomes larger among processors, which has non-negligible contribution to the variation of power consumption for modern processors. This observation reminds us of re-calibrating the precision of the current energy predictive models. The manufacturing variability has to be considered when building energy predictive models for homogeneous clusters.
Keywords-Manufacturing variability; CPU Temperature; Power Estimation; Thermal Interface Material; Leakage current;
I. INTRODUCTION
Today, data centers are estimated to consume 200 terawatt hours (TWh) each year, which is more than the need of some countries, such as Iran [1]. Building energy efficient data centers and reducing environmental impact become a great concern. Therefore, it is essential to have a preview of the energy consumption before planning the construction, for both economic and environmental benefits. Energy predictive power model is one of the approaches [2]. We are currently working on an energy predictive model for servers in using corresponding indicators, such as system usage, hardware configurations, power management technologies applied, as well as environmental information, in order to optimize the energy usage for servers in data centers and to avoid wasting energy on un-used part of the servers.
Much work has been done on building accurate models. Some of them propose high-accuracy software-level solutions [3] [4] [5]. The question is, if we build the power model for one server and validate the model precision based on the model outputs and the real measurements, can we trust the model and rely on the same precision to other servers in the homogeneous cluster or even in the whole data centers? In the experimentation of [6], a same test suite composed of several CPU intensive workloads is executed one by one to 12 identical servers in a rack, 7.8% power variation is observed among them. Thermal effect is turned out to be one of the causes: the rise of the ambient temperature increases the power consumption of servers in two ways: the consump-tion of cooling system (integrated fans) and leakage current. Further experimental study showed that, the contribution of leakage current is impressive. Taking a Gigabyte server as an example, even get rid of the integrated fan’s power, server power can have a 16% rise by only raising CPU temperature. Fabrication process discrepancy can be another cause for the power variation observed. However, authors admit that they can hardly guarantee the same ambient temperature for each server in a rack, which constrains them from studying the variation introduced by fabrication process discrepancy. But recent studies altered that, the tiny fabrication discrepancy between the printed transistors can result in visible difference in terms of both performance and power consumption among high-performance microprocessors. The variation is becoming worse in modern processors [7] [8]. John C. McCullough et al. [9] found that when applying a power model trained on Intel Core i5-1 to an identical processor 540M-2, mean prediction errors could be increased from 10% to 23%. They suggest using only power instrumentation for accurate power characterization. Among all of the components, processors are responsible for most of the power consumption and the variations [10] [11]. Recent experimental studies have identified several sources of variation among which are: frequency variation introduced by advanced performance enhancement technologies such as Turbo Boost and Multi-Threading [8] [7], within die parameter [12] and aging [10].
However, the variation brought by different thermal features of processors has not been accurately characterized according to our knowledge. Addressing this lack of study, we compare the power variation for two processors with the same TDP but issued of different generations: Intel Xeon E5345 and Intel Xeon E5-2603v2. We test 30 identical samples for each type by switching processors in a same platform in order to eliminate the influences introduced by platform design. Thermal parameters such as ambient and CPU temperature are controlled and varied with the help of a climatic cabin and an external powered fan. The paper is organized as follows: Firstly, we introduce briefly the related work in Section II. In Section III, we explained how physical measurements are performed to compare the power consumption variation among identical processors. Then, in IV we propose and evaluate two hypotheses from the perspective of thermal characteristics: switch of TIM (Thermal Interface Material) and leakage current parameters. Conclusions and perspectives are given in V. Results of our experiments can help identifying and characterizing the influence of manufacturing variability on the power variation of processors. These observations remind us of reflecting correcting the precision of existing power predictive models. The major contributions of this paper are:
• We compare the power consumption variation for two
generations of Intel processors. 30 identical processors are evaluated for each generation.
• We explore two potential causes based on thermal char-acteristics hypotheses that may contribute to the power variation of identical processors: the switch of TIM and the variation of leakage current. Each hypothesis is validated in physical experiment.
• Results of our experiments can help identifying and characterizing the influence of manufacturing variability on the power variation of processors. These observations remind us of reflecting correcting the precision of existing power predictive models.
II. RELATEDWORK
In our previous work, we studied an energy predictive model for servers in using corresponding indicators, such as system usage, hardware configurations, power management technolo-gies applied, as well as environmental information. Many studies relating to real word empirical measurement found that beside IT load applied to the components (CPU, memory, network and storage), the power of servers can be affected by external factors, such as original fabrication process [13] [11], ambient temperature [14] [15] [16]. John C. McCullough et al. [9] found that when applying a power model trained on Intel Core i5-540M-1 to an identical processor 540M-2, mean prediction errors could be increased from 10% to 23%. They suggest using power instrumentation only for accurate power characterization. Marathe et al [8] performed several tests to compare both performance and energy efficiency variation among identical nodes on Sandy Bridge, Ivy Bridge and Broadwell clusters. The variations are compared separately with and without hardware-enforced power limit. They found
that processor performance and energy efficiency variation is becoming worse with the evolution of computation capacity on modern Intel processors. Balaji et al. [17] compare the power consumption variation for modern mobile processors. Their data shows power consumption variation among processors ranging from 5% to 17% when processors operate at the lowest and highest frequency respectively. Different power management settings such as Turbo Boost and C-state can also affect the value of variation. El Mehdi Diouri et al. [10] find that different nodes from a homogeneous cluster have different power consumption at idle state. The power consumptions of two nodes stay unchanged even after exchanging the positions. They blame the causes to the age of the processors, as the server equipped with older processors shows more variation. Acun et al. [7] investigate the processors under Turbo Boost in HPC systems. They point out that dynamic overclocking feature of processor is responsible for substantial frequency difference among the processors, which explains the up to 16% of core-to-core performance variation. The faster processors usually consume more than the slower ones. J´oakim et al. [11] characterize the variation on CPU power consumption. Experiments are performed on three different platforms and different processors are picked for each platform. Identical processor samples are exchanged after each run to guarantee the identical conditions. The power consumption can differ as much as 29.6% in idle and 19.5% at full load for identi-cal samples. Their observations also show that CPU power directly influence system power, and most of the variation is caused by CPU power variations, other than by the other components [10]. The authors use worklets in SERT (Server Efficiency Rating Tool) [18] as workloads to stress the SUT (System Under Test). To our knowledge, during the phase of calibration, SERT will identify the maximum rate at which transaction can be executed for each worklet. This value is highly reproducible for one server in run-to-run test, but may vary from server to server calibration [19]. However, as the performance variation among processors has been observed in previous studies, and the authors has not mentioned the core-to-core performance variation reported by SERT in this paper, we cannot tell if the workloads (worklets after the phase of calibration) used to stress each sample of processor are exactly the same. Apart from frequency variability, S. R. Sarangi et al [12] emphasize that, within-die parameter variation can result in process variation including both random and systematic effects, can also negatively impact a processor’s frequency and leakage power. Most of the studies focus on the difference at the server level, since processors are placed in different servers or different sockets, the results cannot eliminate the influences caused by system noise, such as the influence of the nearby processors, the platform bugs [8] [20] [21]. Moreover, thermal control strategy is rarely mentioned. As processors are temperature sensitive components, different operational temperature can affect the results.
III. DO IDENTICAL PROCESSORS CONSUME THE SAME? Newer technologies bring diverse features in improving performance for processors, and in the same time, introduce more variation regarding performance and energy usage to processors with the same design. We compare the power variation for Intel Xeon E5345 and Intel Xeon E5-2603 v2. Details about the processors can be found in Table I. The two processors both have 4 cores and the same TDP (Thermal Design Power) of 80W. Otherwise, they dispose different designs on architecture and operate on different base frequencies.
A. Experiments setup
The whole platform (excluding the power supply) is placed in a climatic cabin, where the ambient temperature is con-figured at 35◦C. The ambient set point is little higher than ASHRAE typical requirement limits (15- 32◦C, for products require a stable and more restrictive environment) [22] in order to exposure as much as possible the thermal characteristics difference between samples. Fan is placed on top of the proces-sor’s heat sink and powered by an external DC (Direct Current) source so as to avoid power variation brought by mother-board’s fan control. Homemade CPU intensive applications “bzip2” and “pi_calculator” are chosen to maximize the usage and heat dissipation of CPU. The application assign a specific task to the server, and active all the threads available in the system at full load to complete the task. This allows analyzing both the power and performance (execution time) variations among samples. The power consumption variation is analyzed by comparing the average power of the server in the last minute, where the thermal condition is tending towards stable. Performance variation. Samples of processors are tested and exchanged one by one in the same platforms. When exchanging the samples after each run, we try our best to uniform the heat paste applied between processor and fan. The platform test diagram shown in Figure 1 includes three parts: SUT, control and measurement system.
• SUT: Server Under Test, installed with Ubuntu Server
OS.
• The control system:
Controller: normal PC (personal computer) with Linux system installed, in the same local network with SUT and controls SUT remotely by SSH. Controller also gathers and synchronizes measurement data recorded by power and temperature analyzers.
Climatic chamber: Servathin RC01, controls ambient temperature.
Fan: controls CPU surface temperature, powered by external DC source.
• The measurement system: Power: measured by Wattsup-Pro [23]. Measures contain the power consumption of the whole server except the fan’s. Ambient temperature: measured by a thermometer with a thermocouple con-nected (type K, with 0.1mm diameter). CPU Temperature: collected by command line tool lm-sensors. Sampling frequency for all the measures are configured at 1Hz.
Fig. 1. Platform test diagram
B. Power variation for Intel processors of different genera-tions
After analyzing all the measurement data, we choose 18 representative processors for each platform: 9 samples that consume the most and another 9 samples that consume the least among all the 30 samples. Rank of consumption is shown in the following figures.
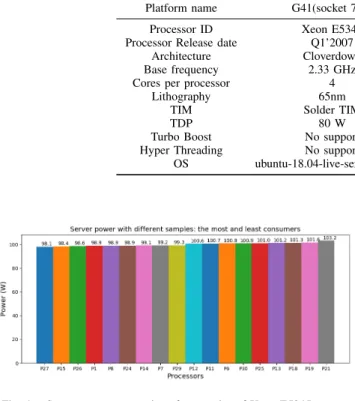
Fig. 2. Server power comparison for samples of Xeon E5-2603v2
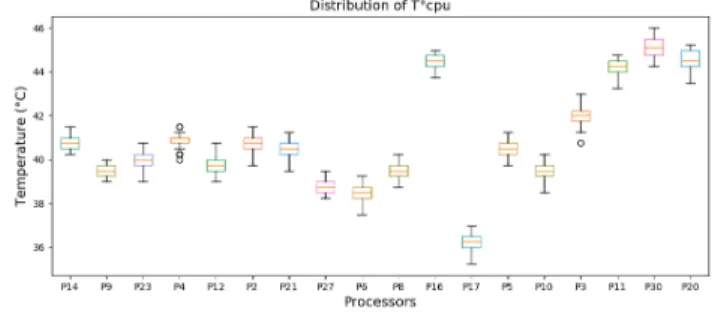
Fig. 3. CPU distribution for samples of Xeon E5-2603v2
Figure 2 and Figure 4 show the power by running appli-cation “pi_calculator” on the 18 processor samples of two types. It can be observed that, power variation among samples of Xeon E5-2603v2 (newer generation) between the best and worst can be more than 30% (16.1W / 51.9W). That is much larger than the variation observed from samples of Xeon E5345: 2.8% (2.8W / 98.4W). In addition, we verify the power variation of Xeon E5-2603v2 by running another application “bzip2”, and the rank of power consumption for samples stays the same. Therefore, the power variation
TABLE I
CHARACTERISTICS OF THE PROCESSORS
Platform name G41(socket 775) Just Game LGA2011 Processor ID Xeon E5345 Xeon E5-2603v2 Processor Release date Q1’2007 Q3’2013
Architecture Cloverdown Ivy Bridge Base frequency 2.33 GHz 1.8 GHz Cores per processor 4 4
Lithography 65nm 22nm TIM Solder TIM Polymer TIM
TDP 80 W 80 W
Turbo Boost No support No support Hyper Threading No support No support
OS ubuntu-18.04-live-server-amd64 ubuntu-18.04-live-server-amd64
Fig. 4. Server power comparison for samples of Xeon E5345
Fig. 5. CPU distribution for samples of Xeon E5345
observed in Xeon E5-2603v2 is not supposed to be affected by workload. In addition, we can notice that the server power of all the samples of Xeon E5-2603v2 are below the TDP (80W, refer to Table I). Actually, TDP of CPU gives a guidance to design cooling system. It represents for the maximum amount of heat generated by CPU. The cooling system is designed to be capable to dissipate heat under any workload without exceeding thermal envelope. Thus, TDP is not reflecting the actual power of CPU, it can be lower or higher than actual power usage [24].
Figure 3 and Figure 5 present the CPU temperature distribu-tions along the test (around about 1 hour), values are calculated as the mean temperature of all 4 cores. Comparing to Xeon E5345, CPU temperatures of Xeon E5-2603v2 spread over a wider range. However, no obvious correlation can be seen between CPU temperature and power consumption.
We also compare the performance variation (execution time) among all the samples, little performance variations are ob-served for both Xeon E5-2603v2 and Xeon E5345, 0.3% and 0.6% respectively. We find this normal, according to previous studies, operating frequency is responsible for most of the performance variation. While none of them support Turbo Boost or Multi-Threading technologies, operating frequency remains stable at maximum rate when applying the same workload. Therefore, the power variation presented here has no relationship with the performance variation.
IV. HOW THERMAL EFFECTS IMPACT ON THE CONSUMPTION OF SERVERS?
Results of the experiments in Section III show that, proces-sors of Xeon E5-2603v2 comes from newer generation have much more power variation than Xeon E5345. CPU temper-ature distributions along the test cannot perfectly explain the power variation. Even more, we confirm that the power varia-tion is not introduced by the performance variavaria-tion. Therefore, we can benefit from the situations to focus on the difference of thermal features between samples. The consumption of processor depends on IT load and cooling system. As the power increases with the load, processor works harder and dissipates more heat, if the heat is not evacuated in time by the cooling system, the temperature surrounding processor becomes higher and leads to the rise of leakage current, which will in reverse increase the power of CPU [25] [26]. In the study of [6], the authors observed that leakage current of processor can contribute to over 30% power variation for server. However, there is doubt whether the samples have the same ability to evacuate the heat. We are wondering if different thermal features can also result in the variation among processors.
In this section, we propose two hypotheses regarding dif-ferent thermal features between difdif-ferent samples of Xeon E5-2603v2. In subsection IV-A, we study the influence of TIM (Thermal Interface Material), in order to verify if the new PTIM (Polymer Thermal Interface Material) can result in the rise of the power consumption variation. In subsection IV-B, we investigate the parameters of leakage current among processors. We start from the representation equation of static
power and analyses the relationship between the leakage current and the temperature. Fans, DC power generator and climatic cabins are provided to help controlling precisely the temperature.
A. Hypothesis 1 : The switch of Thermal Interface Material (TIM)
TIM is applied to fill the air gap between processor Integrated Heat Spreader (IHS) and silicon die, so as to dissipate heat produced by processor more efficiently [27] [28]. A thermal model proposed by Huang W et al. [29] shows that, the thickness variation of TIM can affect a lot silicon die temperature distributions across processors. Figure 6 demonstrates a simple structure of the thermal package design. Since Ivy Bridge processor generation, Intel decides to adopt Polymer TIM (PTIM) as a replacement of Solder TIM (STIM), for reasons of economics, environment and better cooling performance [30].
Xeon E2603v2 applied with PTIM is turned out to have more power variation than Xeon E5345. We try to clear this suspect by removing PTIM from the original structure. However, TIM is hidden in IHS from exposing to outside, that arises a lot the challenge of manipulation: we have to remove TIM along with the entire IHS and this manipulation is irreversible. Three samples consuming less: P14, P23, P9 and two samples consuming more P30, P20 are involved in this study. After the manipulation, the processor’s silicon die was cooled directly with the heat spreader of fan (as shown in Figure 7). We applied a little heat paste between them to facilitate the heat exchange.
Fig. 6. Processor thermal package structure
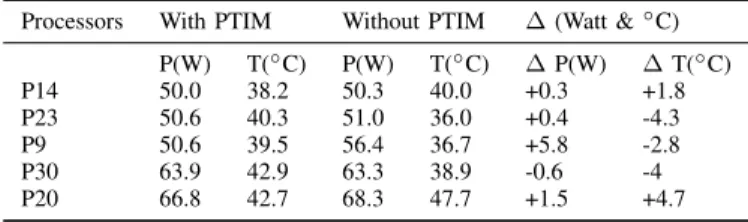
Then we repeat the test as described in Section III and re-analyze the power variation. Table II shows the results of power consumption and average CPU temperature in two circumstances: with and without PTIM. Unfortunately, removing the PTIM does not help correcting the power variation between samples. After removing PTIM, most of the samples (except P9) just have little power variation as well as with PTIM. Therefore, PTIM is not the source of power variation affected by fabrication process.
B. Hypothesis 2 : The leakage current variation
The overall power dissipation in today’s microprocessors is composed principally by two sources: dynamic power and static power. Other power loss such as short circuit occurs
Fig. 7. TIM remove schematic diagram
at whenever gate switch is relative small, it can be absorbed by dynamic power [31]. In this sub-section, we firstly review the CMOS technology, as theoretical guideline for our exper-iments. Then we present the details and results of the test.
1) CMOS Technology review: Dynamic power results from charging and discharging the processor’s capacitive loads. It can be described by the equation (1) [32] [33]:
Pdynamic= α
X
Cif Vdd2 (1)
where f is the switching activity (operating frequency), P Ciis the sum of gate and interconnection capacitances, and
Vdd is the supply voltage and α is the activity factor of the
overall circuit. Static power is the product of voltage supply and leakage current. There are different kinds of leakage modes in MOS transistor, and the most dominant leakage mechanism is sub-threshold leakage IDsub [34]. IDsub is the
current flow between source and drain at off-state. Off-state current becomes now a limitation factor for down-scaling the threshold voltage, since it determines the power consumption of a chip in its idle state. Therefore, the static power dissipation representation can be simplified and described by equation (2). IDsubcan be described by equation (3), according to previous
studies [35] [36].
Pstatic= VddIDsub (2)
IDsub= e
−qVth
akT (3)
where q, k, a and k are physical related constants, T is the absolute temperature and Vth is the threshold voltage of the
transistor, which sits between ground and the supply voltage. In earlier years, traditional low-power microprocessor design focus mainly on reducing dynamic power consumption. At that
TABLE II
POWER ANDCPUTEMPERATURE FORXEONE5-2609V2:WITH AND WITHOUTPTIM (WORKLOAD:PI CALCULATOR)
Processors With PTIM Without PTIM ∆ (Watt &◦C) P(W) T(◦C) P(W) T(◦C) ∆ P(W) ∆ T(◦C) P14 50.0 38.2 50.3 40.0 +0.3 +1.8 P23 50.6 40.3 51.0 36.0 +0.4 -4.3 P9 50.6 39.5 56.4 36.7 +5.8 -2.8 P30 63.9 42.9 63.3 38.9 -0.6 -4 P20 66.8 42.7 68.3 47.7 +1.5 +4.7
time, static power consumption is not a limitation and is negli-gible compared to dynamic power [32] [35]. In pursuing higher performance and lower consumption, CMOS technologies scaled the chips from generation to generation by following Moore’s law ”The number of transistors and resistors on a chip doubles every 24 months” [37]. The chips then have more transistors, denser CMOS circuitry and smaller dimension. In 2007, in applying 45nm process technology, there were 3.3 million transistors per square millimeter (MTr/ mm2) for chips of Intel. Ten years after, in 2017, Intel announced its latest chip generation: 10nm technology, with density as high as 100.8 MTr/ mm2, which is 30 times denser than in 2007 [27]. Note that, the designation like ”45nm”, ”10nm” refers to commercial name for certain lithography process technology. The number doesn’t indicate the size of any particular feature of the chip and can vary significantly between manufactures [38]. As a general rule, the smaller the number is, the denser the circuitry becomes.
As the chip dimension scaled, for the purpose of reliability required by constant field scaling, supply voltage Vdd has
to be decreased by the same factor for chips to keep the electric fields the same across different generations [39]. That brings additional benefit of dynamic power saving as suggested by equation (1). The threshold voltage (Vth), has also to be
scaled down along with the Vdd in order to avoid performance
degradation as shown by equation (4) [40]. Delay = 1 f = CgateVdd IDsat ∝ Vdd (Vdd− Vth)1.3 (4) Yet, as a result, the IDsub increases exponentially with the
Vth decreases [31] [41] according to equation (3). Therefore,
in modern processors, static power takes greater and greater part in consumption and becomes increasingly dominant. Moreover, advanced lithography process with thinner xnm may have more fabrication deviations to impact the parameter values of leakage current among identical processor samples, then leads to eventually power consumption variation. Comparing the two processors, the newer generation E5-2603v2 with 22nm technology has 10 times more power variation than E5345 with 65nm technology. This provides a great opportunity to empirically evaluate the impact of fabrication brought by CMOS technology evolution on the processors variability.
However, there is no way to measure directly the leak current of the processor by physical device, without ”opening” some key components hidden and protected by Intel packing technology. Such manipulation is too risky and may cause permanent damage to the motherboard. The only measure of consumption accessible is the whole consumption of server composed of consumption of CPU (Pcpu) and of the other
components including motherboard (Pchip). The processor
samples are switched one by one in the same motherboard, Pchip remains the same, the only item can vary the
con-sumption of server is Pcpu. As discussed before, Pcpu is
composed by dynamic and static power. It can be seen from the equation (1) (2) and (3) that, dynamic power is frequency dependent value but independent from temperature variation. On the contrary to dynamic power, static power is temperature sensitive value, but cannot be affected by frequency scaling. The consumption of the whole server can be then simply represented by the equation (5) and (6):
Pserver(Vdd, Tcpu, f ) = Pchip+ Pcpu(Vdd, Tcpu, f ) (5)
Pcpu(Vdd, Tcpu, f ) = Pdynamic(Vdd, f ) + Pstatic(Vdd, Tcpu)
(6) Our test platform has no support in BIOS to regulate manually Vdd. f is governed by frequency governor ”performance”
and adjusted by frequency driver intel_pstate. f varies according to system current load. In this case, the data obtained is too limited to separate and quantify the two sources of consumption by statistical analyses. Deriving the models of static and dynamic power of processor is interesting, but it is beyond the scope of the study discussed here. If interested, Goel et al [42] present a systematic methodology for modeling static and dynamic power consumption of individual cores and uncore components in their work. In our cases, for a given processor sample, we fix f and Vdd, and suppose that the value
of Pdynamic is constant and independent from temperature
variation. The parameters of leakage current as expressed in equation (2) and (3) can be simply identified by varying the Tcpuwhiling keeping the f and Vdd unchanged.
2) Experiment setup: Same platform as described in section III-A is adopted. CPU intensive benchmark cpuburn [43] is selected to stress the SUT in this test. Comparing other CPU intensive benchmarks, cpuburn is better at maximizing the
heat dissipation of processor. During the execution of cpuburn, each thread is stressed at full load and operating frequency (f ) is then maintained constantly at (1.8GHz). Besides ambient and CPU temperature, we monitor as well the CPU voltage (in using command-line tool lm-sensors [44]) and CPU frequency (in using python library psutil [45]). Climatic cabin is used to vary the surface temperature of CPU. Some of the processors samples have been used in previous test to validate the hypotheses 1 in section IV-A. Their TIM and HIS are removed. This manipulation is irreversible and may introduce unexpected influence to the consumption, therefore, these samples are excluded from this test. Four samples consume less: P12, P21, P6, P4 and four samples consume more P3, P10, P5, P8 are chosen to validate the second hypotheses.
For each sample, we repeat the test procedures as follows:
• Keep the server on idle state for 3 minutes at 22◦C ambient temperature.
• Execute cpuburn for 30 minutes. Along the test, config-ure the climatic cabin to increase the ambient temperatconfig-ure from 22◦C to 50◦C.
• After the execution of cpuburn, keep the server on state idle for 3 minutes at 50◦C ambient temperature.
• Shutdown the server, switch for the next processor sample
and wait for the whole platform cool down at 22◦C ambient temperature.
3) Experiment results and analyzes:
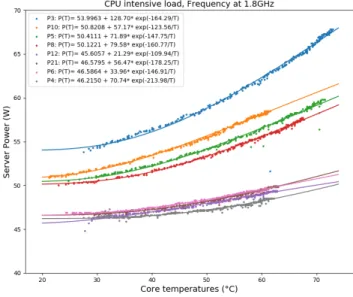
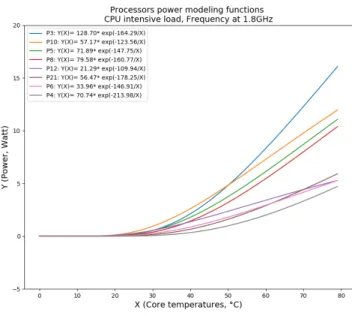
a) On high load state: High load state occurs at the second step, where server is stressed by cpuburn. Figure 8 shows the evolution of CPU temperatures with the ambient temperature increases from 22◦C to 50◦C. It can be observed that, cooling abilities of CPU samples differ from each other. CPU temperature increases gradually with the rise of ambient temperature but ends at different values where the ambient temperature is supposed to be at 50◦C. Figure 9 shows how server power varies with the rise of CPU temperature. Processor samples are marked with different colors. The points represent for the real measure data. The server power can be represented by CPU temperature in using an exponential function of form exp(−k/T ) as mentioned in equation (3). We can find that the change rates of power with the increase of CPU temperature are different among samples. Samples consume more (P3, P10, P5 and P8) have also higher change rates than samples consume less (P12, P21, P6, P4). In another word, processor samples P3, P10 P5 and P8 are harder to be cooled down than the others. Change rates of samples can be identified clearly in presenting the exponential function without the intercept, as shown in Figure 10
b) On idle state: On idle state, only OS is running in the server. Power consumptions on idle state for different samples are compared at 22◦C and 50◦C ambient temperature respectively. Results are shown in Figure 11. We can observe that, there is more power variation on idle state at 50◦C ambient temperature. Moreover, with the same rise of ambient
Fig. 8. CPU temperature as function over time
Fig. 9. Relationship of CPU temperature and Server power for different samples during execution of cpuburn
temperature, idle power goes up to a higher value for samples that consume more.
V. CONCLUSIONS AND PERSPECTIVES
With the decrease of lithography size for modern processors, technology today can hardly control precisely the variability between processor samples in fabrication process. Apart from the performance variability brought by the operating frequency variation, our experimental results show surprisingly high variability of power consumption within modern processor. 30% power consumption variation is observed among 30 identical processor samples, which has no correlation with the performance (frequency variation). In the first time, we confirm and characterize by means of physical experiments, the power consumption variation introduced by within die parameter variation. Fabrication variability has random effects
Fig. 10. Illustrations of server powers functions for different processor samples
Fig. 11. Server power on idle state at 22◦C and 50◦C ambient temperatures
on processor samples. Samples can have different heat dis-sipation rates under the supposed same conditions (ambient temperature and load level), which results in different leakage current distributions then finally affect the static power con-sumption among samples. Our demonstration highlights the challenges of modeling techniques posed by rising processors variability. Even for servers in homogeneous clusters cannot consider being exactly the same. As a result, the precision of existing power models can be questioned when applying to other identical SUT samples. Taking these concerns into account, power modeling techniques based on pure software solutions such as linear regression or performance counters, are not reliable enough for modern servers in predicting power from one server to several servers in a rack or data centers. In addition, the findings present in this paper can be also applied to optimize the energy management strategies in data center, such as VM migration, shut down technology. Power consumption variation occurs at server level could be worse than at processor level. Processor samples with worse
thermal features will not only have more static power, but also request more energy in associated cooling system. We will further investigate to filter out the servers with both better and worse thermal features in a data center, in order to better orient energy management strategies. Processors are becoming smaller, more powerful and less consuming from generation to generation. On the other side, processors become more complex than ever. Leakage current variations arise from imperfections in the fabrication process among modern processors, such as lithographic length aberration. According to our observations, leakage current variations have impact on cooling ability, samples dispose of different increase rate with the rise of temperature.
REFERENCES
[1] N. Jones, “How to stop data centres from gobbling up the world’s electricity.” Nature, vol. 561, no. 7722, pp. 163–166, 2018.
[2] M. Vor Dem Berge, G. Da Costa, M. Jarus, A. Oleksiak, W. Piatek, and E. Volk, “Modeling data center building blocks for energy-efficiency and thermal simulations,” in Energy-Efficient Data Centers, H. Springer, Berlin, Ed. Springer, 2014, vol. 8343, pp. 66–82.
[3] G. Da Costa and H. Hlavacs, “Methodology of measurement for energy consumption of applications.” Tech. Rep., 2010.
[4] M. Jarus, A. Oleksiak, T. Piontek, and J. Weglarz, “Runtime power usage estimation of hpc servers for various classes of real-life applications,” Future Generation Computer Systems, vol. 36, pp. 299–310, 2014. [5] M. Canuto, R. Bosch, M. Macias, and J. Guitart, “A methodology
for full-system power modeling in heterogeneous data centers,” in Proceedings of the 9th International Conference on Utility and Cloud Computing, ser. UCC ’16. New York, NY, USA: ACM, 2016, pp. 20– 29. [Online]. Available: http://doi.acm.org/10.1145/2996890.2996899 [6] Y. Wang, D. N¨ortersh¨auser, S. Le Masson, and J.-M. Menaud, “Potential
effects on server power metering and modeling,” Wireless Networks, pp. 1–8, 2018.
[7] B. Acun, P. Miller, and L. V. Kale, “Variation among processors under turbo boost in hpc systems,” in Proceedings of the 2016 International Conference on Supercomputing, ser. ICS ’16. New York, NY, USA: ACM, 2016, pp. 6:1–6:12. [Online]. Available: http://doi.acm.org/10.1145/2925426.2926289
[8] A. Marathe, Y. Zhang, G. Blanks, N. Kumbhare, G. Abdulla, and B. Rountree, “An empirical survey of performance and energy efficiency variation on intel processors,” in Proceedings of the 5th International Workshop on Energy Efficient Supercomputing, ser. E2SC’17. New York, NY, USA: ACM, 2017, pp. 9:1–9:8. [Online]. Available: http://doi.acm.org/10.1145/3149412.3149421
[9] J. C. McCullough, Y. Agarwal, J. Chandrashekar, S. Kuppuswamy, A. C. Snoeren, and R. K. Gupta, “Evaluating the effectiveness of model-based power characterization,” in USENIX Annual Technical Conf, vol. 20, 2011.
[10] M. E. M. Diouri, O. Gl¨uck, L. Lef´evre, and J. Mignot, “Your cluster is not power homogeneous: Take care when designing green schedulers!” in 2013 International Green Computing Conference Proceedings, June 2013, pp. 1–10.
[11] J. von Kistowski, H. Block, J. Beckett, C. Spradling, K.-D. Lange, and S. Kounev, “Variations in cpu power consumption,” in Proceedings of the 7th ACM/SPEC on International Conference on Performance Engineering, ser. ICPE ’16. New York, NY, USA: ACM, 2016, pp. 147– 158. [Online]. Available: http://doi.acm.org/10.1145/2851553.2851567 [12] S. R. Sarangi, B. Greskamp, R. Teodorescu, J. Nakano, A. Tiwari,
and J. Torrellas, “Varius: A model of process variation and resulting timing errors for microarchitects,” IEEE Transactions on Semiconductor Manufacturing, vol. 21, no. 1, pp. 3–13, Feb 2008.
[13] H. C. Coles, Y. Qin, and P. N. Price, “Comparing server energy use and efficiency using small sample sizes,” Lawrence Berkeley National Laboratory, Tech. Rep., 2014.
[14] A. Orgerie, L. Lef`evre, and J. Gelas, “Demystifying energy consumption in grids and clouds,” in International Conference on Green Computing, Aug 2010, pp. 335–342.
[15] T. Wendy, B. Kevin, and A. Victor, “The unexpected impact of raising data center temperatures,” Schneider Electric, Tech. Rep., 2011. [16] S. Sampath, “Thermal analysis of high end servers based on development
of detail modeland experiments,” The university of texas at Arlington, Tech. Rep., 2012.
[17] B. Balaji, J. McCullough, R. K. Gupta, and Y. Agarwal, “Accurate characterization of the variability in power consumption in modern mobile processors,” in Proceedings of the 2012 USENIX Conference on Power-Aware Computing and Systems, ser. HotPower’12. Berkeley, CA, USA: USENIX Association, 2012, pp. 8–8. [Online]. Available: http://dl.acm.org/citation.cfm?id=2387869.2387877
[18] K.-D. Lange and M. G. Tricker, “The design and development of the server efficiency rating tool (sert),” in Proceedings of the 2Nd ACM/SPEC International Conference on Performance Engineering, ser. ICPE ’11. New York, NY, USA: ACM, 2011, pp. 145–150. [Online]. Available: http://doi.acm.org/10.1145/1958746.1958769
[19] Y. Wang, D. N¨ortersh¨auser, S. Le Masson, and J.-M. Menaud, “Etude de l’influence des aspects thermiques sur la consommation et l’efficacit´e ´energ´etique des serveurs,” in SFT 2018 - 26`eme Congr`es Franc¸ais de Thermique, Pau, France, May 2018, pp. 1–8. [Online]. Available: https://hal.inria.fr/hal-01763524
[20] O. Tuncer, E. Ates, Y. Zhang, A. Turk, J. Brandt, V. J. Leung, M. Egele, and A. K. Coskun, “Diagnosing performance variations in hpc applications using machine learning,” in High Performance Computing, J. M. Kunkel, R. Yokota, P. Balaji, and D. Keyes, Eds. Cham: Springer International Publishing, 2017, pp. 355–373.
[21] E. A. Le´on, I. Karlin, and A. T. Moody, “System noise revisited: Enabling application scalability and reproducibility with smt,” in 2016 IEEE International Parallel and Distributed Processing Symposium (IPDPS), May 2016, pp. 596–607.
[22] A. T. Committee, “Data center power equipment thermal guidelines and best practices whitepaper,” ASHRAE, Tech. Rep., 2016. [Online]. Avail-able: https://tc0909.ashraetcs.org/documents/ASHRAE TC0909 Power
White Paper 22 June 2016 REVISED.pdf
[23] (2010) Wattsup pro power meter. [Online]. Available: http://www.wattsupmeters.com
[24] C. Andrew. (2013) The technical details behind intel’s 7 watt ivy bridge cpus. [Online]. Available: https://arstechnica.com/gadgets/2013/01/the-technical-details-behind-intels-7-watt-ivy-bridge-cpus/
[25] E. Kursun and C. Cher, “Temperature variation characterization and thermal management of multicore architectures,” IEEE Micro, vol. 29, no. 1, pp. 116–126, Jan 2009.
[26] D. Moss and J. H. Bean, “Energy impact of increased server inlet temperature,” APC white paper, vol. 138, 2009.
[27] C. Rachel. (2017) Intel now packs 100 million transistors in each square millimeter - ieee spectrum. [Online]. Available: https://spectrum.ieee.org/nanoclast/semiconductors/processors/intel-now-packs-100-million-transistors-in-each-square-millimeter.
[28] R. Prasher, “Thermal interface materials: Historical perspective, status, and future directions,” Proceedings of the IEEE, vol. 94, no. 8, pp. 1571–1586, Aug 2006.
[29] W. Huang, E. Humenay, K. Skadron, and M. R. Stan, “The need for a full-chip and package thermal model for thermally optimized ic designs,” in Proceedings of the 2005 International Symposium on Low Power Electronics and Design, ser. ISLPED ’05. New York, NY, USA: ACM, 2005, pp. 245–250. [Online]. Available: http://doi.acm.org/10.1145/1077603.1077662
[30] D. A. R. Mukul P, P. Neha and W. Vijay, “Material technology for environmentally micro-electronic packagingl perspective, status, and future directions,” Intel Technology Journal, 2006.
[31] N. S. Kim, T. Austin, D. Baauw, T. Mudge, K. Flautner, J. S. Hu, M. J. Irwin, M. Kandemir, and V. Narayanan, “Leakage current: Moore’s law meets static power,” Computer, vol. 36, no. 12, pp. 68–75, Dec 2003. [32] C.-L. Su, C.-Y. Tsui, and A. M. Despain, “Low power architecture
design and compilation techniques for high-performance processors,” in Proceedings of COMPCON ’94, Feb 1994, pp. 489–498.
[33] D. Etiemble, “45-year CPU evolution: one law and two equations,” in Second Workshop on Pioneering Processor Paradigms, Vienne, Austria, Feb. 2018. [Online]. Available: https://hal.archives-ouvertes.fr/hal-01719766
[34] A. Keshavarzi, K. Roy, and C. F. Hawkins, “Intrinsic leakage in low power deep submicron cmos ics,” in Proceedings International Test Conference 1997, Nov 1997, pp. 146–155.
[35] M. Horowitz, T. Indermaur, and R. Gonzalez, “Low-power digital design,” in Proceedings of 1994 IEEE Symposium on Low Power Electronics, Oct 1994, pp. 8–11.
[36] J. A. Butts and G. S. Sohi, “A static power model for architects,” in Proceedings 33rd Annual IEEE/ACM International Symposium on Microarchitecture. MICRO-33 2000, Dec 2000, pp. 191–201. [37] G. E. Moore, “Cramming more components onto integrated circuits,”
Proceedings of the IEEE, vol. 86, no. 1, pp. 82–85, Jan 1998. [38] (2016) Technology node. [Online]. Available:
https://en.wikichip.org/wiki/technology node
[39] R. H. Dennard, F. H. Gaensslen, V. L. Rideout, E. Bassous, and A. R. LeBlanc, “Design of ion-implanted mosfet’s with very small physical dimensions,” IEEE Journal of Solid-State Circuits, vol. 9, no. 5, pp. 256–268, Oct 1974.
[40] T. Sakurai and A. R. Newton, “Alpha-power law mosfet model and its applications to cmos inverter delay and other formulas,” IEEE Journal of Solid-State Circuits, vol. 25, no. 2, pp. 584–594, April 1990. [41] B. Zhai, D. Blaauw, D. Sylvester, D. Sylvester, and K. Flautner,
“Theoretical and practical limits of dynamic voltage scaling,” in Proceedings of the 41st Annual Design Automation Conference, ser. DAC ’04. New York, NY, USA: ACM, 2004, pp. 868–873. [Online]. Available: http://doi.acm.org/10.1145/996566.996798
[42] B. Goel and S. A. McKee, “A methodology for modeling dynamic and static power consumption for multicore processors,” in 2016 IEEE International Parallel and Distributed Processing Symposium (IPDPS), May 2016, pp. 273–282.
[43] R. Robert, “Ubuntu manpage: cpuburn, burnbx, burnk6, burnk7, burnmmx, burnp5, burnp6 - a collection,” 2011, online; accessed 2018-05-28. [Online]. Available: https://patrickmn.com/projects/cpuburn/ [44] ArchWiKi. (2016) lm sensors - archwiki. [Online]. Available:
https://wiki.archlinux.org/index.php/lm sensors
[45] Psutil. (2009) psutil 5.5.0 documentation. [Online]. Available: https://psutil.readthedocs.io/en/latest/