HAL Id: hal-02291088
https://hal.archives-ouvertes.fr/hal-02291088
Submitted on 18 Sep 2019
HAL is a multi-disciplinary open access
archive for the deposit and dissemination of
sci-entific research documents, whether they are
pub-lished or not. The documents may come from
teaching and research institutions in France or
abroad, or from public or private research centers.
L’archive ouverte pluridisciplinaire HAL, est
destinée au dépôt et à la diffusion de documents
scientifiques de niveau recherche, publiés ou non,
émanant des établissements d’enseignement et de
recherche français ou étrangers, des laboratoires
publics ou privés.
To cite this version:
Antoine Saverimoutou, Bertrand Mathieu, Sandrine Vaton.
A 6-month Analysis of Factors
Impacting Web Browsing Quality for QoE Prediction.
Computer Networks, Elsevier, 2019,
bIMT Atlantique - Brest - France : sandrine.vaton@imt-atlantique.fr
A R T I C L E I N F O
Keywords: Web browsing Big Data Analytics QoE
Prediction Machine Learning
A B S T R A C T
Web browsing is one of the main Internet services, which has largely evolved over the last years. It now includes many different components (images in various formats, css, Javascript, Progressive Web Apps, etc.) and a web page is composed of many different resources provided by many servers located in various places. Knowing how web browsing content is delivered is crucial for better understanding the Quality of Experience (QoE) offered to end-users. Detecting the factors impacting this QoE is important to improve them but also to be able to predict the quality in order to anticipate degradations to it and propose remediations, which is the main goal of our study. For this, we present an analysis of a measurement campaign we have performed during 6 months (July 2018 - January 2019) on the Top 10,000 Alexa websites, which helps to identify the main factors which can impact the quality perceived by end-users. This set of factors has been confirmed by a machine learning process (decision tree), which gives as outputs the set of rules to predict the QoE. The evaluation of our decision tree-based model, on the Top 10,000-15,000 Alexa websites, never accessed before, shows that we can correctly predict the web browsing quality an end-user can get.
1. Introduction
Web browsing is a fast-paced and changing domain and needs to deliver a good experience to end-users since a plethora of applications and services are nowadays accessed through web browsers. The Web was originally designed to deliver static contents but has evolved dramatically towards dynamic web pages offering to end-users a built-in environment for education, gaming, video streaming or social networking [1,
2,3]. Large service companies (e.g Google, Mozilla, Apple, etc.) are following the trend of new technologies by enabling Virtual Reality, Virtual Machines or IoT (Internet of Things) applications embedded in the web browsers. They are deliv-ered over HTTP/1.1 but also over new transport protocols such as HTTP/2 (Version 2 of the HyperText Transfer Pro-tocol) [4], standardized in 2015, or QUIC (Quick UDP Inter-net Connection) [5,6] which is paving its way to standard-ization, as HTTP/3. Network operators or service providers need to offer the best possible QoS (Quality of Service) to their customers and for this, they deploy Content Delivery Networks (CDN) and proxy-based networking architectures, aiming to improve the web browsing delivery.
The question of measuring the quality when perform-ing web browsperform-ing and the need to identify the main fac-tors decreasing or enhancing it is then of prime importance. Measuring web browsing quality needs to be performed in a meticulous manner by taking into account the latest rich-exposed browsers’ functionalities. Based on a large mea-surement campaign we performed over 6 months (July 2018 - January 2019), our first contribution provides an overview of today’s web browsing delivery, including the number of resources, their location, the protocol used, etc. Secondly, we perform a detailed study of these parameters’ impact on end-users’ perceived quality, in order to highlight the factors which are the most critical for Web browsing. Thirdly, we
use Machine Learning techniques to validate the identified factors and through a decision tree model, we identify the thresholds of these factors in order to automatically predict the end-users web browsing quality. Then, the identified set of rules of our model are applied on the Alexa top 10K-15K websites and our model proves to be efficient, predicting cor-rectly more than 90% of measurements.
The paper is structured as follows: We first remind in section2the existing web metrics and related work meant to quantify and qualify web browsing. Through section3we in-troduce how our measurement campaign is performed, sec-tion4depicts how web browsing content is delivered to end-users and section5analyses the impacts of the parameters on web browsing quality. Section6presents our rules-based model to predict web browsing quality. We finally conclude in section7.
2. Background and Related Work
Policies and processing algorithms used by web browsers to render web pages are all different. In order to bring uni-form benchmarking indicators, standardization bodies such as the W3C, in collaboration with large service companies, have defined a set of web metrics to measure web page load-ing better. The Page Load Time1(PLT) is the time between the start of the request and when the entire web page has been loaded. The Resource Timing2provides information upon the downloaded resources unit-wise, such as the transport protocol used, size and type of object or some low level net-working information. The Paint Timing3exposes the First Paint (FP) which is the time for a first pixel to appear on the end-user’s web browser screen. The Above-The-Fold (ATF)
1https://www.w3.org/TR/navigation-timing/ 2https://www.w3.org/TR/resource-timing-2/ 3https://www.w3.org/TR/paint-timing/
Monitoring) expose a score representing the visible surface area occupancy of a web page. The Latency Amplification Factor (LAF) [9] characterizes the content of a web page in terms of how it affects the page load time.
When end-users go to a website, third parties such as advertisement networks can impact web browsing quality [10,11,12]. To measure QoE during web browsing sessions, several tools have been developed by the research commu-nity. FPDetective [13] uses a PhantomJS4 and Chromium based automation insfrastructure, OpenWPM [14] performs automated web browsing driven by Selenium5 while sup-porting stateful and stateless measurements and the Chameleon
Crawler6 is a Chromium based crawler used for detecting browser fingerprinting. Fourth Party [15] instruments the Mozilla-Firefox browser and Web Xray [16] is a PhantomJS based tool for measuring HTTP traffic. XRay [17] and
Ad-Fisher[18] run automated personalization detection exper-iments and Common Crawl7uses an Apache Nutch based crawler. Kaleidoscope [19] is an automated tool to evaluate web features on a large scale focused on the web page style and page loading times. All these tools (among others) have largely contributed to the research field but when wanting to objectively quantify and qualify web browsing, there is a clear need to finely reproduce an end-user environment and usual interaction with the latest web browser functionalities, which they do not offer. We have thus developed our own tool highlighted in section3which offers fine-grained infor-mation through the latest implemented web metrics and data obtained from network capture and browser’s offered HTTP Archive (HAR). We also collect information regarding the different remote web servers located all over the world, the downloaded resources’ type, size and Internet protocol through which they are delivered at different stages of the web page loading process.
Web browsing includes 4 key actors, namely the end-user, the web browser, the network and the remote web server. While some research work [20,21] describes how to qual-ify user-experience better, other studies investigate the im-pact of different Internet protocols on web browsing quality [22,23,24,25,26,27]. Regarding the network, particular interest is given to the upload or download link when in-vestigating bottlenecks [28,29,30] and Naseer and al. [31] propose a tool in order to analyze and better understand the actual configuration parameters employed by today’s web servers. The PLT is the de facto used web metric but with the evolution of websites’ characteristics, researchers
ques-4http://phantomjs.org/ 5https://www.seleniumhq.org/
6https://github.com/ghostwords/chameleon 7https://commoncrawl.org/
browsers, Internet protocols, network bandwidths and types of websites need to be taken into account. We have thus fo-cused our research work by taking into account the mostly used on-market web browsers, studied the impact of differ-ent Internet protocols (HTTP/1.1, HTTP/2 or QUIC), used different types of residential network access (ADSL, Wi-Fi, Fiber) and assessed the Top 10,000 Alexa websites. Our measurements include all the web metrics defined by the W3C and the TFVR (Time for Full Visible Rendering) [8].
3. Measurement Campaign Setup
Our measurement campaign has been performed with the tool Web View[38]. Web View is a measurement plat-form whose infrastructure includes probes and a public vi-sualization website8 illustrating the obtained measurement results for a set of websites. The Web View probe is a user-orientated measurement tool whose main objective is to per-form automated web browsing sessions and measure repre-sentative information of web pages in order to better ify and understand web browsing, both in terms of qual-ity and delivery. Each test can be configured with several parameters, such as the web browser, the access network type on which the probe is connected, the list of websites to measure, the preferred transport protocol to get the con-tents (HTTP/1.1, HTTP/2, QUIC), etc.
For this study, we deployed probes in France, three different desktop machines (CPU Intel Core i5 and 8 GB RAM) con-nected to three different user-representative residential net-work accesses, i.e ADSL (10Mbps down, 1Mbps up), Wi-Fi (200Mbps down, 160Mbps up) and FTTH Fiber (800Mbps down, 300Mbps up). The Wi-Fi network access (802.11 b/g/n, 2.4Ghz and 450Mbit/s max) is provided by a home-box, connected to the Fiber operational network. Our probes are located in the same room as the Wi-Fi homebox. Two popular web browsers, with different window sizes, were used, namely Google-Chrome (version 63 and 68) and Mozilla-Firefox (version 56 and 62). The Google-Chrome browser is driven by Chromedriver v.2.36 and v.2.40 and Mozilla-Firefox by Geckodriver v.0.19 where the main automater is Selenium v.3.14. Both browsers support HTTP/1.1 and HTTP/2, but only Google-Chrome implements QUIC. The automated web browsing sessions were conducted at different times of the day by requesting different Internet protocols. Some In-ternet protocols might be disabled or blocked by service providers or corporate companies and the need to study what the ob-tained quality is when an Internet protocol is not available is important. When requesting HTTP/1.1, we deactivate the HTTP/2 and QUIC protocols in the browser; when
(a) Resources’ location
(b) MIME type of resources Figure 1: Downloaded resources
ing HTTP/2 we deactivate QUIC but allow fallback to HTTP/1.1 (not all content-servers are HTTP/2-enabled); when request-ing QUIC, we allow fallback to HTTP/1.1 and HTTP/2 for non-UDP web servers. We also define another mode, the QUIC Repeat. This mode favors 0-RTT UDP and 1-RTT TCP by firstly performing a navigation to the website, clos-ing the browser, clearclos-ing the resources’ cache but keepclos-ing the DNS (Domain Name System) cache and going once more to the website when we collect measurements. For all our measurements, the resources’ cache is always emptied at the start and end of web browsing session, and we have defined a timeout of 18 seconds (this value has been set since it is a very long time to wait for a web page and after more then 18 sec, all end-users will have given up the browsing).
For every visited website, Web View probes measure and compute 84 parameters9. Amongst them, we have 4 differ-ent loading times, namely the First Paint (FP), Time for Full Visual Rendering (TFVR), the processing time (DOM time) and the Page Load Time (PLT). We also collect network traffic from which we investigate the corresponding DNS time for the main web page domain and through the col-lected HAR10we assess the overall number of objects
down-loaded and their MIME (Multipurpose Internet Main Exten-sions) type. From the exposed remote servers’ IP address correlated to MaxMind GeoIP2 database11 and RIPE NCC database12, we estimate the continents from which these re-sources are downloaded. Web View also identifies if the resources are delivered with secure connections or not, the number of domains serving the contents and the category of the website as referenced by Alexa. As per the different collected timings, which indicate a web page page loading progression through time, we also collect the number of re-sources downloaded in these periods of time as well as the Internet protocol through which they are delivered.
After our 6-months campaign on the top 10,000 Alexa 9https://webview.orange.com/monitoringParameters
10HTTP Archive
11http://www.maxmind.com 12https://stat.ripe.net/
websites, we got 244 Million different measurements, rep-resenting the measurement of 9597 distinct websites. 403 distinct websites were discarded due to the small amount of web browsing results (these websites were either unavail-able, blocked as per our geographic location or not respond-ing in less than 18 seconds). Our dataset then includes mea-surements for websites having their main web page estimated to be in North America (NA) for 52.23%, in Europe (EU) for 28.44%, in Asia (AS) for 16.22%, and in South America (SA) for 1.10%.
4. Web Browsing Delivery Analysis
We present in this section an analysis of our collected measurements and highlight the main evolutions of web brows-ing delivery with regards to previous studies [39,9] which have identified that the category of a website (as per Alexa ranking), number of objects embedded in the web page and amount of web servers delivering content has an impact on web browsing quality. A part of our dataset is made public athttps://webview.orange.com/public/dataset.zip.
4.1. What are these objects ?
The web pages are more complex nowadays and we wanted to evaluate their evolution, compared to what it was few years ago [39,40,41]. When a main web page is located in Europe, on average between 2 and 47 resources need to be down-loaded for less than 25% of the websites and between 125 and 230 resources need to be downloaded for more than 75% of these websites. Since 2014, the amount of downloaded resources composing a web page has increased by 17% on average for the Alexa websites ranked 1-2000 and by 31% on average for websites ranked 5000-10000.
Going deeper into the question from where the resources are downloaded, (Fig.1a) presents the location of the servers. On average, when a main web page is located in North Amer-ica, a mean number of 72 resources is downloaded , mainly from EU and from NA. When a main web page is in Asia, an average number of 78 resources is downloaded, about half
(a) Main web page in NA (b) Main web page in SA
(c) Main web page in EU (d) Main web page in AS Figure 2: Aggregated distribution of resources
(a) Distribution for Entertainment category (b) Distribution for Shopping category Figure 3: MIME types of objects per category
from Asia, and the other half from NA and EU. The mean distributions help in profiling the overall location of the con-tent servers for a European end-user. The Fig.2provides the complete distribution of downloaded resources for the 4 con-tinents where the main home page is. The Fig.2ashows that when a main web page is located in North America, for 50% of the measurements, more than 8 objects are downloaded from EU and 50 objects from NA. On the other hand, the Fig.2dshows that when a main web page is in Asia, for 75% of the different measurements, up to 65 objects are down-loaded from AS, 20 objects from EU and 27 objects from NA. We can observe that for a European end-user, many ob-jects are downloaded from Europe, which is due to Content Delivery Networks. For main web pages located in Asia, we can detect that many resources are coming from Asia, which could impact the quality, because of the network delay.
Following the question about what these objects are, Fig.
1brepresents the breakdown of the downloaded objects by
content MIME types of 8 random websites belonging to dif-ferent categories as referenced by Alexa. While images oc-cupy most of the time the highest distribution type of re-sources, on average web pages (except Search-Engines cate-gory) are composed of 4 css, 5 scripts, 16 images and 2 xml. We identified that the average number of scripts and images has increased by 53% over the last 15 years from past stud-ies [42] and by 7% from recent studies [39]. Furthermore when paying particular attention to the different types of im-ages, when using a Google-Chrome web browser and vis-iting a Google website, on average 80% of images are now in WebP format. Compared to studies conducted in 2011 – 2014, Flash usage has been reduced by 61% as Adobe will remove all support for Flash in 2020. When performing our measurements, we also noticed an increasing PWA (Progres-sive Web Apps) usage of 6% between July 2018 and January 2019. On a wider scope, based on the Alexa websites Cat-egory listings available, 3921 websites were assessed. The
Figure 4: Website lemonde.fr content servers
Kids and Teenswebsites have a significant greater fraction of Flash objects and Shopping websites make greater usage of JavaScript. When assessing the overall distribution of re-sources aggregated by MIME type, the Fig.3represents two different Alexa-referenced categories where a large variety of objects are incorporated in the corresponding web pages. We selected these 2 categories, since they represent a major part of the popular websites. The Fig.3ashows that
Enter-tainmentwebsites make greater usage of images (in WebP,
PNGor JPG format), followed by JavaScripts and Videos (which can be further decomposed in different formats, e.g
WebM, Mp4 or Mp2t). The Shopping websites (Fig.3b) also make use of a high number of images in different formats which greatly change all along the day thanks to JavaScript.
4.2. Who is delivering the resources?
In this analysis, we aimed to identify to which extent, when an end-user navigates to a specific website from a given location, the resources needed are downloaded from many servers located at various places. For this, we analyzed if the contents are downloaded from the same authoritative DNS name server of the main web page. Domains delivering con-tents and having the same authoritative DNS name server as the main web page are entitled Same-Origin domains and conversely Non-Origin domains. From our global measure-ments, when a main web page domain is in North America or Europe, irrespective of the preferred Internet protocol, con-tents are served on average by 2 Same-Origin domains and 7
Non-Origindomains and when the main web page is in Asia or South America, contents are delivered on average by 3
Same-Origindomains and 13 Non-Origin domains. Those
Non-Origindomains represent specific services involved in the web page composition (e.g., Google services, such as advertisements or analytics) but also CDN nodes providing contents on behalf of the origin servers.
The average number of domains is not huge, but we can have some websites with many different domains involved in the delivery. As an example of such a complex web-site, Fig.4points out the servers delivering contents when browsing the website lemonde.fr, where the main web page is located in Europe and belongs to the News category. For this website, 352 resources are downloaded from 29 differ-ent domains, where 15 domains located in North America deliver 50 resources and 14 domains in Europe deliver 302 resources. The main web page as well as the 13 Same-Origin domains are hosted in Europe by Fastly serving 61.36% of
Figure 5: Objects downloaded in HTTP or HTTPS
the overall number of resources, while Akamai and Amazon serve 11.36% of the resources. The Other content servers regroup 9 different Non-Origin domain web servers. Our website WebView13proposes a graphical representation of this kind of analysis.
4.3. Do websites secure connections ?
Compared to the previous studies [43,44,45] encryp-tion has been largely adopted to preserve privacy. Indeed, web browsers nowadays favor it by adding by default https:// when a user requests a web page. Furthermore, since Google marked non-HTTPS websites as insecure in its Chrome browser in July 2018, HTTPS adoption has increased. However, from our Top 10,000 Alexa websites, only 36.02% of the web-sites deliver their contents in full HTTPS (100% HTTPS) and still 0.28% of the websites deliver their contents in full HTTP (100% HTTP, no resource composing the web page is delivered by an HTTPS server). In between, we have websites composed of resources received with HTTPS and HTTP. As per Fig.5, on average, when the web page is lo-cated in North America, 12 resources are downloaded in HTTP and 70 resources in HTTPS and when the main web page is in Asia, 32 resources are downloaded in HTTP and 46 resources in HTTPS. While HTTP/2 and QUIC-enabled web servers mainly deliver contents in HTTPS through TLS 1.214, some content servers still deliver resources in a
non-secure mode (HTTP). Those websites are mainly located in Asia.
4.4. Which Internet protocol do I receive?
Since the previous published papers analysing Web brows-ing, the new Internet Protocols, namely HTTP/2 and QUIC, have been promoted. We then wanted to evaluate the adop-tion of these protocols by web servers. We made measure-ments explicitly requesting these protocols and analyzed if the remote servers reply using them or if they fall back to another one. Fig. 6 and Fig. 7 show the results of those measurements, in terms of protocol distribution.
First and very logically, we note that when requesting 13https://webview.orange.com/d/UyIIcrUmz
14Now TLS 1.3 is deployed but at the time of the measurements, it was
(a) Requesting HTTP/2 (b) Requesting QUIC (c) Requesting QUIC Repeat Figure 6: Received protocol distribution upon request
(a) Requesting HTTP/2 (b) Requesting QUIC (c) Requesting QUIC Repeat Figure 7: Average received protocol distribution
web pages with HTTP/1.1, all the servers reply with HTTP/1.1. When performing measurements requesting HTTP/2, we re-ceived all the resources in HTTP/2 (100% H2) only for 11.82% of the websites. The other 88.18% of the websites reply in an average protocol distribution of 52.04% HTTP/1.1, 46.75% HTTP/2 and 1.21% Server Push. We can then see that al-though standardized in 2015, HTTP/2 is not yet widely de-ployed and that it is not equivalent worldwide, more used for servers in NA or SA, whereas in Europe and Asia, HTTP/1.1 is still prevalent.
When performing tests requesting QUIC, we see that QUIC is not deployed by many servers, but mainly Google ones. On average 97% of the different QUIC-enabled web servers are Google servers replying in QUIC v.43 when using Google-Chrome v.6815and the other 3% are non-Google web servers
replying in QUIC v.37-38 when using Google-Chrome v.6316.
From our measurements, we analyze that 0% of the web-sites reply in full QUIC for all the resources (100% HQ) and that the responses are received at an average distribution of 6.12% QUIC, 50.57% HTTP/2, 42.1% HTTP/1.1 and 1.21% Server Push. QUIC responses are highest when the main web page is in North America (in particular from Google servers).
QUIC is natively used jointly with HTTP/2 for the first request, but offers a QUIC zero-RTT connection when con-necting to an already known website. We then evaluate if the distribution is different with the QUIC Repeat mode. In this configuration, 7.21% of the websites fully reply in QUIC (100% HQ). The rest of websites, 92.79%, reply in a distribu-15android.com(90.6% HQ), google.com (52.6% HQ) or youtube.com
(49.1% HQ)
16facenama.com(81% HQ), sarkariexam.com (57.4% HQ) or
digital-grant.ru(55% HQ)
Figure 8: Visible portion of website
tion of 12.71% QUIC, 45.11% HTTP/2, 41.09% HTTP/1.1 and 1.09% Server Push. We can then see that QUIC Repeat favors QUIC reply distribution, because the browser knows that the website can reply in QUIC.
To sum up this evaluation, HTTP/1.1 is still widely used by web servers, HTTP/2, although standardized in 2015, is deployed at a low pace, and QUIC is mainly used by Google web servers.
5. Factors impacting Web Browsing Quality
An indicator of end-users’ perceived quality when per-forming web browsing is the time needed to load a web page (entirely or certain parts of it). This section points out the different factors impacting (decreasing or increasing) these loading times.
(a) Requesting HTTP/1.1 (b) Requesting HTTP/2 (c) Requesting QUIC Repeat Figure 9: First Paint loading time
(a) Requesting HTTP/1.1 (b) Requesting HTTP/2 (c) Requesting QUIC Repeat Figure 10: TFVR loading time
5.1. Impact of the requested protocol
We present in this section the impact of the Internet Pro-tocol on the end-users’ quality, measured either by the FP, TFVR or PLT. The TFVR provides the loading time of the visible portion of the web page and is tightly linked to the end-user’s browser window size. Fig.8depicts the different visible portion of web sites (without scrolling the web page) upon different browser window sizes. For example, when the main web page is located in North America, with browser window size of 1920x1080, less than 50% of the measure-ments provide a visible portion less than 32.09%. The Page Load Time provides to an end-user the needed time to load the entire web page (visible and non visible parts).
The FP exposes the moment when a first pixel appears on an end-user’s browser screen. The FP involves the download and rendering of the main web page html source code and on average involves the download of 2 objects from 1 domain for 99.98% of all measurements. The only difference among the measurements is in general the size of the html page it-self, thus increasing the corresponding download time.
As shown in Fig.9a, we can see that the FP value is very close for HTTP/1.1, HTTP/2 and QUIC. This can be ex-plained since before FP, on average only 2 objects are down-loaded in this time and all the benefits of the HTTP/2 pro-tocol (multiplexing, header compression, server push
func-tion) can not happen. Similarly, for QUIC, since the first request is sent using HTTP/2 and the number of objects very small, 99.76% of QUIC measurements receive HTTP/2 replies. But one can see that the FP is smaller for the QUIC Re-peat mode, since in this case, resources are downloaded in 0-RTT from UDP-enabled web servers and in 1-RTT from TCP-enabled web servers. The First Paint value is a good indicator of the network state when performing web brows-ing since objects are mostly downloaded from the main web page domain itself thus decreasing the total DNS time.
Looking at Fig.10and Fig.11, we can see that the be-havior for the TFVR and PLT is close to the one detected with the FP measurement, i.e.; there is no noticeable dif-ference between HTTP/1.1, HTTP/2 and QUIC. Indeed, as depicted in Fig.7, when requesting HTTP/2, the HTTP/1.1 Internet protocol is still largely used. Similarly, with our dataset, when requesting QUIC, about 50% of the measure-ments have a QUIC distribution less than 0.79%, and those websites fall back to HTTP/2. But for the QUIC Repeat mode, the TFVR is largely smaller, thanks to 0-RTT UDP and 1-RTT TCP. For example, when comparing QUIC Re-peat versus HTTP/2, the TFVR loading time is reduced by 54.2% for a main web page in North America.
(a) Requesting HTTP/1.1 (b) Requesting HTTP/2 (c) Requesting QUIC Repeat Figure 11: PLT loading time
(a) Main web page in NA (b) Main web page in EU (c) Main web page in SA (d) Main web page in AS Figure 12: Impact of number of domains
(a) ADSL network access (b) Wi-Fi network access (c) Fiber network access Figure 13: PLT when requesting HTTP/1.1
5.2. Impact of the number of domains
When performing web browsing, the resources are down-loaded from various domains (as discussed in section 4.2, from Same-Origin and Non-Origin domains). The number of domains contacted increases proportionally to the DNS lookup times and thus the overall loading times (for the TFVR or PLT). When a web page is located in North America or Europe, on average, resources are downloaded from 9 do-mains (with an overall DNS time of 316.09 ms) and when the main web page is in South America, resources are down-loaded on average from 16 domains (with an overall DNS time of 1715.85 ms). In general websites being served by large number of domains belong to the News and Shopping category.
Fig.12illustrates the overall tendency regarding the number of domains through which resources are downloaded when requesting HTTP/2 and the corresponding loading time. This is represented as a heatmap where dark blue represents higher concentration of values and light blue lower concentration of values together with the corresponding Page Load Time. For instance, in Fig.12a, there are plenty of websites having about 7-8 domains and offering a PLT of about 1500 ms, and very few websites having 30 domains for a PLT at about 3000 ms. When a web page is located in North America or Eu-rope, the PLT loading time is good and time increases with the number of domains from which the resources are down-loaded. When the main web page is in Asia, the PLT loading time increases proportionally to the number of domains (av-erage of 3915 ms DNS time with the number of domains being 4) and the objects being mainly served in HTTP/1.1 increase blocking and waiting time.
5.3. Impact of ad blockers
Advertisement in web pages is nowadays naturally em-bedded and can decrease an end-user’s QoE, regarding the
overall loading time of a website. From our measurements, when using an ad blocker (Adblock Plus), on average, the number of downloaded resources is reduced by 11.02%. It is decreased by 9.72% when the main web page is in North America, by 8.43% in Europe, by 11.84% in South America and by 14.10% when the main web page is in Asia.
Websites belonging to the Shopping, Kids and Teens and
Gamescategories have the most significant decrease in the number of downloaded objects and the PLT for websites be-longing to these 3 categories are on average decreased by 39.96%. Regarding other website categories, blocked ob-jects are mainly characterized as social network contents (e.g
Facebook, Twitter, LinkedIn, etc.).
5.4. Impact of the network access
End-users may be served by different network service providers, along with different bandwidths and data commu-nication technologies (e.g ADSL, Wi-Fi, Fiber). Our mea-surements reflect observed web browsing quality where
𝐵𝑎𝑛𝑑𝑤𝑖𝑑𝑡ℎADSL< 𝐵𝑎𝑛𝑑𝑤𝑖𝑑𝑡ℎWi-Fi< 𝐵𝑎𝑛𝑑𝑤𝑖𝑑𝑡ℎFiber
The Fig.13depicts the observed PLT loading times when re-questing HTTP/1.1 following different network access. For example, when the main web page is in North America, less than 80% of the measurements have a PLT less than 6901 ms for ADSL network access, PLT less than 6000 ms for Wi-Fi network access and PLT less than 4000 ms for Fiber network access, thus representing a reduction of the loading time of 42.03% when shifting from ADSL to Fiber network access. When requesting the QUIC protocol, as shown in Fig.14, the end-user’s QoE increases proportionally to band-width increase, independently of the main web page conti-nent location. On average depending on the network access (ADSL vs Fiber), an end-user’s PLT is decreased by 30.25%.
(a) ADSL network access (b) Wi-Fi network access (c) Fiber network access Figure 14: PLT when requesting QUIC
Figure 15: Overall loading times
Increased end-user QoE is tightly linked to the corsponding network access and requested protocol. When re-questing HTTP/2 or QUIC, irrespective of the main web page location, web pages’ loading times are decreased on average by 19.73% from ADSL to Wi-Fi, 16.02% from Wi-Fi to Fiber and 30.25% from ADSL to Fiber.
5.5. Impact of main web page location
Fig.15depicts the overall web pages’ loading times, grouped by estimated continents location of the home page. The over-all centered (median) time follows the rule 𝐹 𝑃 < 𝑇 𝐹 𝑉 𝑅 <
𝑃 𝐿𝑇. Being in France when performing those measure-ments, we noticed that the overall loading times for a Euro-pean end-user are smaller for the websites located in North America and Europe than for those located in South Amer-ica and Asia. The 25𝑡ℎ percentile and75𝑡ℎ percentile are
denoted by 𝑄1 and 𝑄3.
When the main web page is located in North America, less than 50% of the measurements have a PLT less than 2962 ms, 𝑄1 and 𝑄3 are respectively at 1753 ms and 4868 ms. The parameters inducing the outliers are due to high num-ber of domains (mainly Non-origin), high amount of down-loaded objects and objects served over HTTP/1.1. The ex-treme outliers are for those objects downloaded from South America and Asia. When the main web page is located in South America and Asia, the observed times are higher in general but the number of outliers reduced since more re-sources are downloaded from the same continent of the main web page domain and the upper limit closer to the defined timeout for every measurement.
Figure 16: PLT for different websites’ categories
5.6. Impact of websites’ referenced categories
Websites are all different among them composed of a wide range and number of objects. Following their content, they are referenced as belonging to different types of cate-gories (e.g Alexa17, QuantCast [46] or Web Filter18). In our study, we make use of Alexa referenced category listing where websites are classified upon 17 different categories. The Fig. 16 shows the overall observed PLT for different categories. We can observe that the CDF is similar for many categories except for 2 of them (Adult and Education). For instance, for most categories, for 50% of our measurements, the observed PLT is about 2500-3000 ms. Websites belong-ing to the Computers, Reference and Shoppbelong-ing category have loading times being close among them (compared to web-sites belonging to the Recreation, Business and News cate-gory) mainly due to objects MIME types composing the web page. There is the biggest gap between the Adult andEduca-tioncategory. While for less than 75% of our measurements, websites belonging to the Adult category have a PLT less than 3054 ms, websites belonging to the Education category have a PLT less than 6816 ms. While these two categories download on average the same types of objects (mainly
im-agesand videos), from our analysis in section4.4and4.1, the main difference which results in a higher observed PLT is that objects for Adult categories are mainly downloaded
17https://www.alexa.com/topsites/category 18https://fortiguard.com/webfilter/categories
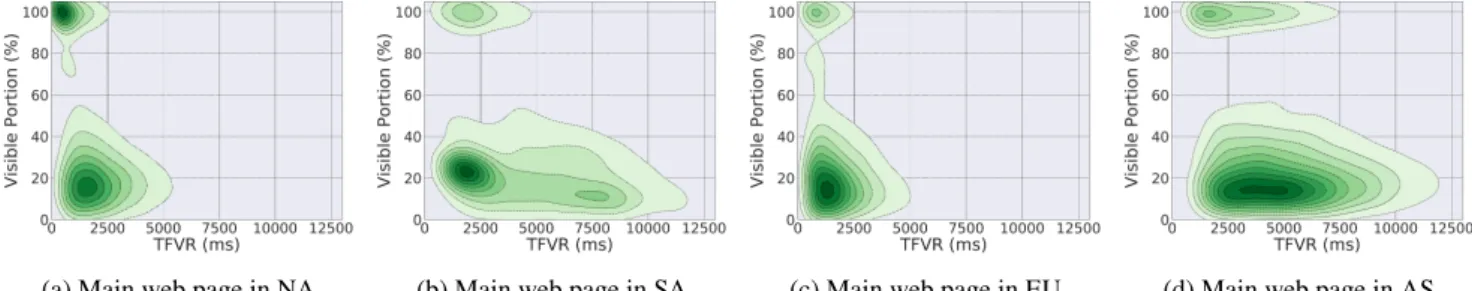
(a) Main web page in NA (b) Main web page in SA (c) Main web page in EU (d) Main web page in AS Figure 17: Impact of visible portion on TFVR
in HTTP/2 protocol (HTTP/1.1 for Education category) and that images and videos for the Education category are bigger in size.
We can then see that the category can play a role in the web browsing quality, but it is limited and less than the sizes of downloaded objects and the protocol through which they are downloaded which contribute most of the time to a higher PLT value.
5.7. Impact of visible portion on its corresponding
loading time
Our measurements have been performed following dif-ferent web browsers’ window sizes and the Fig.8has shown that depending on the main web page continent location and corresponding web browser window size, an end-user might have a larger overview of the web page without scrolling. We focus in this section on the impact of this visible portion on the time to load it. The default logical assumption would be that the time to load 𝜆 % of a web page would be pro-portional. The Fig. 17(Heatmap : Dark green represents higher concentration of values and light green lower con-centration of values together with the corresponding TFVR) depicts the concentration of websites following their visible portion (without scrolling the web page) and corresponding time to be loaded (TFVR). As discussed in section4.4, web-sites having their main web page in North America share the particularity of having higher visible portions (mainly
Search-Engines) and the Fig.17ashow that the correspond-ing TFVR ranges from 400 ms to 700 ms when the visible portion is 100% and ranges from 1200 ms to 1875 ms when the visible portion is between 11% and 20%. The Fig. 17d
depicts websites whose main web page is in Asia, where we can see that these web pages have a visible portion massively ranging from 13% to 17% with loading times between 2700 ms and 5000 ms (apart from a limited number of web pages having a visible portion of 100% and TFVR between 1815 ms and 2104 ms).
The TFVR is not proportional to the visible portion since different actors contribute to this loading time (type and num-ber of objects in the visible portion, the network download time, etc.).
5.8. Impact of time of day
Our measurements have been performed round the clock all day long, since following different times of the day a
web-Figure 18:Loading time of different websites at different times of the day
site might be visited by a larger number of end-users, and thus increasing the time needed for the servers to deliver different objects. Furthermore, the overall network state to reach the remote servers might be overloaded (e.g peak hours versus off-peak hours). We thus assess in this section the im-pact of the time of day on the perceived page load time. The Fig. 18depicts a set of websites’ loading times at different times of the day. While some websites’ loading time stay rel-atively the same all day long (e.g wikipedia.org), other web-sites depending on their category (thus content) may have their inner structure change several times per day (e.g News:
chinatimes.comor Entertainment: twitch.tv). Our measure-ments have been performed in Europe, and we can notice that the website chinatimes.com average PLT increases dras-tically at 04H CET (12H in Asia) and 08 CET (16H in Asia). We can thus suppose following these times of the day in Asia that the website has a higher visit rate in Asia, and an Euro-pean end-user experiences the side effects. In overall, we can notice that between 12H CET 14 CET or 20H CET -22H CET, the average loading times perceived by end-users also increase which is most of the time due to the network state.
Web pages loading times are impacted following differ-ent times of the day mainly due to their visit rate (web servers impacted) and network state (overloaded during peak hours).
Main HTML page size ✓ ✓ ✓ Size of objects ✓ ✓ Types of objects ✓ ✓ Visible Portion ✓ Number of domains ✓ ✓ Use of ad blocker ✓ ✓ Time of day ✓ ✓ ✓ Network access ✓ ✓ ✓ Table 1
Parameters influencing web browsing quality
The corresponding loading times might also fluctuate de-pending upon the website category since the number of down-loaded objects (and MIME type and size) might increase.
5.9. Which parameters can influence Web
Browsing quality?
Based on our statistical measurements analysis, the Ta-ble 1 represents the different parameters to be taken into consideration when investigating the FP (First Paint), TFVR (Time for Full Visual Rendering) and PLT (Page Load Time) loading times. As per our geographic location (Europe), main web pages located in South America and Asia bring higher loading times (compared to main web pages in North America and Europe). The network access and requested protocol are tightly linked to an increased quality. The num-ber, size and type of objects and the main HTML page size have a strong link with the website’s Alexa-referenced cate-gory listing (e.g Search Engine catecate-gory websites are com-posed of small number of objects of small size, News cate-gory websites are longer in scrollHeight, thus composed of many objects and served by a large number of domains, etc.). Finally, other factors like the time of day or the visible por-tion can have an impact on the quality but at a lower degree.
6. Machine Learning Techniques to predict
web browsing quality
With our statistical analysis, we are able to know the factors impacting the web browsing quality, but we can not manually identify the thresholds or the values leading to a good or a bad quality. For this, we have applied different Machine Learning techniques on our dataset, namely Clus-tering (and BiClusClus-tering), Covariance or Density estimation, Principal Component Analysis (PCA) and Decision Trees. As identified in the previous sections, the factors influenc-ing QoE are linked together and decision tree is revealed to be the most adequate non-parametric supervised learning method. In our study, decision tree rules are detected from 40% of the entire dataset that we denote by training dataset and the other 60% is used to validate the rules, denoted by
6.1. Decision Tree based on satisfaction degrees
Several studies regarding the MOS (Mean Opinion Score) during web browsing sessions [47,48,32,37] provide vis-ible web page loading times. Table2presents the different degrees of satisfaction based on end-user sociological per-ceived feelings [49] coupled to these MOS studies. Instantresponseindicates a high responsiveness from the visited web page, Seamless response indicates that the end-user is happy with the overall experience, Average response indi-cates that the end-user feels the delay for the web page to load acceptable, Critical response indicates that the end-user strongly feels the bad side effects of the long web page load-ing and Bad response indicates that the end-user is not happy at all and can give up the browsing.
Based on the time values mentioned for these satisfaction degrees and the values of the TFVR for our measurements, we hereafter expose the corresponding sets of rules obtained from Decision Trees applied to our training dataset for the 5 classes. The full obtained decision tree is represented by 184 different nodes.
Instant response. Our measurements do not have any TFVR loading time lower than 100 ms and make this class unnecessary.
Seamless response. 24.32% of the training dataset has a TFVR in this range and the main impacting factors for this classification are the main web page located in North Amer-ica or Europe, a low RTT value for the main web page, QUIC Repeat as requested protocol and a Fiber network access.
Average response. 30.67% of our training values belongs to this class and the main factors are the main web page lo-cated in North America or Europe, the requested Internet protocol being HTTP2, QUIC or QUIC Repeat, a Wi-Fi net-work access, the use of an ad blocker and RTT value between 18.65 ms and 101.5 ms.
Critical response. 43.78% of the training measurements have a TFVR in this class, impacted by the main web page located in Europe, South America or Asia, the visible por-tion between 22.76% and 41.39% (these web pages have a larger scroll height), the objects served by various content servers mainly located in Asia and Wi-Fi or ADSL as net-work access.
Bad response. 1.23% of the training dataset is classified as Bad response, mainly because of the use of Wi-Fi network access and HTTP/1.1 as requested protocol.
Once this decision tree has been built based on the
train-ing dataset, we evaluated it with the validation dataset. The Table3depicts the obtained classification confusion matrix, where the diagonal represents the percentage of measure-ments correctly predicted. We can see that 84.79% of the predictions are good, but more than 15% of the validation dataset is wrongly predicted. Looking at the matrix, the
val-User satisfaction degrees, based on [49]
Actual class Predicted
class Instant Seamless Average Critical Bad
Instant 0 0.15% 0 0 0 Seamless 0 22.21% 1.60% 0 0 Average 0 1.96% 29.01% 8.07% 0 Critical 0 0 0.04% 32.35% 0.01% Bad 0 0 0.02% 3.36% 1.22% Table 3
Classification confusion matrix of the validation dataset based on user satisfaction degrees
ues identified in Table2and the real TFVR values, we can say that the Instant Response class is unnecessary (no mea-surement in this class) and that the prediction error rate for the Critical response class is important (about 10%) because the loading time range is too wide.
6.2. Decision Tree based on estimated satisfaction
degrees from clustering
Having seen that the proposed classification of the sat-isfaction degrees from literature is not optimal for current Web Browsing experience, we decided to define a new one, based on our huge dataset of web browsing measurements on the top 10,000 Alexa web sites. We thus look for the best satisfaction degrees using clustering (K-Means) to identify the different classes. The KMeans algorithm divides a set of samples 𝑋 into 𝐾 disjoint clusters 𝐶, where each cluster is described by the mean 𝜇𝑗 of the different samples in the cluster itself. In order to determine the value 𝐾, we use the
Elbow methodwhere we assess the percentage of explained variance (ratio between-group variance to the total variance) as a function of the number of clusters. As seen in Fig.19, the value 5 seems to be the good Elbow Criterion, and us-ing it, we can identify the 5 clusters representus-ing the differ-ent satisfaction degrees, illustrated in Table4. The first and second satisfaction degrees from Table2have been merged into one degree and the Critical response satisfaction degree is distributed and split into two degrees. The estimated sat-isfaction degrees illustrated in Table4are more uniformly distributed, compared to Table2.
We hereafter describe the impacting factors leading to the classification of one measurement into one class, learned from our training dataset by the decision tree model, repre-sented by 176 different nodes.
Good response. 23.32% of the training dataset has a TFVR in this range and the main factors are the main web
Figure 19: Explained variance
Estimated satisfaction degrees Loading Times (ms) Good response < 1232 Fair response 1232 - 3486 Moderate response 3486 - 6715 Worse response 6715 - 9281 Poor response > 9281 Table 4
Estimated satisfaction degrees derived from our measurements
page located in North America or Europe, a low RTT and number of domains serving contents from North America or Europe, with replies delivered over the QUIC protocol.
Fair response. 27.31% of the training measurements are classified in this class and the main impacting factors are namely the main web page located in North America, a RTT value less than 105.5 ms, a Wi-Fi or Fiber network access, resources downloaded from North America, Europe or Asia in HTTPS, together with a low number of domains serving contents.
Moderate response. 31.26% of our training dataset leads to Moderate response, mainly based on the main web page located in Europe or Asia, the requested Internet protocol being HTTP/1.1, HTTP/2 or QUIC, the visible portion of the websites less than 13.25% and objects delivered from Asia or South America.
Worse response. 12.09% of the training dataset has a TFVR in this range with the main factors being the main web page located in South America or Asia, the number of downloaded resources between 45 and 85 (mainly down-loaded from Asia), RTT value greater than 185.5 ms and the number of domains from Asia greater than 4.
Poor response. 6.02% of the training measurements lead to a poor quality, mainly because of the main web page lo-cated in Asia, HTTP/1.1 used as requested protocol, a high number of downloaded objects and the use of an ADSL net-work access.
We evaluate the accuracy of our decision tree with the rest of our dataset (i.e., 60% of our measurements) and the Table5depicts the obtained classification confusion matrix when applying the obtained rules on this validation dataset. We can see, looking at the diagonal representing the percent-age of measurements correctly predicted, that our rules can efficiently predict 94.17% of the dataset. Only 5.83% of the
Worse 0 0 1.20% 11.63% 0.06%
Poor 0 0 0.02% 0.03% 5.96%
Table 5
Classification confusion matrix of the validation dataset based on estimated satisfaction degrees
Actual class Predicted
class Good Fair Moderate Worse Poor
Good 6.51% 0.16% 0 0 0 Fair 0.76% 21.09% 0.72% 0 0.02 Moderate 0.01% 1.96% 35.02% 0.12% 0.01% Worse 0 0 3.60% 17.74% 1.03% Poor 0 0 0 1.21% 10.04% Table 6
Classification confusion matrix to validate the accuracy of our rules-based model, based on estimated satisfaction degrees
less when compared to the rules-based model obtained in section6.1. We can then think that this model is better.
6.3. Accuracy of our rules-based model
In order to verify the correctness of the obtained decision tree from section6.2, we have performed in February 2019 measurements on the Alexa websites ranging from rank 10,000 to 15,000. The dataset sums up to the measurement of 4861 never-assessed before distinct websites, which represent 2.7 Million different measurements. The Table6illustrates the obtained classification confusion matrix for these measure-ments when applying our rules-based model.
Among our measurements, 6.51% of the measurements pro-vide a Good response (low RTT and small number of ob-jects), 21.09% for Fair response (low RTT and main web page in Europe), 35.02% for Moderate response (large num-ber of domains serving contents from Europe and Asia), 17.04% for Worse response and finally 10.04% of the measurements yield a Poor response (high HTTP/1.1 reply distribution and objects mainly delivered from South America and Asia). In short, 90.4% of the overall new dataset was correctly pre-dicted. This is a bit less than with the validation dataset, but it is related to websites which have never been accessed be-fore, in contrast to the validation dataset, composed of web-sites being also in the training dataset. We can then con-clude that our rules-based model can efficiently predict web browsing quality for any website for an end-user located in France.
We have presented in this paper the results of the analy-sis based on our measurements, performed by the probes in France (Europe). Our model has been proved to be correct for this configuration but it has to be adapted to other situa-tions, e.g., end-user in another location. Indeed, as seen in Fig. 1aand Fig. 2, when visiting different websites having
Table. 1, the impact of parameters to be re-assessed will be the Round-Trip-Time (network path taken through dif-ferent Asynchronous Systems), number and types of objects (mainly due to advertising), the number of domains (specif-ically the location of web servers delivering content), time of the day and corresponding network access (the through-put offered by network operators from different regions are different).
7. Conclusion and Future work
In this paper we have shown the importance of taking into account diverse parameters to better quantify and qual-ify web browsing. We have used all the web metrics iden-tified by the W3C or the research community and real on-market web browsers together with user-representative res-idential network access. Our study has brought light on the wide range of factors which can improve or decrease an end-user’s web browsing quality. The identified impacting fac-tors are then used as inputs to a rule-based model obtained from Decision Tree, in order to efficiently predict the web browsing quality.
Our measurements have been performed in France and an ongoing and future work is focused on performing measure-ments from different locations and using different network providers all around the world, to confirm the impacting fac-tors to be taken into consideration, to refine the estimated satisfaction degrees for end-users’ perceived web browsing quality and to validate our model. The obtained loading times contributing to the different estimated satisfaction de-grees will also be assessed through a MOS study with real end-users.
8. Acknowledgement
This work is partially funded by the French ANR Bot-tleNet project, No ANR-15-CE25-0013-001.
References
[1] Z. Abbassi, N. Hegde, L. Massoulié, Distributed content curation on the web, Sigmetrics Performance Evaluation Review (2014). [2] P. Snyder, L. Ansari, C. Taylor, C. Kanich, Browser feature usage on
the modern web, in: Proceedings of the 2016 ACM on Internet Mea-surement Conference, IMC 2016, Santa Monica, CA, USA, Novem-ber 14-16, 2016, 2016.
[3] Sandinve, The 2018 Global Internet Phenomena Report, 2018. URL: https://www.sandvine.com/hubfs/downloads/phenomena/ 2018-phenomena-report.pdf.
[4] M. Belshe, R. Peon, M. Thomson, Hypertext Transfer Proto-col Version 2 (HTTP/2), RFC 7540, RFC Editor, 2015. URL:
http://www.rfc-editor.org/rfc/rfc7540.txt,http://www.rfc-editor. org/rfc/rfc7540.txt.
[5] J. Iyengar, M. Thomson, QUIC: A UDP-Based Multiplexed and Se-cure Transport, Internet-Draft draft-ietf-quic-transport-15, Internet
[8] A. Saverimoutou, B. Mathieu, S. Vaton, Web browsing measure-ments: An above-the-fold browser-based technique, in: 38th IEEE International Conference on Distributed Computing Systems, ICDCS 2018, Vienna, Austria, July 2-6, 2018, 2018.
[9] C. Avram, K. Salem, B. Wong, Latency amplification: Characteriz-ing the impact of web page content on load times, in: 33rd IEEE In-ternational Symposium on Reliable Distributed Systems Workshops, SRDS Workshops 2014, Nara, Japan, October 6-9, 2014, 2014, pp. 20–25.
[10] M. Malloy, M. McNamara, A. Cahn, P. Barford, Ad blockers: Global prevalence and impact, in: Proceedings of the 2016 ACM on Inter-net Measurement Conference, IMC 2016, Santa Monica, CA, USA, November 14-16, 2016, 2016.
[11] B. C. Vattikonda, V. Dave, S. Guha, A. C. Snoeren, Empirical analysis of search advertising strategies, in: Proceedings of the 2015 ACM Internet Measurement Conference, IMC 2015, Tokyo, Japan, October 28-30, 2015, 2015.
[12] E. Pujol, O. Hohlfeld, A. Feldmann, Annoyed users: Ads and ad-block usage in the wild, in: Proceedings of the 2015 ACM Internet Measurement Conference, IMC 2015, Tokyo, Japan, October 28-30, 2015, 2015.
[13] G. Acar, M. Juárez, N. Nikiforakis, C. Díaz, S. F. Gürses, F. Piessens, B. Preneel, Fpdetective: dusting the web for fingerprinters, in: 2013 ACM SIGSAC Conference on Computer and Communications Secu-rity, CCS’13, Berlin, Germany, November 4-8, 2013, 2013, pp. 1129– 1140. doi:10.1145/2508859.2516674.
[14] S. Englehardt, A. Narayanan, Online tracking: A 1-million-site mea-surement and analysis, in: Proceedings of the 2016 ACM SIGSAC Conference on Computer and Communications Security, Vienna, Austria, October 24-28, 2016, 2016, pp. 1388–1401. doi:10.1145/ 2976749.2978313.
[15] J. R. Mayer, J. C. Mitchell, Third-party web tracking: Policy and technology, in: IEEE Symposium on Security and Privacy, SP 2012, 21-23 May 2012, San Francisco, California, USA, 2012, pp. 413–427. [16] T. Libert, Exposing the hidden web: An analysis of third-party HTTP
requests on 1 million websites, volume abs/1511.00619, 2015. [17] M. Lécuyer, G. Ducoffe, F. Lan, A. Papancea, T. Petsios, R. Spahn,
A. Chaintreau, R. Geambasu, Xray: Enhancing the web’s trans-parency with differential correlation, in: Proceedings of the 23rd USENIX Security Symposium, San Diego, CA, USA, August 20-22, 2014., 2014, pp. 49–64.
[18] A. Datta, M. C. Tschantz, A. Datta, Automated experiments on ad privacy settings, volume 2015, 2015, pp. 92–112.
[19] P. Wang, M. Varvello, A. Kuzmanovic, Kaleidoscope: A crowdsourc-ing testcrowdsourc-ing tool for web quality of experience, The 39th IEEE Interna-tional Conference on Distributed Computing Systems (ICDCS 2019) (2019).
[20] M. Seufert, N. Wehner, P. Casas, Studying the impact of HAS qoe factors on the standardized qoe model P.1203, in: 38th IEEE Interna-tional Conference on Distributed Computing Systems, ICDCS 2018, Vienna, Austria, July 2-6, 2018, 2018.
[21] A. Sackl, P. Casas, R. Schatz, L. Janowski, R. Irmer, Quantifying the impact of network bandwidth fluctuations and outages on web qoe, in: Seventh International Workshop on Quality of Multimedia Ex-perience, QoMEX 2015, Pilos, Messinia, Greece, May 26-29, 2015, 2015, pp. 1–6.
[22] S. Cook, B. Mathieu, P. Truong, I. Hamchaoui, QUIC: Better For What And For Whom?, in: Proceedings of IEEE International Con-ference on Communications (ICC), 2017.
[23] R. Lychev, S. Jero, A. Boldyreva, C. Nita-Rotaru, How Secure and
Conference, PAM 2018, Berlin, Germany, March 26-27, 2018, Pro-ceedings, 2018.
[26] A. M. Kakhki, S. Jero, D. R. Choffnes, C. Nita-Rotaru, A. Mislove, Taking a long look at QUIC: an approach for rigorous evaluation of rapidly evolving transport protocols, in: Proceedings of the 2017 In-ternet Measurement Conference, IMC 2017, London, United King-dom, November 1-3, 2017, 2017.
[27] P. Biswal, O. Gnawali, Does quic make the web faster?, in: 2016 IEEE Global Communications Conference (GLOBECOM), 2016, pp. 1–6. doi:10.1109/GLOCOM.2016.7841749.
[28] E. Pujol, P. Richter, B. Chandrasekaran, G. Smaragdakis, A. Feld-mann, B. M. Maggs, K. Ng, Back-office web traffic on the internet, in: Proceedings of the 2014 Internet Measurement Conference, IMC 2014, Vancouver, BC, Canada, November 5-7, 2014, 2014. [29] Y. Yang, L. Zhang, R. Maheshwari, Z. A. Kahn, D. Agarwal,
S. Dubey, Scout: A point of presence recommendation system using real user monitorusing data, in: Passive and Active Measurement -17th International Conference, PAM 2016, Heraklion, Greece, March 31 - April 1, 2016, 2016.
[30] R. Anwar, H. Niaz, D. R. Choffnes, Í. S. Cunha, P. Gill, E. Katz-Bassett, Investigating interdomain routing policies in the wild, in: Proceedings of the 2015 ACM Internet Measurement Conference, IMC 2015, Tokyo, Japan, October 28-30, 2015, 2015.
[31] U. Naseer, T. Benson, Inspectorgadget: Inferring network protocol configuration for web services, in: 38th IEEE International Confer-ence on Distributed Computing Systems, ICDCS 2018, Vienna, Aus-tria, July 2-6, 2018, 2018.
[32] E. Bocchi, L. D. Cicco, D. Rossi, Measuring the quality of experience of web users, Computer Communication Review (2016).
[33] C. Kelton, J. Ryoo, A. Balasubramanian, S. R. Das, Improving user perceived page load times using gaze, in: 14th USENIX Sympo-sium on Networked Systems Design and Implementation, NSDI 2017, Boston, MA, USA, March 27-29, 2017, 2017.
[34] M. Varvello, J. Blackburn, D. Naylor, K. Papagiannaki, EYEORG: A platform for crowdsourcing web quality of experience measurements, in: Proceedings of the 12th International on Conference on emerging Networking EXperiments and Technologies, CoNEXT 2016, Irvine, California, USA, December 12-15, 2016, 2016, pp. 399–412. [35] Q. Gao, P. Dey, P. Ahammad, Perceived performance of top retail
webpages in the wild: Insights from large-scale crowdsourcing of above-the-fold qoe, in: Proceedings of the 2017 Workshop on QoE-based Analysis and Management of Data Communication Networks, Internet-QoE@SIGCOMM 2017, Los Angeles, CA, USA, August 21, 2017, 2017.
[36] T. Enghardt, T. Zinner, A. Feldmann, Web performance pitfalls, in: D. Choffnes, M. Barcellos (Eds.), Passive and Active Measurement, Springer International Publishing, Cham, 2019, pp. 286–303. [37] D. N. D. Hora, A. S. Asrese, V. Christophides, R. Teixeira, D. Rossi,
Narrowing the gap between qos metrics and web qoe using above-the-fold metrics, in: Passive and Active Measurement - 19th International Conference, 2018.
[38] A. Saverimoutou, B. Mathieu, S. Vaton, Web view: Measuring and monitoring representative information on websites, in: IEEE In-ternational Workshop on Quality of Experience Management, QOE-MANAGEMENT Paris, France, February 18, 2019, 2019. [39] M. Butkiewicz, H. V. Madhyastha, V. Sekar, Characterizing web page
complexity and its impact, IEEE/ACM Trans. Netw. 22 (2014) 943– 956.
[40] M. Butkiewicz, H. V. Madhyastha, V. Sekar, Understanding website complexity: measurements, metrics, and implications, in:
Proceed-[42] F. Hernández-Campos, K. Jeffay, F. D. Smith, Tracking the evolution of web traffic: 1995-2003, in: 11th International Workshop on Mod-eling, Analysis, and Simulation of Computer and Telecommunication Systems (MASCOTS 2003), 12-15 October 2003, Orlando, FL, USA, 2003, pp. 16–25.
[43] A. P. Felt, R. Barnes, A. King, C. Palmer, C. Bentzel, P. Tabriz, Mea-suring HTTPS adoption on the web, in: 26th USENIX Security Sym-posium, USENIX Security 2017, Vancouver, BC, Canada, August 16-18, 2017., 2017, pp. 1323–1338.
[44] K. Krombholz, W. Mayer, M. Schmiedecker, E. R. Weippl, "i have no idea what i’m doing" - on the usability of deploying HTTPS, in: 26th USENIX Security Symposium, USENIX Security 2017, Vancouver, BC, Canada, August 16-18, 2017., 2017, pp. 1339–1356.
[45] G. Michaelson, M. Roughan, J. Tuke, M. P. Wand, R. Bush, Rigor-ous statistical analysis of HTTPS reachability, CoRR abs/1706.02813 (2017).
[46] S. Simpson, Interest Category Definitions, 2018. URL: https://help.quantcast.com/hc/en-us/articles/ 115014006128-Interest-Category-Definitions.
[47] T. Hobfeld, F. Metzger, D. Rossi, Speed index: Relating the industrial standard for user perceived web performance to web qoe, in: Tenth International Conference on Quality of Multimedia Experience, 2018. [48] E. Bocchi, L. D. Cicco, M. Mellia, D. Rossi, The web, the users, and the MOS: influence of HTTP/2 on user experience, in: Passive and Active Measurement - 18th International Conference, PAM 2017, Sydney, NSW, Australia, March 30-31, 2017, Proceedings, 2017. [49] J. Nielsen, Web response times, 2018. URL:https://www.nngroup.
com/articles/website-response-times/.
APPENDIX
preferredProtocol The requested protocol
addBlock The use (or not) of an adblocker netwIface The used network interface
(ADSL, Wi-Fi, Fiber)
timeDay Time measesurement performed browserWidth Width of the used browser browserHeight Height of the used browser
pingValue Round Trip Time upon main web page visiblePortion Visible portion of the web page at first
glance(no scrolling)
mainWWWLocation Main web page continent location h1Share HTTP/1.1 overall replies distribution h2Share HTTP/2 overall replies distribution hqShare QUIC overall replies distribution pushShare SERVER PUSH replies distribution nbRess Number of downloaded objects nbObjNA Number of objects downloaded from
North America
nbObjSA Number of objects downloaded from South America
nbObjEU Number of Objects downloaded from Europe
nbObjOrigin Number of objects downloaded from Same-Origin server
nbObjNonOrigin Number of objects downloaded from Non-Origin server
nbDomains Number of domains serving contents nbDomNA Number of domains in North America nbDomEU Number of domains in Europe nbDomAS Number of domains in Asia h1ShareBFP HTTP/1.1 replies distribution
before the First Paint h2ShareBFP HTTP/2 replies distribution
before the First Paint hqShareBFP QUIC replies distribution
before the First Paint pushShareBFP SERVER PUSH replies
distribution before the First Paint h1ShareBTFVR HTTP/1.1 replies distribution
before the TFVR
h2ShareBTFVR HTTP/2 replies distribution before the TFVR
hqShareBTFVR QUIC replies distribution before the TFVR
% Obj before FP Percentage of objects downloaded before FP
% Obj before TFVR Percentage of objects downloaded before TFVR
categoryType Website category referenced by Alexa Table 7