HAL Id: tel-01665163
https://tel.archives-ouvertes.fr/tel-01665163
Submitted on 15 Dec 2017HAL is a multi-disciplinary open access
archive for the deposit and dissemination of sci-entific research documents, whether they are pub-lished or not. The documents may come from teaching and research institutions in France or abroad, or from public or private research centers.
L’archive ouverte pluridisciplinaire HAL, est destinée au dépôt et à la diffusion de documents scientifiques de niveau recherche, publiés ou non, émanant des établissements d’enseignement et de recherche français ou étrangers, des laboratoires publics ou privés.
Process discovery, analysis and simulation of clinical
pathways using health-care data
Martin Prodel
To cite this version:
Martin Prodel. Process discovery, analysis and simulation of clinical pathways using health-care data. Other. Université de Lyon, 2017. English. �NNT : 2017LYSEM009�. �tel-01665163�
NNT : 2017LYSEM009
THÈSE
présentée par
Martin PRODEL
pour obtenir le grade de
Docteur de l’École Nationale Supérieure des Mines de Saint-Étienne
Spécialité : Génie Industriel
MODÉLISATION AUTOMATIQUE ET SIMULATION DE PARCOURS
DE SOINS À PARTIR DE BASES DE DONNÉES DE SANTÉ
soutenue à Saint-Etienne, le 10 avril 2017
Membres du jury
Président :
Farouk TOUMANI
Professeur, LIMOS, Clermont-Ferrand
Rapporteurs :
M. Andrea MATTA
Mme Maria DI MASCOLO
Professeur, Politecnico di Milano, Italie
Directrice de Recherche CNRS, Grenoble INP
Examinateurs :
M. Philippe LENCA
M. Farouk TOUMANI
Professeur, IMT Atlantique, campus de Brest
Professeur, LIMOS, Clermont-Ferrand
Directeur de thèse :
Co-directeur :
M. Xiaolan XIE
M. Vincent AUGUSTO
Professeur, Mines Saint-Etienne
Maître de Recherche, Mines Saint-Etienne
Invités :
M. Ludovic LAMARSALLE
M. Baptiste JOUANETON
Dirigeant, Pharm.D, MSc, HEVA, Lyon
MSc, HEVA, Lyon
ABSI Nabil CR Génie industriel CMP
AVRIL Stéphane PR2 Mécanique et ingénierie CIS
BALBO Flavien PR2 Informatique FAYOL
BASSEREAU Jean-François PR Sciences et génie des matériaux SMS
BATTAIA-GUSCHINSKAYA Olga CR Génie industriel FAYOL
BATTON-HUBERT Mireille PR2 Sciences et génie de l'environnement FAYOL
BERGER DOUCE Sandrine PR2 Sciences de gestion FAYOL
BIGOT Jean Pierre MR(DR2) Génie des Procédés SPIN
BILAL Essaid DR Sciences de la Terre SPIN
BLAYAC Sylvain MA(MDC) Microélectronique CMP
BOISSIER Olivier PR1 Informatique FAYOL
BONNEFOY Olivier MA(MDC) Génie des Procédés SPIN
BORBELY Andras MR(DR2) Sciences et génie des matériaux SMS
BOUCHER Xavier PR2 Génie Industriel FAYOL
BRODHAG Christian DR Sciences et génie de l'environnement FAYOL
BRUCHON Julien MA(MDC) Mécanique et ingénierie SMS
BURLAT Patrick PR1 Génie Industriel FAYOL
COURNIL Michel PR0 Génie des Procédés DIR
DAUZERE-PERES Stéphane PR1 Génie Industriel CMP
DEBAYLE Johan CR Image Vision Signal CIS
DELAFOSSE David PR0 Sciences et génie des matériaux SMS
DELORME Xavier MA(MDC) Génie industriel FAYOL
DESRAYAUD Christophe PR1 Mécanique et ingénierie SMS
DOLGUI Alexandre PR0 Génie Industriel FAYOL
DRAPIER Sylvain PR1 Mécanique et ingénierie SMS
FAVERGEON Loïc CR Génie des Procédés SPIN
FEILLET Dominique PR1 Génie Industriel CMP
FRACZKIEWICZ Anna DR Sciences et génie des matériaux SMS
GARCIA Daniel MR(DR2) Génie des Procédés SPIN
GAVET Yann MA(MDC) Image Vision Signal CIS
GERINGER Jean MA(MDC) Sciences et génie des matériaux CIS
GOEURIOT Dominique DR Sciences et génie des matériaux SMS
GONDRAN Natacha MA(MDC) Sciences et génie de l'environnement FAYOL
GRAILLOT Didier DR Sciences et génie de l'environnement SPIN
GROSSEAU Philippe DR Génie des Procédés SPIN
GRUY Frédéric PR1 Génie des Procédés SPIN
GUY Bernard DR Sciences de la Terre SPIN
HAN Woo-Suck MR Mécanique et ingénierie SMS
HERRI Jean Michel PR1 Génie des Procédés SPIN
KERMOUCHE Guillaume PR2 Mécanique et Ingénierie SMS
KLOCKER Helmut DR Sciences et génie des matériaux SMS
LAFOREST Valérie MR(DR2) Sciences et génie de l'environnement FAYOL
LERICHE Rodolphe CR Mécanique et ingénierie FAYOL
LI Jean-Michel Microélectronique CMP
MALLIARAS Georges PR1 Microélectronique CMP
MAURINE Philippe Ingénieur de recherche Microélectronique CMP
MOLIMARD Jérôme PR2 Mécanique et ingénierie CIS
MONTHEILLET Frank DR Sciences et génie des matériaux SMS
MOUTTE Jacques CR Génie des Procédés SPIN
NEUBERT Gilles PR Génie industriel FAYOL
NIKOLOVSKI Jean-Pierre Ingénieur de recherche CMP
NORTIER Patrice PR1 SPIN
OWENS Rosin MA(MDC) Microélectronique CMP
PICARD Gauthier MA(MDC) Informatique FAYOL
PIJOLAT Christophe PR0 Génie des Procédés SPIN
PIJOLAT Michèle PR1 Génie des Procédés SPIN
PINOLI Jean Charles PR0 Image Vision Signal CIS
POURCHEZ Jérémy MR Génie des Procédés CIS
ROBISSON Bruno Ingénieur de recherche Microélectronique CMP
ROUSSY Agnès MA(MDC) Génie industriel CMP
ROUSTANT Olivier MA(MDC) Mathématiques appliquées FAYOL
ROUX Christian PR Image Vision Signal CIS
STOLARZ Jacques CR Sciences et génie des matériaux SMS
TRIA Assia Ingénieur de recherche Microélectronique CMP
VALDIVIESO François PR2 Sciences et génie des matériaux SMS
VIRICELLE Jean Paul DR Génie des Procédés SPIN
WOLSKI Krzystof DR Sciences et génie des matériaux SMS
XIE Xiaolan PR1 Génie industriel CIS
YUGMA Gallian CR Génie industriel CMP
BERGHEAU Jean-Michel PU Mécanique et Ingénierie ENISE
BERTRAND Philippe MCF Génie des procédés ENISE
DUBUJET Philippe PU Mécanique et Ingénierie ENISE
FEULVARCH Eric MCF Mécanique et Ingénierie ENISE
FORTUNIER Roland PR Sciences et Génie des matériaux ENISE
GUSSAROV Andrey Enseignant contractuel Génie des procédés ENISE
HAMDI Hédi MCF Mécanique et Ingénierie ENISE
LYONNET Patrick PU Mécanique et Ingénierie ENISE
RECH Joël PU Mécanique et Ingénierie ENISE
SMUROV Igor PU Mécanique et Ingénierie ENISE
TOSCANO Rosario PU Mécanique et Ingénierie ENISE
ZAHOUANI Hassan PU Mécanique et Ingénierie ENISE
EMSE : Enseignants-chercheurs et chercheurs autorisés à diriger des thèses de doctorat (titulaires d’un doctorat d’État ou d’une HDR)
ENISE : Enseignants-chercheurs et chercheurs autorisés à diriger des thèses de doctorat (titulaires d’un doctorat d’État ou d’une HDR) Spécialités doctorales Responsables :
SCIENCES ET GENIE DES MATERIAUX K. Wolski Directeur de recherche MECANIQUE ET INGENIERIE S. Drapier, professeur GENIE DES PROCEDES F. Gruy, Maître de recherche SCIENCES DE LA TERRE B. Guy, Directeur de recherche SCIENCES ET GENIE DE L’ENVIRONNEMENT D. Graillot, Directeur de recherche
Spécialités doctorales Responsables
MATHEMATIQUES APPLIQUEES O. Roustant, Maître-assistant INFORMATIQUE O. Boissier, Professeur IMAGE, VISION, SIGNAL JC. Pinoli, Professeur GENIE INDUSTRIEL A. Dolgui, Professeur MICROELECTRONIQUE S. Dauzere Peres, Professeur
Mi se à jo ur : 29/ 06 /20 15
Acknowledgments
Je tiens tout d’abord `a remercier les membres de mon jury, dont M. Toumani pour avoir pr´esid´e ce jury, Mme Maria Di Mascolo et M. Andrea Matta pour avoir accept´e de rapporter cette th`ese avec rigueur, M. Philippe Lenca et M. Farouk Toumani pour leurs regards critiques sur ces travaux, ainsi que mes chers encadrants.
Je remercie grandement mon mentor intellectuel, le Prof. Xiaolan Xie, qui a endoss´e le rˆole de di-recteur de th`ese. Au-del`a de la grande confiance qu’il m’a accord´ee dans mon travail, ce sont surtout ses intuitions et sa rigueur scientifique qui m’ont montr´e la voie.
Je quitte le monde acad´emique pour remercier deux personnes sans qui rien n’aurait ´et´e possible (faute de financement tout simplement) : Alexandre Vainchtock et Ludovic Lamarsalle, les deux fondateurs vi-sionnaires de la soci´et´e HEVA. Je les remercie d’avoir cru en cette aventure depuis le d´ebut et d’avoir ´enorm´ement contribu´e, chacun bien `a sa faon, `a sa r´eussite. Je remercie ´egalement Baptiste Jouaneton pour m’avoir pris sous son aile et m’avoir tout appris sur les donn´ees PMSI (en plus du crawl `a nos heures per-dues). Enfin, j’ajoute une mention sp´eciale `a mes autres coll`egues d’HEVA pour la qualit´e de l’ambiance qui r`egne du lundi matin au vendredi soir.
Je remercie ´egalement les personnes de l’Ecole des Mines qui ont embarqu´e dans le mˆeme bateau de la recherche que moi : mes comp`eres doctorants d’I4S, notamment Sabri (en souvenirs des chants russes et de la cohabitation de bureau) et Thomas (pour le congr`es ensemble `a Londres); un immense merci `a Thierry pour des tonnes de choses (l’accueil dans une maison ferme , les footing interminables et les soir´ees ping); merci ´egalement `a cette formidable ´equipe de recherche pour les innombrables soir´ees d´ebats scientifiques jeux de plateaux, avec plus r´ecemment la participation de Raksmey. Enfin, merci `a Am´elie pour son extrˆeme gentillesse et son efficacit´e professionnelle dans tous nos ´echanges.
Le paragraphe que je d´edie maintenant est totalement disproportionn´e au regard des autres, mais il illustre tr`es justement l’importance du rˆole endoss´e au cours de ces 3 ans (voire 6 en tout si on remonte `a notre premi`ere rencontre), par Vincent. Merci de m’avoir tout appris pendant ma formation d’ing´enieur, mais aussi pour avoir r´eussi `a me donner le goˆut (tr`es dangereux) de la recherche. Vincent a su d´eployer un arsenal d’arguments pour me convaincre de d´emarrer cette th`ese. Et c’est en regardant l`a o`u nous en sommes arriv´es aujourd’hui que je peux affirmer, comme dirait Edith, que je ne regrette rien. Vincent a rempli son rˆole d’encadrant sur les aspects scientifiques et bien plus encore : nous avons appris ensemble, et malgr´e nous, `a ˆetre tenace dans l’adversit´e (Yedo et PG). Et surtout, nous avons conquis l’Am´erique ensemble avec notre article WSC 2016. En r´esum´e, je peux dire sans me tromper que nous avons gravi des montagnes ensemble!
4
Je n’oublie bien sˆur pas ma tr`es ch`ere famille, `a commencer par les St´ephanois, Yves et Florence, qui ont toujours ´et´e l`a quand j’ai eu besoin d’eux (notamment quand j’ai perdu mon toit pendant la derni`ere ann´ee de th`ese). Je remercie ´eternellement mes 2 parents pour tout, et plus particuli`erement pour leur envie insatiable de comprendre mon travail de th`ese. J’ajoute une mention sp´eciale `a ma sister, brillante pharmacienne en devenir, pour ne jamais avoir dout´e de moi. Je finis mes remerciements pour celle qui occupe toutes mes pens´ees, Marie. Tu as eu le courage de me suivre au bout du monde (Saint-H´eand, Saint-Etienne, Lyon, Chegaga) et de m’insuffler l’´energie n´ecessaire aux bons moments.
5
We rushed on actual gold in the 19th century, We drew out the black gold (oil) in the 20th century,
We realized the existence of a blue gold (water) at the dawn of the 21st century,
Let’s rush and tap into an ever-growing, uncolored and life-saving gold called health data1.
Table of contents
Remerciements 3 Introduction 15 Health-care systems . . . 15 Scientific objectives . . . 17 Thesis outline . . . 18Chapter 1 Literature review 19 1.1 Introduction . . . 20
1.2 Data-driven approaches in health-care . . . 20
1.2.1 Levels and types of health data . . . 21
1.2.2 Data mining in health-care . . . 22
1.3 Modeling and simulation in health-care . . . 24
1.3.1 Modeling of hospital services . . . 24
1.3.2 Real-time simulation . . . 25
1.4 Clinical pathway modeling . . . 25
1.4.1 Definition of a clinical pathway . . . 25
1.4.2 Clinical pathway modeling approaches . . . 26
1.5 Process Mining in health-care . . . 28
1.5.1 From the emergence to a widespread topic . . . 29
1.5.2 Limitations and perspective in process mining applied to health-care . . . 31
1.6 Summary . . . 32
Chapter 2 General methodology 35 2.1 Introduction . . . 36
2.2 Literature review . . . 36
2.3 The 8 proposed steps for an automatic study of processes . . . 38
2.3.1 The starting point: data . . . 38
2.3.2 Step 1: optimal process model discovery using process mining . . . 40
2.3.3 Steps 2, 3 and 4: decision point analysis . . . 41
2.3.4 Step 5: Statistical analysis . . . 44
2.3.5 Step 6: Model conversion procedure . . . 45
2.3.6 Step 7: Design of experiments settings . . . 46
2.3.7 Step 8: Simulation procedure . . . 46
2.4 Note to practitioners . . . 48
8 TABLE OF CONTENTS
Chapter 3 Optimal Process Mining 51
3.1 Introduction . . . 52
3.2 Literature review . . . 53
3.3 Basics of Process Mining . . . 55
3.3.1 Event logs . . . 55
3.3.2 Process model . . . 56
3.3.3 Quality metrics . . . 57
3.4 Problem description and mathematical formulation . . . 59
3.4.1 Mathematical formulation overview . . . 59
3.4.2 Hierarchical structure of the event classes . . . 60
3.5 A preliminary approach for optimal process discovery . . . 62
3.5.1 Optimization objectives . . . 62
3.5.2 Modeling hypotheses . . . 63
3.5.3 The integer linear programming model . . . 64
3.5.4 Numerical results . . . 65
3.5.5 Limitations of the ILP model . . . 67
3.6 New process model replayability scores . . . 67
3.6.1 Properties of the replayability score function . . . 68
3.6.2 New replayability score functions . . . 68
3.6.3 Properties of optimal solutions . . . 71
3.7 Optimization of process discovery . . . 72
3.7.1 Overview of the tabu search . . . 72
3.7.2 Initial solution . . . 73
3.7.3 Local moves . . . 73
3.7.4 Summary . . . 74
3.8 Computational experiments . . . 75
3.8.1 Log generation . . . 75
3.8.2 Preliminary analysis of the tabu search . . . 76
3.8.3 Comparison with the commercial software DISCO . . . 78
3.9 Conclusion and future research . . . 80
Chapter 4 Health-care Analytics 83 4.1 Introduction . . . 84
4.2 Literature review . . . 85
4.3 Decision point analysis . . . 88
4.3.1 Definition of the decision point problem . . . 88
4.3.2 The mismatch bias for the decision point problem . . . 89
4.4 Perfect traces generation and sequences alignment . . . 90
4.4.1 Perfect traces generation from a process model . . . 90
4.4.2 Sequence alignment for trace mimicry . . . 91
4.5 Classification models to solve the decision point problem . . . 95
4.5.1 Decision points as a classification problem . . . 96
4.5.2 Data preparation . . . 97
TABLE OF CONTENTS 9
4.5.4 Validation of classification models . . . 101
4.6 Statistical distributions from the event log . . . 102
4.6.1 Characterization of clinical pathway components . . . 102
4.6.2 Selection of the best fitting distribution . . . 102
4.7 Summary and future works . . . 103
4.7.1 Contributions . . . 104
4.7.2 Limitations . . . 105
4.7.3 Future works: medical decision aid . . . 106
Chapter 5 Simulation of clinical pathways 107 5.1 Introduction . . . 108
5.2 Literature review . . . 109
5.3 State chart definition and conversion framework . . . 111
5.3.1 State chart definition . . . 111
5.3.2 Conversion procedure . . . 113
5.4 Simulation setting up . . . 114
5.4.1 Simulation procedure . . . 115
5.4.2 Simulation output . . . 116
5.5 Validation of the simulation model . . . 118
5.5.1 Validation techniques . . . 119
5.5.2 Model validation and calibration . . . 120
5.5.3 Model validation with historical data . . . 121
5.5.4 Summary of model validation . . . 124
5.6 Sensitivity analysis . . . 124
5.6.1 Automatic selection of variables to evaluate . . . 125
5.6.2 Variation range of the variables . . . 127
5.6.3 Results of the sensitivity analysis . . . 129
5.6.4 Summary . . . 131
5.7 What-if scenarios evaluation . . . 131
5.8 Summary and perspectives . . . 132
5.8.1 Contributions . . . 132
5.8.2 Future works: further validation and a model of hospital services . . . 132
Chapter 6 Case study 135 6.1 Introduction to the French database of hospital claims . . . 136
6.1.1 Context of health data in France . . . 136
6.1.2 A national and medical information system database: the PMSI . . . 137
6.1.3 Example of studies using the PMSI data . . . 141
6.2 Cardiovascular diseases, arrhythmia and implantable cardioverter defibrillators . . . 143
6.2.1 General context . . . 144
6.2.2 Objectives . . . 146
6.2.3 Data extraction . . . 147
6.3 Process discovery . . . 153
10 TABLE OF CONTENTS
6.3.2 Process discovery and replayability formulas . . . 155
6.4 Process model enrichment . . . 156
6.4.1 Sequence alignment . . . 157
6.4.2 Analysis of the routing choices . . . 158
6.4.3 Time perspective . . . 160
6.5 Simulation of clinical pathways . . . 161
6.5.1 Model creation . . . 161
6.5.2 Model validation . . . 161
6.5.3 Sensitivity analysis . . . 162
6.5.4 Scenarios evaluation - new implantation strategies . . . 167
6.6 Conclusion . . . 170
Conclusion 171 Summary . . . 171
Future works . . . 171
Appendix Chapter A Machine Learning algorithms 173
Appendix Chapter B Student t-distribution table 175
Appendix Chapter C Validation techniques for simulation models 177
Appendix Chapter D Fields of the PMSI database 179
List of Figures
1.1 Illustration of a process model discovered from a health-care event log (Mans et al., 2015) 29
1.2 Overview of process mining in health-care (Rojas et al., 2016) . . . 30
2.1 The flow-chart methodology of this thesis: from data to performance indicators . . . 39
2.2 Illustration of a suitable database of events . . . 39
3.1 Example of a process model with 3 nodes and 4 arcs . . . 57
3.2 Hierarchical tree of event classes on health data, a node is a medical diagnosis. Medical specialties are split in 22 different chapters of the International Classification of Diseases. . 61
3.3 RP and OF of the optimal model depending on the model size, for different values of α and γ 66 3.4 Example of a process model with 5 nodes and 5 arcs . . . 71
3.5 Illustration of MoveNode: 4 steps to create a neighboring model . . . 74
3.6 Global methodology of our approach to solve the optimal process discovery problem . . . 75
3.7 Process models complexity versus event log complexity . . . 76
3.8 A process model of size 26 created by the log generator . . . 77
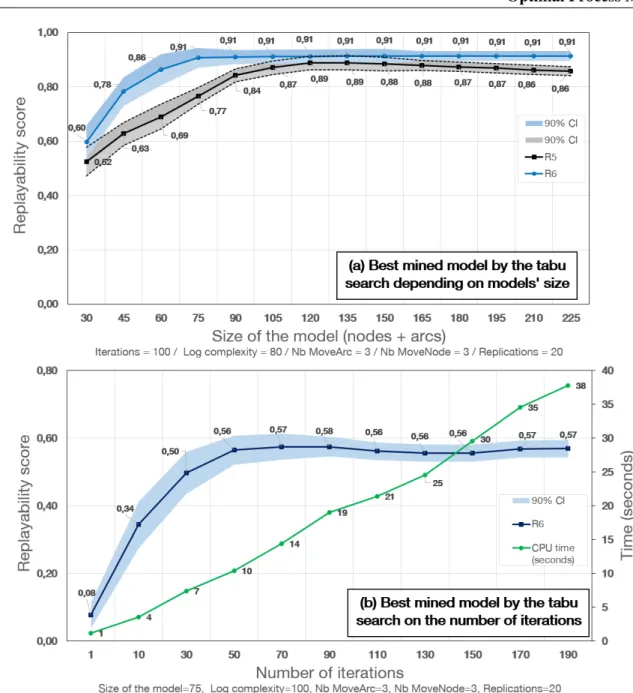
3.9 Replayability versus size of the mined model and number of iterations . . . 78
3.10 Models discovered by DISCO - 3 size of models . . . 81
3.11 Models discovered by our tabu search - 3 size of models . . . 82
4.1 The general approach of decision point analysis (Rozinat and van der Aalst, 2006b) . . . . 86
4.2 Imperfect matching between a log and a process model for decision point analysis . . . 90
4.3 Example of a hierarchical structure of health-care events . . . 93
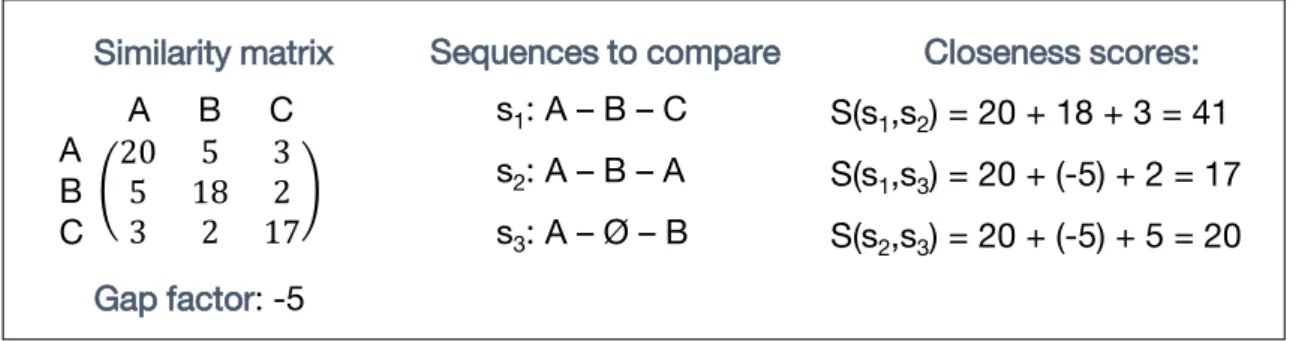
4.4 Example of closeness scores between two sequences of events . . . 93
4.5 Example of a ready-for-classification log for a single decision point . . . 97
4.6 Example of a decision tree learner’s output for the process model of Figure 4.5 . . . 99
4.7 Example of a distribution fitting for patient age . . . 104
5.1 Illustration of the first step of the conversion procedure on a simple process model (4 nodes, 5 edges) . . . 114
5.2 Graphical representation of a CPSC: care-states (blue), wait-states (orange) and transitions (black) . . . 114
5.3 Illustration of the second conversion step based on a simple event log (4 traces, 4 event classes) . . . 115
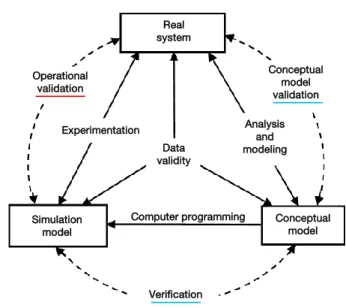
5.4 Simplified version of the modeling process and of the verification-validation process (Sar-gent, 2011) . . . 119
5.5 Schematic view of a simulation model calibration process . . . 120
12 LIST OF FIGURES
5.7 Example of shifting for a Weibull distribution . . . 128
5.8 Example of a tornado diagram for 8 input variables . . . 130
6.1 Analysis results of care sequences in lung cancer . . . 142
6.2 Comparison of metastatic status care sequences in lung cancer . . . 143
6.3 Illustration of Implantable Cardioverter Defibrillator (ICD)3 . . . 145
6.4 Number of implanted defibrillators in France from 1991 to 2015 and projections for up-coming years . . . 146
6.5 Distribution of the 3 types of implantable cardioverter defibrillators . . . 148
6.6 Hierarchical structure of heart failure codes in the ICD-10th) . . . 149
6.7 Graphical representation of individual clinical pathways after the labeling of stays . . . 150
6.8 Most of the variability (= number of classes) is due to a small number of stays. The 10% of the less frequent events are labeled by 79% of the classes (545). . . 152
6.9 Heart failure process model for a size threshold of 50 (arcs+nodes) . . . 154
6.10 Process modes vs replayability criterion on a fictitious log with 100 classes, 10 000 patients and 150 000 events . . . 156
6.11 Process models vs replayability criterion on a real data set with 169 classes, 1,602 patients and 19,431 events . . . 156
6.12 Computational behavior of the trace enhancement process (perfect trace generation and sequence alignment) on the event log of cohort 1’ . . . 157
6.13 Knowledge discovery with the explicit rules of decision trees . . . 160
6.14 Validation of the CPSC on KPI#4. States legend: 0 (implantation), 1 (end of record), 2 (I501a), 3 (I501b), 4 (death), 5 (I200), 6 (Z450), 7 (I420), 8 (Z098), 9 (I422), 10 (I251), 11 (I48-before), 13 (I472), 14 (I48-after), 25 (Z514), 57 (R570) . . . 163
6.15 Validation of the CPSC on KPI#5. States legend: 0 (implantation), 1 (end of record), 2 (I501a), 3 (I501b), 4 (death), 5 (I200), 6 (Z450), 7 (I420), 8 (Z098), 9 (I422), 10 (I251), 11 (I48-before), 13 (I472), 14 (I48-after), 25 (Z514), 57 (R570) . . . 164
6.16 Sensitivity analysis result - impact of 8 input variables on KPI-1 . . . 165
6.17 Sensitivity analysis result - impact of 8 input variables on KPI-4 (a) . . . 166
6.18 Sensitivity analysis result - impact of 8 input variables on KPI-4 (b) . . . 166
6.19 Sensitivity analysis result - impact of 8 input variables on KPI4 (c) . . . 167
6.20 (a) Clinical pathway state chart used in the heart failure case study (Anylogic software screenshots), (b) Care process triggered by certain care-state, (c) Table of the costs (based on http://www.aideaucodage.fr/ghm) . . . 168
6.21 Simulation results: measure of 2 KPI (cost and death rate) for different values of implanta-tion probability. Each simulaimplanta-tion was done with 40,000 patients. . . 170
List of Tables
1.1 The 4 levels of health data (Herland et al., 2014) . . . 21
1.2 Overview of the different natures of health-care data . . . 22
3.1 8 replayability functions with different properties . . . 69
3.2 Example of replayability values of the process model of Figure 3.4 on 7 traces . . . 71
3.3 Tabu search parameters . . . 77
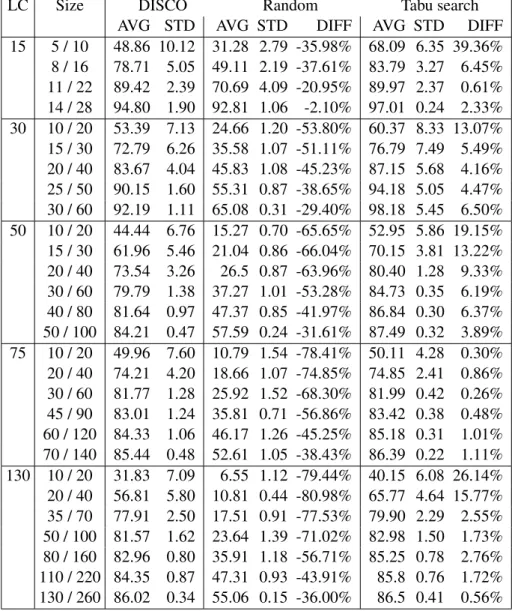
3.4 Replayability function R6of DISCO, a random approach and our tabu search . . . 79
4.1 The 5 main input parameters of a decision tree learner (CART algorithm of scikit-learn) . . 100
5.1 List of the variables independent of the case study . . . 125
5.2 The 3 different types of variables . . . 126
6.1 Number of distinct patients and hospital stays in the PMSI from 2006 to 2015 . . . 138
6.2 Codes of medical procedures related to ICD implantation in the French classification . . . 148
6.3 Data summary . . . 153
6.4 Performance results of 3 classifiers for 8 decision points of a clinical pathway . . . 159
6.5 Distribution fitting for the length of stay of each state of Figure 6.9 process model . . . 160
6.6 Starting and stopping probabilities of the Clinical Pathway State Chart . . . 161
6.7 Validation results for 5 measures (100,000 simulated patients) . . . 162
6.8 Simulation results for 3 KPI (cost, death rate and heart failure relapse) for different val-ues of implantation and replacement probabilities. Each simulation was done with 40,000 patients. . . 169
B.1 Student’s t-distribution for k degrees of freedom and quantiles of order 1 − α . . . 175
Introduction
Health-care systems
This section introduces the topics of health-care expenditures, the possible benefits of industrial engineer-ing, of clinical pathways and of health data.
Health expenditure and industrial engineering
Public health expenditures represent 5.99% of the world annual gross domestic product (World Health Organization, year 2014). Health-care is a major concern in most developed countries. It represents a tremendous part of the gross domestic product: 11.5% in France, 17.1% in the United States, 9.1% in the United Kingdom, 11.3% in Germany, 9.3% in Italy and 5.6% in China (WHO, year 2014). However, during the last two decades, hospitals have undergone major changes: faced with an increasingly severe socio-economic context, they had to comply with new management rules in order to minimize the costs while maintaining a certain quality of service. Although these two objectives are well-known antagonists, solutions exist.
Over the same past twenty years, the aim of scientific studies has been to bring substantial gains in terms of efficiency and productivity to health-care systems. It passes through the setting up of more efficient organizations, while improving the quality of care. The application of scientific methods from the field of Industrial Engineering is an excellent approach to achieve this objective. Industrial engineering techniques are widespread in many sectors, from manufacturing industry to service industries, and have shown their value in optimizing processes on many occasions. However, these approaches are challenging because, while industries and hospitals are similar in many respects, they differ in a number of crucial points: patients replace products and doctors take the role of machines. Difficulties related to the application of methods from the field of industrial engineering to a health-care environment are multiple:
• The analysis of a health-care system is closely linked to the observation and the modeling of patient flows, not products. It is difficult to predict a patient’s care pathway within a hospital system because it depends on multiple factors such as biological interactions, a pathology and a care management strategy.
• Activities of care providers are very diversified, which requires a high capacity to adapt to the de-mand: emergency is a recurring notion which is at the origin of most organizational problems. Fi-nally, health-care environments are highly stochastic (random processes are at work), making long-term planning more difficult.
• Health-care systems are made up of a multitude of subsystems (hospitals, general practitioners, phar-macy, etc.) that are generally compartmentalized and not well coordinated.
16 Introduction
Tremendous efforts and works have been carried out to cross the gap in that direction. Today, in 2017, the question of whether or not the scientific community can help health-care stakeholders to provide better care is no longer on the table. The question is to know how.
Clinical pathways
Currently, in health-care organizations, a major trend for the improvement of care quality while reducing costs is the design and implementation of Clinical Pathways. A clinical pathway (CP) can be defined as a structured and multidisciplinary care plan used to detail essential steps and timing in the care of patients with a specific clinical problem (Rotter et al., 2010). CPs are used as a tool for a standardization of clinical processes. They represent an opportunity to reduce variability in the delivery of cares. CPs usually involve many stakeholders (physicians, managers, nurses, pharmacists, specialists, etc.) because they rely on good coordination and communication of the care givers. The design and the implementation of CPs in practice require a level of standardization for medical treatment processes, the training and education of young medical professionals, the implementation of health information systems and the automated analysis for the purpose of process optimization. Then, it is possible to provide a model (i.e. a guideline) of a CP.
A second way to describe a CP is to adopt the patient’s point of view. A CP is the ordered sequence of medical events that happen to an individual patient. In that regard, each CP is unique and corresponds to a patient’s medical history. There exist different levels of description of a CP. The highest level is to consider that a CP starts the first time that a patient is taken care of and ends when he/she passes away (several years later). An intermediary level is the description of the steps occurring between the entrance in a hospital emergency room and the discharge (several hours to days later). A short-time view of a CP would be to identify the different phases of a surgery (a minute-by-minute process). We see here that there is no limitation in space, in time or in the concept that are included in a CP.
So far, most CP models have been designed by medical experts of each field. Hence, it heavily relies on experts’ opinions and on how they perceive their practices. The reality of what actually happens may differ from such references. The design of a CP is a major challenge to better understand the impact of treatments on the whole journey of the patient. Health authorities intend to propose standardization of care processes for various operational purposes: organization of care activities, assignment of human resources, reducing practice variability, minimizing delays in treatments or decreasing costs while maintaining quality. Today, there is a will to go further than experts’ opinions to answer these challenges. As such, evidence-based medicine has become paramount to medical decision making and clinical judgment. The current trend is to use electronic data as the new objective source for clinical pathway description.
Health data in the 21st century
During the last two decades, the amount of data collected in hospital information systems has increased exponentially. As other domains before it, health-care has been struck by computerization. Still, new technologies are generally slow to spread in health-care systems, which explains why computerization remains an ongoing process, especially in community medicine (outside hospitals). Hospitals are the most advanced organizations regarding the collection and the storage of health data. Over several countries, many hospitals are reporting databases containing the individual data of millions of patients. However, hospitals are now facing the need for strong analytic skills to take advantage of these massive data.
For a long time, health data have been considered too sensitive to be extensively shared and analyzed. Indeed, health databases contain critical information about each ill person and are considered as personal
17
data (they belong to the patient). The most advanced “anonymization” algorithms have been deployed to hide personal information from health database, so that they could be used for research purposes. The 2016 French law about the “modernization of the French health system” is a national initiative which illustrates the ongoing trend toward an opening of health data. A responsible use of health data represents a big opportunity to improve health-care systems. The large amount of data collected in hospital information systems is valuable because it may reveal important patterns of clinical pathways, allowing the creation of realistic models.
Scientific objectives
The main objective of this thesis is to develop a complete methodology, based on mathematical models, to automatically create clinical pathway models from large health databases. The resulting models can be used as new references of what actually happened. They provide the ground foundations for a better knowledge of health processes and allow for the identification of promising improvements. The strength of such clinical pathway models comes from the use of databases containing a large number of patient data. They can successfully be used to answer domain-specific questions. More specifically, our main objective can be split up in 4 sub-objectives:
1. Developing an optimal process discovery algorithm capable of dealing with variable and het-erogeneous data: the discovered clinical pathway models must balance two opposing criteria, being as small as possible (low complexity) and as much representative as possible (high quality). The pro-posed approach will show the benefits of combining combinatorial optimization and process mining techniques.
2. Proposing a health-care analytic toolbox to address 3 specific problems related to clinical path-way modeling: decision point analysis, definition of a similarity score for two events and a 2-sequence global alignment method. A clinical pathway is made of choices which depend on each patient’s condition and medical history. Classic probabilistic models are not sufficient to discover such complex patterns and interactions. We combine a sequence alignment method with a data min-ing algorithm to perform that task.
3. Solving domain-related questions with an actionable model of clinical pathway. We propose a new class of state chart to convert a static model of clinical pathways into a simulation model. It enables the evaluation of new care management scenarios.
4. Proposing a methodological framework capable of performing the above mentioned points automatically (apart from the initial data preparation, no hand-made interventions are needed). This guarantees the re-use of the approach on any disease case study and with new data sources.
18 Introduction
Thesis outline
This thesis is made up of 6 chapters.
Chapter 1 provides a broad review of the literature on the modeling and simulation of health-care systems over the past decade. A focus is made on data-driven approaches, especially process mining. This state of the art is crucial as it allows us to identify the unsolved challenges related to health-care environments and data, which we intend to answer through this thesis.
Chapter 2 presents the methodological flow-chart of this thesis. It explains how we automatically turn raw data from a database of events into a simulation model in a step-by-step approach. For each step, we describe the required inputs, the scientific challenges, our proposal to address these challenges and the generated outputs. Finally, the originality and the scientific contributions of the present thesis are introduced.
Chapter 3 addresses the problem of process discovery from large and complex event logs. It includes a mathematical programming model based on a novel hierarchical structuration of the event logs. Desired properties of an optimal process model are described. A combination of Monte-Carlo optimization and tabu search is proposed to overcome the complexity related to the huge size of event logs and the combinatorial solution space. Numerical results show that our approach performs better than state-of-the-art approaches. Chapter 4 addresses the problem of enriching a process model which represents a clinical pathway. We specifically focus on the study of two perspectives: the decision point analysis and the time perspective. The decision point problem aims at finding relations between data attributes and the routing choices in the process. We present the challenge that we face when using a noisy and heterogeneous log, such as health data, and we develop a solution.
Chapter 5 presents the final methodological step to automatically create simulation models of clinical pathways. We introduce an automatic procedure to convert a process model, discovered with process mining, into a simulation model. We propose a new subclass of state charts, called “Clinical Pathway State Chart”, with the required properties to simulate a cohort of patients while taking into account the pathways discovered using process mining techniques presented in Chapter 3 and the features found using the health analytics toolbox presented in Chapter 4. The clinical pathway simulation model is used to perform sensitivity analyses and what-if scenario evaluations.
Chapter 6 presents a comprehensive case study to illustrate the practical use of the approaches intro-duced in the previous chapters. The French national database of the hospital records from 2006 to 2015 is used as an event log. It contains the hospital records of several millions patients. The case study focuses on the clinical pathway of patients with cardiovascular diseases. This illustrates the benefit of the method for medical decision aid.
Chapter 1
Literature review
Contents1.1 Introduction . . . 20
1.2 Data-driven approaches in health-care . . . 20
1.2.1 Levels and types of health data . . . 21
1.2.2 Data mining in health-care . . . 22
1.3 Modeling and simulation in health-care . . . 24
1.3.1 Modeling of hospital services . . . 24
1.3.2 Real-time simulation . . . 25
1.4 Clinical pathway modeling . . . 25
1.4.1 Definition of a clinical pathway . . . 25
1.4.2 Clinical pathway modeling approaches . . . 26
1.5 Process Mining in health-care . . . 28
1.5.1 From the emergence to a widespread topic . . . 29
1.5.2 Limitations and perspective in process mining applied to health-care . . . 31
1.6 Summary . . . 32
Abstract
In this chapter, we present a broad literature review on the topic of health-care data analysis. After a discussion on existing data-driven approaches, such as statistical analyses and data mining techniques, we describe existing works on the topic of modeling and simulation in health-care. Then, we specifically focus on the case of clinical pathway modeling. We compare existing definitions and scopes of clinical pathways, and we present existing modeling techniques. Among them, process mining stands out as a dedicated field for process discovery and analysis. We discuss the limitations of existing works and the remaining challenges to address.
20 Literature review
1.1
Introduction
Nowadays, the scientific research applied to the health-care sector is an ever-growing field. Researchers from a variety of domains (Operational Research, Industrial Engineering, Business Process Management, Data Analytics, Artificial Intelligence, Computer Science, etc.) have found a tremendous interest in apply-ing their approaches to improve health-care systems. Confronted with a difficult socio-economic context, many hospitals around the world must comply to new regulations and new management rules to balance their financial situation. In each scientific discipline, new applied case studies arise in the field of health-care. The inherent nature of health-care is to be more diverse and heterogeneous than other sectors where processes are carefully mastered and controlled. This forced researchers to develop new methods which are more flexible to incorporate human-related behaviors. Health-care is human centered at every level: the care process is dedicated to a patient who is diagnosed by a doctor, taken care by a nurse, supplied by a pharmacist and operated by a surgeon. Each patient is unique (compared to manufactured goods), which makes generic models more difficult to build. For those reasons, health-care has become a dedicated field of research.
The application of theoretical models on real-life cases requires to know how the actual system works. Models need data to be applied and tested. Yet, in their work, researchers often suffer from the lack of real data to fuel their models. Samples are often too small or the data quality is too poor. It is a large consensus of the research community that the access to reliable data has been the number one challenge for the practical application of their models, no matter how efficient they may be. This is changing. While the interest of health-care practitioners for scientific methods, capable of lastingly improving health-care systems, increased, digital technologies have grown. The perpetual modernization of facilities, in particular through computerization and implementation of information systems, generates large amounts of data on all care activities. Health-care systems, and hospitals in front line, have invested significant resources (human and material) to be able to collect, store and re-use data related to their activity. This now makes it possible to collect amounts of data that exceed the analytic capacity of the care providers. They no longer have the skills nor the means to take full advantage of this mass of information. This makes the contribution of researchers all the more important, and this has given rise to a paradigm shift: data are no longer used solely as a tool for validating pre-existing models, they become themselves the creative source of new models. Such methods are called data-driven approaches. The idea is to investigate existing data sources to create new added value. In the following, we present existing works related to such data-driven approaches in health-care and the ongoing research on modeling and simulation applied to health-care systems. Then, we specifically focus on the problem of clinical pathway modeling, including the contribution of process mining.
1.2
Data-driven approaches in health-care
A data-driven approach is a general work methodology where the starting point is available data. Then, a set of methods and techniques is implemented to use this data in order to answer a problem. These data-driven approaches all assume the same hypothesis: data indeed contain the answer (or elements of the answer) to this problem. Then, the challenge is to develop the means to find it. In health-care, data-driven approaches cover a broad spectrum of possibilities, depending on the type of available data and the question to solve.
The recent literature review of (Vuokko et al., 2017) presents the impact of structuring electronic health record for secondary use of patient data. The primary use of data is to provide physicians and nurses
1.2 Data-driven approaches in health-care 21
with real-time information about the patient who is being taken care of. Secondary use of patient data is dedicated to an a posteriori analysis of the data for various purposes (statistics, decision support, resource management and reimbursement). Through the review of 85 articles, (Vuokko et al., 2017) presents the challenges of recording data in a structured manner and how it drastically improves the quality of secondary use studies. This work illustrates the ongoing interest of health practitioners and researchers to think of the final utilization when building health databases.
1.2.1 Levels and types of health data
Health data can be categorized according to the level of description they provide. (Herland et al., 2014) proposes 4 levels of detail: molecular level, tissue level, patient level and population level. Depending on the level, the nature of data, the analytic techniques and the pursued objectives are not the same. Ge-nomics, proteomics and bioinformatics are the field dedicated to the analysis of genes, molecules and DNA (Table 1.1). In this thesis, we consider patient level data.
Table 1.1: The 4 levels of health data (Herland et al., 2014)
At the patient level data, we identified 4 types of health data that are commonly used for data-driven analyses.
• Data directly related to a patient (diagnoses, administrative information, characteristics) • Data related the care activity (medication, surgeries, medical imaging, biology tests, etc.) • Data related to a care event (date, duration, severity, cost, outcome, etc.)
• Data related to the organization (appointments, human and material resources, number of beds, work schedule, etc.)
22 Literature review
These data come from various sources and can take different forms: structured database (electronic patient files, claim systems) or unstructured data. Examples of unstructured health data are texts (medical report), images (radiography) and signals (electrocardiogram, times series). Table 1.2 categorizes existing literature of data-driven approaches depending on the nature of the data at stake. Here, we especially focus on structured data, which is the most widespread source of data. Examples of works on text data, images and signals are given but are not exhaustive.
Table 1.2: Overview of the different natures of health-care data Nature of data References in health-care
Structured data (Lee et al., 2011; Hess et al., 2012; Vuokko et al., 2017; Lin et al., 2001; Cote and Stein, 2007; Adeyemi et al., 2013; Huang et al., 2012; Zolfaghar et al., 2013; Arslan et al., 2016; Huang et al., 2012; Shahin et al., 2014; Adeyemi et al., 2009)
Text (Raja et al., 2008; Corley et al., 2010; Culotta, 2010)
Images (Celebi et al., 2005; Xie et al., 2006; Rajendran and Madheswaran, 2010)
Signals (Padoy et al., 2008; Bouarfa et al., 2011; Kusiak et al., 2005)
The most predominant sources of health data are Electronic Medical Records (EMR). They represent a broad type of data that are collected and stored during health-care activities. For a given patient, the EMR is an unique source of information about his/her medical history (diagnoses, imaging, medication, etc.). It provides nurses and doctors with all the relevant pieces of information required to take care of the patient. EMR essentially contains patient data and care activity data. Such data can be used for a variety of purposes. It can be used for the development of diagnosis aid tools. (Hess et al., 2012) developed a data mining technique to take advantage of the electronic medical records of 91 patients to help in the diagnosis of ovarian cancer. Historical data enable the creation of a decision tree which emphasizes the optimal strategies for an accurate diagnosis. In (Zolfaghar et al., 2013), the hospital encounters of 6,739 patients during 1 year are used to assess the re-hospitalization risk within a month. Reducing re-hospitalizations is a relevant strategy to reduce cost and improve the quality of care. A k-mean clustering method was developed to determine the patient features that most impact such a risk.
Data related to the organization of health-care systems are of major interest for Operation Research approaches (Rais and Viana, 2011). It can be used for optimal patient scheduling, logistic problem, fore-casting, decision aid support, resource allocation and capacity planning. In that context, data are used to validate, test and improve the quality of the proposed models.
Data collected from sensors can also be of interest (Padoy et al., 2008). In (Bouarfa et al., 2011), a framework is introduced to recognize surgical tasks from data collected on surgical tool sensors. A hidden Markov model is used to represent the different steps of the surgery and the possible transitions. Preliminary results on a data set of ten surgical procedures show that it is possible to recognize surgical tasks with high detection accuracy. Ultimately, such a model could be used to detect deviations from guidelines or to determine the optimal location of resources in the operating room depending on the surgery duration.
1.2.2 Data mining in health-care
The most dedicated field for data-driven analysis is Data Mining. Data mining is a general analytic ap-proach whose objective is to discover patterns in large data sets. It uses methods from the fields of artificial
1.2 Data-driven approaches in health-care 23
intelligence, computer science and statistics. The objective is to discover new information from data, whereas in traditional statistics data are used to validate pre-conceived hypotheses about possible relations. In health-care, clinical research heavily relies on clinical trials, which are experiments in a controlled and limited environment. It often results in small samples of patients (few hundreds), but with very detailed clinical pictures. The objective is then to find statistical differences among different groups of patients. The idea of using data mining is different. The focus is on large-scale databases, which is at least a sin-gle hospital, and sometimes an entire country health system. Data mining can be used in two manners: supervised learning (historical data show the value of the variable to explain) and unsupervised learning (no examples of the target variable exist). The first category refers to predictive models (classification, regression) whereas the second refers to descriptive models (clustering, association).
Literature reviews
Several literature reviews on the topic of data mining applied to health-care can be found (Yoo et al., 2012; Niaksu et al., 2014; Herland et al., 2014; Das et al., 2015). They provide a complete landscape of this topic’s different facets. (Das et al., 2015) specifically focuses its review on real-life applications related to the Indian health system. The lecture of (Yoo et al., 2012) is highly recommended to get an extensive understanding of the contributions, the challenges and the techniques of data mining in health-care. The following topics are discussed.
• General definition of data mining and differences with statistics • How data mining in health-care differs from other domains
• Theoretical aspects of existing data mining algorithms (for classification, clustering and association) • Practical guidelines for real-life application of data mining algorithms in health-care
• Description and categorization of existing works by types of application
(Jothi et al., 2015) reports the literature review of 50 articles related to the “application of data mining techniques in health-care”. They highlight the massive interest of existing works for classification tasks. The most representative health-care application of classification is to determine the diagnosis of a patient based on his/her symptoms. In that context, data mining models are decision aid tools.
Perspective of data mining in health-care
Several conclusions can be drawn from these works: first, data mining in health-care is not new. It has been widely applied since the emergence of health databases and sufficient computational power. Data mining is capable of answering key questions through new descriptive and predictive models. Examples of successfully applied data mining are numerous, such as the prediction of undesirable medical events (prediction of patient falls with artificial neural network (Lee et al., 2011), prediction of ischemic strokes with 3 data mining algorithms (Arslan et al., 2016)) or the classification of patients (grouping patients with random forest in one of 4 risk levels of starting a disease (Shahin et al., 2014)). Specific applications also intend to find correlations in the events of medical history. In Huang et al. (2012), the medical records of 9,862 patients were extracted from a hospital information system (HIS) to find correlations between the presence of certain diseases and hypertension. All the input variables, as the target to predict, were defined as binaries (presence/absence). Naive Bayesian and J48 classifiers were implemented to create the predictive model. The results show the difficulties of predicting unbalanced classes (rare events, there are much fewer patients with hypertension compared to patients without).
24 Literature review
Still, several challenges of using data mining in health-care remain: the configuration of data mining al-gorithms requires dedicated skills and cannot be performed by end users such as doctors. This is especially true as most data mining algorithms are parameter sensitive. Second, the predictive model accuracy might not be high enough to be used in a clinical environment. It is sometimes due to the quality of the collected data (missing values), or to the originally intended purposes of the data collection (financial purposes, but not clinical studies). In addition, all the predictive factors of a disease might not even be known. A last challenge of health data is the presence of extremely imbalanced classes (the studied group is much smaller than the reference group) (Khalilia et al., 2011). For instance, there are much fewer patients who develop a nosocomial infection compared to the population of hospitalized patients. Standard algorithms struggle to build outstanding models, especially in comparison to a dummy “most-frequent” classifier which gets high accuracy. Imbalanced classes shows the need for several performance criterion and for suitable mining algorithms.
It makes data mining applied to health-care an interesting ongoing research area where the current focus is much more application oriented (getting appropriate data, automated analysis, auto-tuning algorithm) than purely theoretical (from the algorithmic point of view). The search for performance improvement of predictive models is not in new algorithms that would bring a 0.01% improvement in accuracy. Instead, it is the combination of methods from different fields (Operation Research, Data Mining, Computer Science, Bio-Informatics) which appears the most promising (Corne et al., 2012; Gomes et al., 2012; Carrizosa and Romero Morales, 2013).
1.3
Modeling and simulation in health-care
Discrete Event Simulation (DES) has been widely used in the literature for modeling health-care systems for various purposes: performance evaluation, optimization, demand forecast, etc. Several literature re-views (Jun et al., 1999; Fone et al., 2003; Augusto and Xie, 2006; G¨unal and Pidd, 2010; Khudyakov et al., 2014) are strongly indicated to get a complete landscape of the scientific contributions using such methods. Taking a look at the DES related literature from the past twenty years, most of the modeling effort has been at a micro level and related to specific aspects of the hospital, such as emergency departments, operating theaters, outpatient departments, inpatient wards, and intensive care units. Indeed, most simulation studies may be classified depending on the case study, which is often a hospital service.
1.3.1 Modeling of hospital services
Emergency department seems the most popular area for simulation modeling in health-care: such system contains highly stochastic yet easily observable processes (Centeno et al., 2001; Miller et al., 2003; Glaa et al., 2006). Although a lot of articles describe specific yet complex models to achieve realistic results (Takakuwa and Shiozaki, 2004; Duguay and Chetouane, 2007), some studies propose generic models sup-posed to be transferred to other hospitals (Sinreich and Marmor, 2004). Simulation has also been used to propose control strategies for emergency services taking into account costs (Prodel et al., 2014) or patient satisfaction (Pehlivan et al., 2013a). Inpatient facilities have also been extensively studied using DES; most observed objectives within this topic are staffed beds capacity sizing (Wiinamaki and Dronzek, 2003; El-Darzi et al., 1998), length of stay minimization (Vasilakis and Marshall, 2005) and patient flow modeling (Augusto and Xie, 2009b). Outpatient facilities and services are a subject of growing interest since hospital managers push for the increase of ambulatory surgery, which is cost effective. Outpatient clinics case
stud-1.4 Clinical pathway modeling 25
ies are frequent (Wijewickrama and Takakuwa, 2005; Takakuwa and Katagiri, 2007), providing guidelines for patient flow management. Ambulatory surgery is also a hot topic, where DES provides optimal sizing of ambulatory services connected to the operating theater (Ramis et al., 2001; Ferrin et al., 2004).
Other hospital services such as operating theater (M’Hallah and Al-Roomi, 2014), pharmacy depart-ment (Augusto and Xie, 2009a), and geriatric services organization (Franck et al., 2015) have also been studied using simulation. Finally DES has also been used for multi-services clinics and whole hospital monitoring and performance evaluation (Moreno et al., 1998). Modeling and simulation frameworks have also been proposed (Augusto and Xie, 2014). DES has also been used for performance evaluation related to the usage of health-care information systems in cancer patient pathway (Augusto et al., 2015), including a micro costing model for cost analysis. High scale formal models are also proposed to represent the global pathway of patients including health-care structures outside of the hospital (Hamana et al., 2015). To the best of our knowledge, DES has been extensively used for hospital services and patient pathway on the short term, but was never used for patient pathway global modeling. Isolated initiatives propose mixed agent-based-discrete-event simulation models for specific diseases such as Chronic Obstructive Pulmonary Disease (Charfeddine and Montreuil, 2010). Recent initiatives have also been proposed for the perinatal application (Pehlivan, 2014).
1.3.2 Real-time simulation
The issue of simulation models being single use because they cannot constantly adapt to the ever chang-ing nature of the actual system was addressed in a way by the definition of new paradigm, “Dynamic Data-driven Application Simulation”. The idea is to enable the incorporation of new data into an existing simulation model continuously, and thus to allow the model to dynamically steer the measurement process. It offers the promise of improving modeling methods, and improving the analysis capabilities of simulation (Darema, 2004; Douglas and Efendiev, 2006). This approach was applied in diverse forms and in various areas (Douglas and Efendiev, 2006), in the very same way that simulation is applicable to a very wide range of domains. The challenge of real-time data feeding of a simulation model more often relies on technical challenges than on conceptual ones. Difficulties may arise when one needs to process structured and unstructured data from several sources in a relatively small amount of time. The real-time model must accommodate both the simulation objectives and the timing constraints. Moreover, this approach assumes that an initial simulation model was already built and is ready to receive new data. Here, we are focusing on the automatic construction of such a model, so that the construction process can be applied again when needed (for instance if new data are available).
1.4
Clinical pathway modeling
1.4.1 Definition of a clinical pathway
In this thesis, we are interested in developing a data-driven approach to model and simulate health-care processes, a.k.a clinical pathways (CP). A process is a collection of related activities that serve a common goal. A clinical pathway is a care process made of tasks whose ultimate objective is to make the patient healthy. It describes a set of treatment or administrative activities, such as consultation, appointments, imaging examination or surgery, with the common goal of treating a patient (Rebuge and Ferreira, 2012). In the literature, clinical pathway is also referred as “care pathway”, “critical pathways”, “integrated care pathways”, “care maps” or “patient trajectory”. There is no absolute definition of a clinical pathway. CP
26 Literature review
can refer at the same time to a very detailed view of a care process (e.g. the minute-by-minute sequence of surgical acts in an operating room) or to the macroscopic description of a patient’s medical events (hospitalization in January, general practitioner consultation in March and surgery in July). The time window of CP can be short (e.g. from the entrance in the emergency room to the discharge 4 hours later) or very long term (e.g. from a heart failure diagnosis until the death 10 years later).
1.4.2 Clinical pathway modeling approaches
Existing literature on the study of clinical pathways is vast, due to a large diversity of modeling ap-proaches, of analysis purposes and of CP description levels. The CP modeling methodology of many articles is based on experts’ opinion. Doctors are interviewed by a modeler to know how the care process is (supposedly) happening. Then, a model is built based on the collected information. Here, we do not extend further on that part of CP literature because they do not consider any data source and are subjective.
Most recent studies focus on the use of existing data to model and discover clinical pathways (Lin et al., 2001; Huang et al., 2013; Bouarfa and Dankelman, 2012; Cote and Stein, 2007; Adeyemi et al., 2013). We gathered these works in 4 groups, depending on the field of the modeling technique: statistical techniques, data mining methods, business process modeling and process mining algorithms. These approaches receive an increasing attention in the field of Medical Informatics.
Statistical and mathematical techniques
Statistical techniques are dedicated to the use of mathematical methods to find significant relations among two or more variables. Statistical tests (and p-value) can be used to assess the relation between patient characteristics and their medical history. In (Adeyemi et al., 2009) and (Adeyemi et al., 2013) a logistic model is implemented to determine the risk of being readmitted at hospital within 36 days in chronic obstructive pulmonary diseases. The model shows a significant difference of risk for patients of different region and gender. This conclusion was achieved thanks to a database of all the hospital events over a large territory. Such method can be implemented as a decision aid tool for clinicians. Statistical method can also be used to discover CP from data. The work of(Bouarfa and Dankelman, 2012) derives a work-flow consensus from multiple clinical activity logs to automatically detect work-flow outliers (with-out prior knowledge from experts). Work-flow mining was used to derive a consensus work-flow (i.e. the average surgery) from 26 surgical logs using multiple sequences alignment. The large computational requirements make the method non-scalable for large data.
In (Huang et al., 2013), a probabilistic (Latent Dirichlet Allocation) is used to automatically discover treatment patterns in unstable angina (2,934 patients) and several cancers. For each of the discovered patterns, each patient is assigned a probability of following this pattern. Results show how the different treatments are distributed during a stay, depending on the ongoing length of stay (e.g. medical imaging is made within the first 48 hours and hemoglobin test after 7 days). This approach proposes an innovative way to describe CP, through statistical distributions, compared to control-flow models.
Markov chains are a mathematical formalism from probability theory which is used to model the possible states of a system and the transitions among these states. A CP can be seen as a Markov chain where the studied system is a patient and the states are the care steps (Cote and Stein, 2007; Marwick et al., 2013; Lin et al., 2005; Elghazel et al., 2007). In (Cote and Stein, 2007), the authors propose a stochastic Markov chain to model the care process of doctor consultation. Their model includes 5 states (wait, nurse care, examination, imaging, check-out). Historical data were used to derive the transition
1.4 Clinical pathway modeling 27
probabilities among the states. The scope of the model is limited to the doctor consultation, it does not consider the entire pathway of a patient. Similarly, in (Lin et al., 2005), each time that a patient visits a doctor or a hospital, he/she is considered as a new patient. The model does not provide the big picture of the care process. Markov models can model different aspects of CP. In (Yen and Chen, 2013), the states of the Markov chain represent the development of chronic diseases for a patient (e.g. hypertension, diabetes, obesity). The objective is to propose a stochastic model capable of modeling transition rates and temporal sequences of a patient’s condition for any number of co-morbidities. 3-state and 4-state Markov models are analytically solved and a generalization to a n-state model is proposed. The model is proven to better estimate the proportion of susceptibility to co-morbidity based on the current situation of a patient. In (Marwick et al., 2013), a 6-state Markov chain is used to model the pathway of patients with mitral regurgitation. States represent patients’ condition (asymptomatic, heart failure, replacement, repair, stroke, dead). The model is used to identify eligible patients for an early surgery in order to prevent the occurrence of a stroke. An advantage of Markov chains is to allow for nested models that can describe a process at different levels. In (Zhang et al., 2015), 4 levels of aggregation are used to model a clinical pathway. A real-life application of the CP in chronic kidney disease is described (data of 1,576 patients). In the most detailed view, each state represents a care activity such as doctor consultation, medication (e.g. diuretics) and medical diagnoses (CKD stage 3, hypertension), whereas top-level clusters contain tens of such activities. The nested construction allows for a simplification of the clinical pathway, so that major trends stand out. In all cases, the main weakness of Markov models is the limited number of states that they can handle.
Data mining for clinical pathways
In the context of clinical pathways, data mining approaches are mostly used for two purposes: (1) dis-covering patterns in the sequence of medical events and (2) predicting the outcome of the next steps in the pathway.
The idea behind pattern discovery is that there exist some general schemes in the order and in the time line of patient pathway. This is due to the standardization of care processes. First, a patient is diagnosed, then he is treated and finally he is cured. However, each patient is unique and has a personalized pathway in response to his condition. Pattern discovery aims at unraveling patient pathway from such noisy and large medical data. Different aspects of clinical pathway can be specifically discovered, such as the time dependencies (Lin et al., 2001; Huang et al., 2013; Dagliati et al., 2014), the routing choices (Rozinat and van der Aalst, 2006b; de Leoni et al., 2016) and the control-flow (the most frequent paths and the deviations) (Bouarfa and Dankelman, 2012; Iwata et al., 2013).
In (Lin et al., 2001), the authors reports a mining strategy to discover time-dependency patterns in the clinical pathways of managing brain stroke. The medical record of 113 patients are used . The dependency between two care activities exists if they directly follow one another. Hence, they derive an oriented graph of the possible pathways from the data. A predictive model, based on association rules, was also implemented to determine the most probable path that a new patient may follow. The limitations of their work is to be extremely sensitive to noise (a noisy activity may interfere between two regular activities), to work only for small data volumes and to only consider direct following dependencies (whereas long-term dependency may exist). The approach of (Huang et al., 2013) also focuses on the identification of care events that occur within a certain time window. They develop a method which segments each patient pathway into relevant continuous and overlapping time intervals. The optimal time intervals are found when frequent medical behavior patterns are discovered. The objective is to gather close events in clusters
28 Literature review
to create a compact CP model from large and heterogeneous data sets. They successfully apply the method on 4 medical case studies. Records include 48 patients and 3,405 medical events (225 distinct) for the smallest sample, 445 patients and 23,106 events (513 distinct) for the largest. This approach is particularly adapted to the case of patients who repeatedly receive several medical cares in a short period of time (e.g. a day), but not for completely sequential ordered events.
The prediction of the next step in a clinical pathway can be defined as a classic data mining problem. Given a set of input characteristics, the model tries to predict which patients are more at risk of having a given medical event. The challenge of predicting the re-admissions is a dedicated example of such approaches (Adeyemi et al., 2009; Zolfaghar et al., 2013). The same prediction problem can be formulated at any step of a clinical pathway and is called a decision mining problem (Rozinat and van der Aalst, 2006b). We address this problem in detail in Chapter 5.
Business Process Modeling
Business Process Modeling (BPM) is the activity of representing processes of an enterprise (in a broad sense). The idea is to be able to represent a system, so that it can be analyzed and improved. The modeling step often relies on a domain-specific ontology. An ontology is a formal naming and definition of the types, properties and relationships of the entities that exist in a particular domain. The work of (Yao and Kumar, 2013) proposes a flexible modeling framework, compared to traditional business process models, because CP frequently involves deviations and atypical behaviors. In (Braun et al., 2015), a BPMN model is used to represent CPs. In addition, several extensions are incorporated to the model for multi-perspective modeling (medical resources, documentation, financing, etc.), in addition to the control-flow. The work of (Shitkova et al., 2015) proposes to unify existing modeling formalism (ULM, EPC, BMPN, etc.) in a common CP framework. The proposed methodology takes into account the characteristics and the possible usage scenarios of CP through semantic annotations, thus facilitating the choice of an appropriate modeling technique.
Process Mining algorithms
Process mining is a field entirely dedicated to the analysis of processes (in all domains) through the utilization of event logs (i.e the history of occurred events). Process mining is used to provide an impartial view of a process based on facts that really happened, as seen in the data. Thus, process mining combines the advantage of being data-driven and to focus on processes, such as clinical pathways. The following section presents existing works on process mining applied to health-care.
1.5
Process Mining in health-care
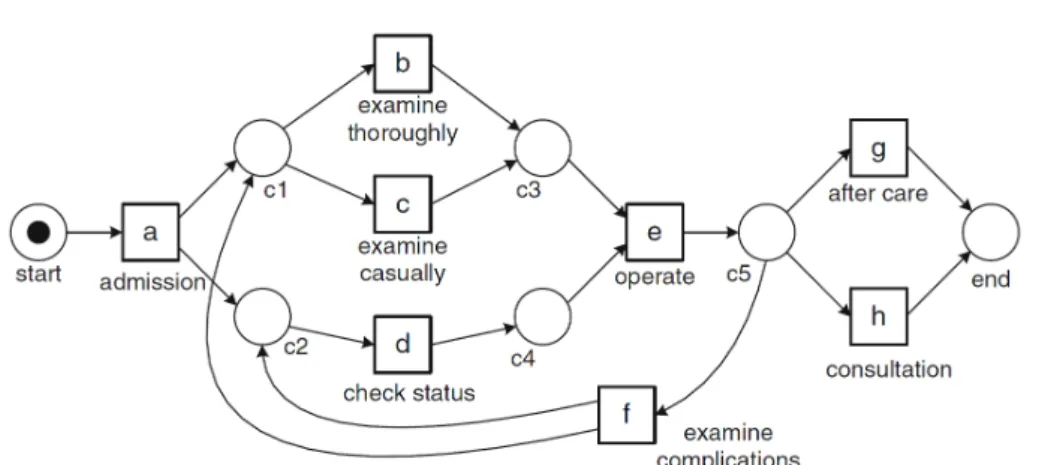
The general goal of process mining is to extract new information about processes from an event log (van der Aalst, 2011). Process mining is an ever-growing field which is a bit more than a decade old. There is a rich literature on the subject. It can be applied in various systems and domains (industry, administration, finance, health-care, etc.). Process mining is interested in discovering process models from raw data. It finds hidden patterns related to the order of the activities in a sequence. Process mining can be used to automatically discover a process model from data, to validate an existing model or to enrich a work-flow model with other perspectives (van der Aalst, 2011). Figure 1.1 shows an example of a process model discovered from a health-care event log. The model formalism is a Petri Net.