HAL Id: hal-01990880
https://hal-mines-albi.archives-ouvertes.fr/hal-01990880
Submitted on 8 Mar 2019HAL is a multi-disciplinary open access archive for the deposit and dissemination of sci-entific research documents, whether they are pub-lished or not. The documents may come from teaching and research institutions in France or abroad, or from public or private research centers.
L’archive ouverte pluridisciplinaire HAL, est destinée au dépôt et à la diffusion de documents scientifiques de niveau recherche, publiés ou non, émanant des établissements d’enseignement et de recherche français ou étrangers, des laboratoires publics ou privés.
Characterisation of 4043 aluminium alloy deposits
obtained by wire and arc additive manufacturing using a
Cold Metal Transfer process
Arturo Gomez Ortega, Luis Corona Galvan, Mehdi Salem, Kamel Moussaoui,
Stéphane Segonds, Sébastien Rouquette, Frédéric Deschaux-Beaume
To cite this version:
Arturo Gomez Ortega, Luis Corona Galvan, Mehdi Salem, Kamel Moussaoui, Stéphane Segonds, et al.. Characterisation of 4043 aluminium alloy deposits obtained by wire and arc additive manufac-turing using a Cold Metal Transfer process. Science and Technology of Welding and Joining, Maney Publishing, 2019, 24 (6), pp.538-547. �10.1080/13621718.2018.1564986�. �hal-01990880�
Characterisation of 4043 aluminium alloy deposits obtained by wire and arc
additive manufacturing using a Cold Metal Transfer process
Arturo Gomez Ortegaa, Luis Corona Galvana, Mehdi Salem b, Kamel Moussaouic, Stephane Segondsb,
Sébastien Rouquette a and Frédéric Deschaux-Beaumea
aLMGC, Univ. Montpellier, CNRS, Montpellier, France; bInstitut Clément Ader (ICA), Univ. Toulouse, CNRS, Mines Albi, UPS, INSA,
ISAE-SUPAERO, Toulouse, France; cAltran Sud-Ouest, Blagnac, France
ABSTRACT
4043 aluminium deposits were elaborated using a 3D print device equipped with a Cold Metal Transfer welding source. Two sets of process parameters leading to different average powers were compared in order to establish the relations between the powers and energies produced and the geometrical characteristics of the deposits. The effects of the travel speed and layer superposition on the transfer mechanisms as well as on the geometrical characteristics of the deposits were discussed for both sets of parameters. Finally, the formed microstructures were analysed and the porosity defects were quantified and discussed with regard to the heat input characteristics and the solidification conditions.
Introduction
Additive manufacturing (AM) technologies are a new way of manufacturing near-net shape metallic parts with complex geometries at low cost. Among the vari-ous AM technologies, Wire and Arc Additive Manufac-turing (WAAM) is probably one of the most promising to produce large parts, due to a very high deposit rate compared to other processes based on laser or elec-tron beam heat sources [1]. WAAM processes use a
welding source to turn an electrical arc on in order to melt a metallic filler w ire. Various welding processes can be used such as Gas Tungsten Arc Welding [2,3],
Plasma Welding [4] or Gas Metal Arc Welding [5,6].
The Cold Metal Transfer (CMT) welding process was also recently used as WAAM heat source [7]. This
process allows accurate control of the deposited metal thanks to accurate control of the intensity waveform of the welding source coupled to an alternating feeding of the metal wire [8]. The CMT cycle involves several
parameters, e.g. at least eight for defining t he inten-sity CMT cycle. Fine tuning of these process parame-ters requires complex analyses in order to optimise the deposit characteristics, as the average power is not the main indicator as discussed in a previous paper [9].
Recently, the process was applied to build aluminium alloy walls, demonstrating the great potential of the process for such applications [7,10]. However, some
issues occurred with this material, such as heat accumu-lation, requires monitoring the temperature between passes during the additive manufacturing [11]. In
addi-tion, pores arising from hydrogen or other contaminant
are observed, that can be reduced with a thorough cleaning of the metal surfaces [12]. These pores have a
detrimental effect on the mechanical behaviour, espe-cially concerning the fatigue strength [13]. The
opti-misation of the deposits geometries or microstructure and mechanical properties of the materials requires a good understanding of the relationship between pro-cess parameters and these characteristics.
The present work aims to better understand the effect of CMT process parameters on the geometrical characteristics and microstructure of 4043 aluminium alloy deposits in order to build structural parts by addi-tive manufacturing.
Experimental details
Monolayer and multilayer deposits were achieved using a dedicated 3D printer especially developed for the study [7]. A 1.2 mm diameter filler wire made of 4043
aluminium alloy (Al–5%Si) was used. The filler wire was melted and deposited on a pure aluminium plate of 3 mm thickness with a CMT arc welding process. Various welding energies and travel speeds were inves-tigated. The aluminium baseplate was connected to the negative polarity of the welding source whereas the filler w ire t ip w as c onnected t o t he p ositive polarity in order to get an electrical arc between the wire tip and baseplate. The CMT belongs to the Gas Metal Arc Welding processes and was developed to control accu-rately its heat input. The CMT cycle consists in accurate control of the welding intensity through three stages:
Figure 1.Liquid metal droplet transfer during CMT cycle.
first, a current pulse of given duration (boost phase) melts the wire tip in order to form a liquid droplet (Figure1(a)). Second, the welding intensity is decreased to a programmed value (wait phase) while the filler wire is fed forward at a controlled feed rate which drops the molten wire into the baseplate (Figure1(b)). Thirdly, the contact between the wire tip and the substrate pro-duces a short-circuit and arc extinction (short-circuit phase) and thus decreases the voltage near to zero volt (Figure 1(c)). The intensity then changes to a pro-grammed value as well as the filler wire is fed backward mechanically to split apart the wire from the molten pool (Figure 1(d)). Then the molten metal droplet solidifies to let place to a solid deposit. The stability of this metal transfer cycle relies on a thorough tuning of the numerous CMT parameters (between 8 and 15 according to the CMT process option), and their effect in the additive manufacturing process in not accurately known yet.
Two sets of process parameters were selected for comparison and they are summarised in Table1. Only five main parameters, among the set of nine possibles are listed for the sake of simplicity. These parameters were chosen according to the results of a previous study [7] as they led to regular beads at a high deposition rate. Solely three parameters were studied from these two sets: the feed rate of the filler wire Vf, the cur-rent of the boost phase Ib and its duration tb. These changes modified the average power of the electrical arc, thus the heat input and as a consequence the size and the frequency of the deposited droplets on the sub-strate. The two remaining parameters in Table 1 are respectively the imposed values of wait intensity Iw and short-circuit Intensity Isc.
Table 1.Values of the two studied CMT parameters sets.
Set point Iw (A) Vf(m/min) Isc (A) Ib (A) tb (ms)
P1 70 35 40 150 5
P2 70 37.5 40 135 9,5
In order to investigate the characteristics of the CMT electrical waveforms, the welding intensity and volt-age were recorded at a frequency of 25 kHz during each deposit using a data acquisition system NI 9215. The voltage was measured after signal conditioning using a voltage divider bridge, which is connected to the baseplate and the contact tube of the fi ller wire in the welding torch. The welding intensity was mea-sured with a Hall effect s ensor L EM L F 3 05-S fitted on the return welding cable. The recorded intensity and voltage signals were then processed using dedi-cated Python routines in order to plot the waveform characteristics.
The deposits were scanned using a BREUCKMANN OPTO TOP-HE system in order to get its geometrical characteristics. The data were also post-processed with dedicated Python routines to extract some geometri-cal characteristics such as the total deposited volume or the average height and width of the deposits. Further-more, some cross sections of the deposits were prepared for macrostructure observation using a LEICA Z16 APO optical microscope as well as their microstructure using an FEI Nova NanoSEM 450 Scanning Electron Microscope (SEM).
Analyse of the metal transfer cycle
Figure 2 shows the intensity and voltage waveforms associated to both sets of parameters. The main dif-ference lies on the electrical arc phase comprising the boost and wait phases. The duration of the boost phase is higher for set P2 while its intensity value is lower in accordance with the programmed parameters values (Table 1).
Analysis of the voltage and intensity waveforms dur-ing deposition are performed in order to study the mechanisms of heat transfer, filler w ire m elting and solidification. E ach w aveform c an b e s plit i nto three phases: the boost phase, during which the fi ller wire tip is melted with the high-intensity pulse; the wait phase, during which the fi ller wire is fed towards the substrate with lower intensity; and the short-circuit phase, dur-ing which the molten droplet formed at the wire tip is deposited. The electrical power and duration of the arc phase determine the quantity and the temperature of the deposited metal.
Figure 3 shows the average power measured for each phase according to the travel speed for both sets of parameters. The average power of each phase does not change with the travel speed. The average power of the
Figure 2.Intensity and voltage waveforms for sets P1 (a) and P2 (b).
Figure 3.Evolution of the average power for each phase of the CMT cycle and total cycle versus travel speed.
wait and short-circuit phases are similar for sets P1 and P2, whereas the average power of the boost phase is lower for set P2 due to the lower imposed boost inten-sity. However, the average power of the total cycle is higher for set point P2 because of the longer duration of the boost phase.
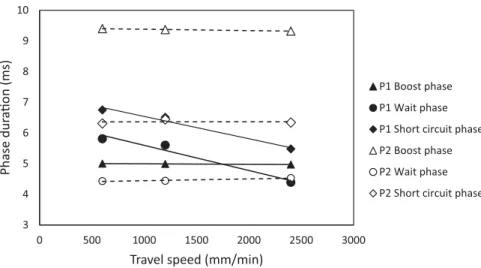
Furthermore, the phase durations change with the travel speed. Nonetheless, the boost phase duration is constant whatever the welding speed, which is not surprising because this parameter is controlled by the CMT process (tb parameter). The imposed intensity boost value is well respected for both sets whatever the travel speed. The durations of the wait and short-circuit phases are also not modified with the travel speed for set P2. Conversely, these durations decrease with the travel speed for set P1. As the wire feed speed is always kept constant for all the travel speeds, the decrease of the wait phase duration indicates that the arc length is lower when the travel speed increases, so the contact of the wire tip with the substrate during the wait phase takes place earlier. In the same way, the droplet sepa-ration is facilitated by the increase of the travel speed that shortens the duration of the backward phase of the
filler wire, giving a lower arc length at the arc ignition (Figure4).
The decrease of the wait and short-circuit phases durations when the travel speed increases for set P1 explain the increase of the average power of the total cycle observed in Figure3. As a consequence, the short-circuit frequency, and then the drop deposit frequency, increase from 55.7 to 65.2 s−1 when the travel speed increases from 600 to 2400 mm/min for set P1, whereas it remains constant at about 48 s−1for set P2. The fre-quency is globally lower for this last set, mainly due to the longer boost phase duration. The average duration of the total CMT cycle is slightly higher than the sum of the durations of the 3 phases, due to the transition times between two phases.
Table2presents the average energies for each phase of the transfer cycle. There are significant differences between the two sets. For set P1, the energy produced during the wait phase is only two times lower than the boost phase energy, so it should contribute to the filler wire melting. For set P2, the boost phase energy is four to five times higher than the wait phase energy, so the filler wire melting is mainly controlled by the boost
Figure 4.Durations for each phase of the CMT cycle versus the travel speed.
Table 2.Average energy (J) produced during each of the three phases and during a total cycle.
Set point Travel speed (mm/min) Boost phase Wait phase Short-circuit phase Total energy per cycle P1 600 14.16 6.66 0.20 21.02 1200 14.58 6.67 0.19 21.44 2400 14.31 5.20 0.19 19.70 P2 600 23.62 5.24 0.19 29.05 1200 23.59 5.28 0.20 29.07 2400 23.42 5.30 0.20 28.93
phase. The increase of the travel speed led to a decrease of the energy of the wait phase for P1, and so on the total energy per cycle. This is due to the decrease of the duration of the wait phase mentioned earlier. The total energy per cycle for set P2 is about 50% higher than for set P1.
Effect of process parameters on the deposit
Monolayer deposits were made using both sets of parameters and several travel speeds in the range 300–2700 mm/min. Figure5shows the total deposited volume for a 80 mm long deposit, for each set of parameters. For a given set of process parameters, the deposited volume decreased with the travel speed.
Figure 5.Total deposited volume versus the travel speed for a 80 mm long deposit.
Figure 6.Evolution of the deposit rate versus the travel speed.
In addition, the deposit has rather the same volume for sets P1 and P2 up to a travel speed threshold of 1000 mm/min, and then it becomes higher, about 20% for set P2 at higher travel speed. The calculation of the deposit rate confirmed this result. This calculation was done by dividing the deposited mass, considering a material density of 2.7, with the deposition duration. The deposit rate was rather constant for set P1, and equal to the deposit rate of set P2 for low travel speed as it is shown on Figure 6. However, the deposit rate increased for set P2 when the travel speed overtook 1200 mm/min.
The weight of deposited molten metal drop at each short-circuit could be deduced as the short-circuit fre-quency is measured (Figure7). The average weight of the droplet was globally higher for set P2 for given travel speed. Nevertheless, the average drop weight also varied with the travel speed.
For set P1, the drop weight tended to decrease with the travel speed. This result could be explained by the lower duration of the arc wait phase when the travel speed is high (Figure4), which decreased the energy produced by the electrical arc to melt the wire (Table2). This decrease of the drop weight was however com-pensated by a higher deposit frequency, giving a rather constant deposit rate.
Figure 7.Evolution of the average weight of the deposited drops versus the travel speed.
Conversely, the drop weight increased with the travel speed for set P2. This result was not correlated to an increase of the global energy produced by the electrical arc, which remained rather constant for set point P2. This could be due to the better energy efficiency of the process, or especially to less heat losses when the travel speed increased. One source of heat losses in GMAW processes is due to the heat conduction from the filler wire tip into the welding torch. Increasing the travel speed produced a flatter deposit, and then an important length of wire below the welding torch. Consequently, the heat losses from the wire tip towards the torch were reduced, and a higher volume of filler wire could be melted and deposited with the same energy. This effect was also probably effective with set P1, but it was coun-terbalanced by the decrease of the arc energy due to a shorter arc wait phase. Then, for set point P2, the increase of the deposit rate for high travel speed was due to the weight increase of the deposited drops.
The improvement of the energy efficiency when the travel speed increased for set point P2 was also observed with the evolution of the ratio between the total energy per cycle and the weight drop (Figure8). This ratio was rather regular whatever the travel speed with set point P1, whereas it decreased significantly for set P2 when the travel speed was high, expressing the increase of the
Figure 8.Evolution of the ratio between the total energy and the weight drop versus the travel speed.
energy efficiency due to the decrease of heat losses in the welding torch.
Figure 9 shows the cross-section of deposits. The deposit made under the conditions of set P2 had a better spread than the one made with set P1 for each travel speed investigated. The spread of a liquid metal on a solid substrate was subjugated to the displace-ment of the contact line (or solid–liquid–gas triple line). According to some authors [14,15], the position of this line is controlled by the solidification of the liquid at the contact line. This result was in accordance with the high average power for set P2, which produced high heat-ing of the substrate, and then delayed the solidification of the contact line. This was confirmed by the penetra-tion of the molten zone on the substrate, which was also better for set P2.
For travel speeds below 1500 mm/min, the deposit rates were similar for sets P1 and P2, so the improve-ment of the spread must be due to the high tempera-ture of the deposited drops for set P2, in accordance with the high ratio of total energy by weight drop (Figure8). For higher travel speed than 1500 mm/min, this spread improvement for set P2 was correlated to the weight increase of the deposited drops, transferring more energy to the substrate. Consequently, the height of the deposit, for a similar travel speed, was higher for parameters P1, whereas its width was lower (Figure10). Let us note that the width for set P1 stabilised to a value of 2.5 mm for travel speeds beyond 1500 mm/min. This width corresponded to the diameter of the droplets formed at the wire tip for set P1, which was also the minimal deposited width to get a continuous bead. In contrast, the deposit height decreased for travel speeds above 1500 mm/min despite width was kept constant that was why the deposit seemed more spread out (Figure9, last row for 2400 mm/min).
Multilayer deposits
Effect of process parameters
Two deposit strategies were first investigated in order to build walls by overlaying several layers: the first one consisted in depositing all the layers in the same direc-tion. That is to say, the welding torch was put in the same initial place in a one-way strategy while the ver-tical distance between the baseplate and welding torch was increased (Figure11(a)). The second one consisted in alternating the welding torch starting point: the start-ing point of the new deposit is placed at the endstart-ing point of the last deposit in sort of go and back strat-egy (Figure11(b)). The results clearly showed that the second strategy led to more regular height of walls. This was mainly due to a higher deposit height at the begin-ning of each deposit, which increased with the layers addition. The go and back strategy was then adopted in the following tests.
Figure 9.Cross sections of the deposits.
Figure 10.Evolution of the average width (a) and height (b) of the deposits versus the travel speed.
During the superposition of several layers using the go and back strategy, the heat accumulation in the pre-vious deposits led to a progressive change in the geome-try of the deposits. The width of each newly added layer increased in comparison to the last one while its height decreased at the same time (Figure12). Break time was applied between successive deposits in order to reduce these geometry variations. Figure12shows the effect of 10 and 60 s breaks on the height and width of the first
six layers of a 100 mm long wall built with set point P1 at a travel speed of 1200 mm/min. A short 10 s break time stabilised the deposit width after the fourth layer. A break time of 60 s slightly improved the regularity of the layer width. However, short manufacturing times are required in order to get competitive industrialisa-tion of WAAM process. A 10s break time then led to a better compromise than the 60 s one, and is chosen for the future tests.
Figure 11.Multilayer deposit strategies and resulting geometries.
Figure 12.Evolution of the average total height (a) and the average width (b) of the deposits with the layer addition for set point P1 at a travel speed of 1200 mm/min for 100 mm long deposits.
For set point P2, a 10 s break time also improved the regularity of the layers geometry during wall build-ing except that the spread was more important durbuild-ing the first deposits. Furthermore, the width was not com-pletely stabilised after the sixth layer. This was of course due to the high energy generated with this set of param-eters that created an important heat accumulation.
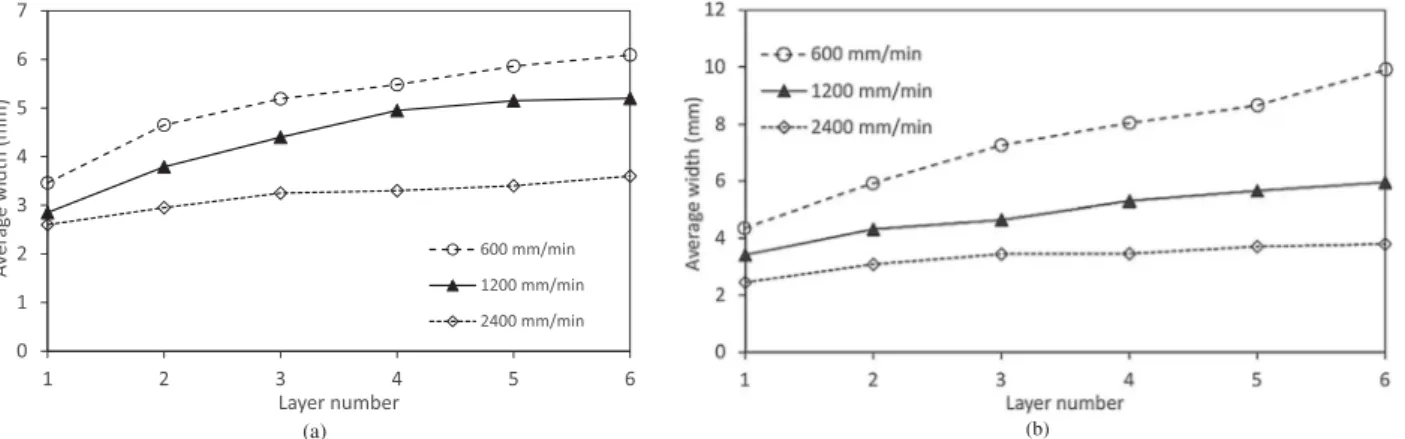
The travel speed had also an effect on the increase of the layer width during the first deposits. Figure13(a)
shows the layer width evolution with set P1 when the travel speed decreased from 2400 to 600 mm/min, for a 100 mm long wall. The wall width stabilised to a value below 4 mm after the sixth layer for the higher speed while it continued to increase slightly up to 6 mm for the lower speed. The geometry of deposits have not been stabilised despite an increase of the break time. Indeed the heat transfer by conduction was very slow after several seconds with the reduction of the heat
Figure 13.Evolution of the average width of the last deposit versus the number of deposited layers for various travel speeds, for sets P1 (a) and P2 (b).
gradient. An increase of the thickness of the aluminium baseplate would have enhanced heat conduction, or a cooling system under the baseplate could have been another solution to improve the geometrical regularity of the deposits.
The problem of heat extraction was more obvious for walls build with set P2 due to the high heat input asso-ciated to this set of parameters. Under these conditions, the layer width continued to increase after the sixth layer for a travel speed of 1200 mm/min (Figure13(b)). The layer width became regular after the sixth layer for travel speed higher than 2400 mm/min.
Microstructure
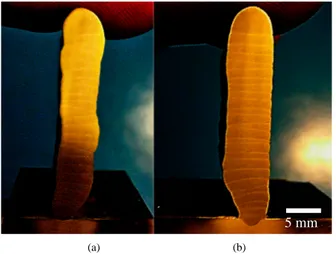
Figure14 shows macrographs of the walls built with sets P1 and P2 at a travel speed of 900 mm/min and a break time of 10 s. Both walls got rather similar geom-etry, with a width increasing during the deposition of the first layers and a relative stabilisation after six layers. The size of the molten zone of the last layer of the wall was drastically higher than the first layer due to the heat accumulation (Figure14). As well as a large part of the previous layer was melted down during the deposition of the new layer. The melted down interface between two layers is relatively flat, especially with set P2, which is also an indication of the geometrical stability of the deposits.
The microstructure of the deposited materials is typical of Al–Si solidification structure (Figure15). It consists of grains composed of an aluminium solid solution with a dendritic aspect, separated by an Al–Si eutectic.
However, the size of the dendritic structure and its morphology changed with the position into the wall. At the base of the wall, in the first deposited layer, the microstructure was finer (Figure 16(a)), indicating a higher solidification rate. This result was in accordance with the low initial temperature of the substrate (room
(a) (b)
5 mm
Figure 14.Macrographs of 25 layers walls built with parame-ters sets P1 (a) and P2 (b) at a travel speed of 900 mm/min.
Figure 15.SEM micrograph showing the microstructure of the deposits (parameters set P2, wall centre, longitudinal section).
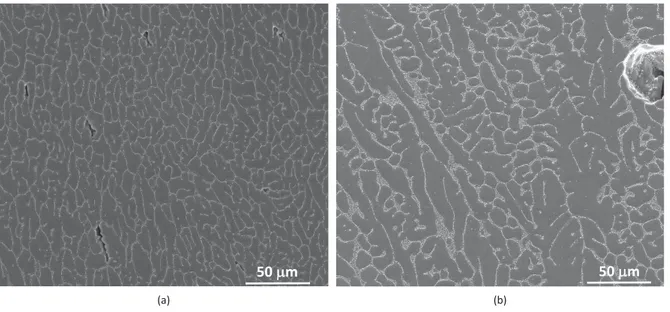
temperature), which led to a high cooling rate. From the second pass, the initial temperature of the substrate was higher and the solidification rate slowed conducting to a larger size microstructure (Figure16(b)). Another dif-ference between the first and the other layers is the morphology of the dendrites. The first layer exhibited rather equiaxed dendrites whereas the others presented more columnar dendrites with a morphological orien-tation following the heat extraction direction (towards the baseplate through the previously deposited layers). A slightly finer dendrite microstructure was observed for P1 in comparison to P2, which was due to lower heat input. These differences were not very significant (Figure17).
Porosity
Two kinds of compactness defects were observed in the deposits: small elongated defects (Figure 16(a)), and larger spherical pores, resulting from the high hydrogen solubility in liquid aluminium compared to solid aluminium [13]. The first ones were located in the interdendritic area, and seemed to result from a hot-cracking phenomenon, currently observed on alu-minium alloys. However, these flaws had a very low size and were widely spaced, the 4043 aluminium alloy being not very sensitive to this hot-cracking phe-nomenon. Conversely, the size of the pores was larger and their number is much more important. Some pores reached a diameter up to 400 micrometres (Figure18), although most of had a diameter between about 20 and 100 micrometres.
The pore area mean fraction, corresponding to the ratio between the porosity area and the total area of the sample, computed for each sample from 12 cross-section micrographs with magnification×100, is 0.90 (+/−0.23) for set P2 and 1.88 (+/−0.22) for set P1, which is however rather low. This difference could be
Figure 16.Comparison of the microstructure size of the first layer (a) and twelfth layer (b), for the multilayer deposit elaborated with set point P2 (longitudinal section).
Figure 17.Comparison of the microstructures obtained for the first layer deposited with set P1 (a) and P2 (b) (cross sections).
Figure 18.Porosity defects in the deposits (parameters set P2, longitudinal section).
associated to the high heat input for point P2, which increased the temperature of the melted pool and then
decreased its viscosity that allowed the rapid diffusion of gas bubbles towards the outer surface. The increase of the heat input also increased the fluid flow in the melted zone, due to the Marangoni effect that pro-moted the elimination of gas bubbles [16,17]. However, the average heat input was not the main parameter controlling the porosity in aluminium. It was recently demonstrated that a modification of the CMT cycle, for instance by adding some high current pulse between the CMT cycles, or by inverting periodically the arc polarity, could also reduce the porosity [18].
Conclusion
Two sets of CMT process parameters, giving differ-ent average powers, were compared in order to build multilayer deposits of 4043 aluminium alloy using the WAAM process. The following conclusions can be stated:
• The set of parameters leading to lowest average power produced deposit rates independent of the travel speed, with smaller droplets deposited at a higher frequency.
• Conversely, the set of parameters conducting to the highest average power produced deposit rates that increased for high travel speed. This was due to an increase of the weight of the deposited droplets, which resulted from lower heat losses into the weld-ing torch.
• The spread of the deposited liquid metal droplets was better with the set giving the highest average power, probably due to the increase of the temper-ature of the deposited drops at low travel speed and their weight increased at high travel speed.
• The wall built by superposition of layers required alternating the deposit starting point at each new layer to limit geometrical defects.
• Heat accumulation due to the layer addition also required adding break time between the deposits fixed to 10 s for 100 mm long deposits. Otherwise, the width of the deposits increased continuously with the layer addition, especially with the highest average power.
• A dentritic microstructure was observed for all the deposits. Dendrites were rather equiaxed and finer for the first layer while coarser and more columnar for the subsequent layers that were probably due to the decrease of the solidification rate with the heat accumulation.
• Two kinds of solidification defects were observed: mainly pores, and some scarce hot-cracking defects. Pores were less numerous and large for the set giv-ing the highest average power, the pore area fraction being only of 0.9%.
Disclosure statement
No potential conflict of interest was reported by the authors.
Funding
The authors are grateful to CONACYT (COnsejo Nacional en Ciencia Y Tecnología, Mexico) for supporting financially this work.
ORCID
Mehdi Salem http://orcid.org/0000-0002-8778-3970
Sébastien Rouquette http://orcid.org/0000-0002-1849-6142
References
[1] DebRoy T, Wei HL, Zuback JS, et al. Additive manufac-turing of metallic components – process, structure and properties. Prog Mater Sci.2018;92:112–224.
[2] Donoghue J, Antonysamy AA, Martina F, et al. The effectiveness of combining rolling deformation with wire–arc additive manufacture onβ-grain refinement
and texture modification in Ti–6Al–4 V. Mater Charact. 2016;114:103–114.
[3] Szost BA, Terzi S, Martina F, et al. A comparative study of additive manufacturing techniques: resid-ual stress and microstructural analysis of CLAD and WAAM printed Ti–6Al–4 V components. Mater Des. 2016;89:559–567.
[4] Xu X, Ding J, Ganguly S, et al. Oxide accumula-tion effects on wire+ arc layer-by-layer additive man-ufacture process. J Mater Process Technol. 2018;252: 739–750.
[5] Haden CV, Zeng G, Carter FM, et al. Wire and arc addi-tive manufactured steel: tensile and wear properties. Addit Manuf.2017;16:115–123.
[6] Xiong J, Yin Z, Zhang W. Closed-loop control of vari-able layer width for thin-walled parts in wire and arc additive manufacturing. J Mater Process Technol. 2016;233:100–106.
[7] Ortega AG, Galvan LC, Deschaux-Beaume F, et al. Effect of process parameters on the quality of aluminium alloy Al5Si deposits in wire and arc additive manufacturing using a cold metal transfer process. Sci Technol Weld Join.2018;23(4):316–332.
[8] Mezrag B, Deschaux-Beaume F, Benachour M. Control of mass and heat transfer for steel/aluminum joining using cold metal transfer process. Sci Technol Weld Join. 2015;20(3):189–198.
[9] Mezrag B, Deschaux-Beaume F, Rouquette S, et al. Indi-rect approaches for estimating the efficiency of the cold metal transfer welding process. Sci Technol Weld Join. 2018;23(6):508–519.
[10] Nie Y, Zhang P, Wu X, et al. Rapid prototyping of 4043 Al-alloy parts by cold metal transfer. Sci Technol Weld Join.2018;23(6):527–535.
[11] Geng H, Li J, Xiong J, et al. Optimisation of inter-pass temperature and heat input for wire and arc addi-tive manufacturing 5A06 aluminium alloy. Sci Technol Weld Join.2017;22(6):472–483.
[12] AlShaer AW, Li L, Mistry A. The effects of short pulse laser surface cleaning on porosity formation and reduc-tion in laser welding of aluminium alloy for auto-motive component manufacture. Opt Laser Technol. 2014;64:162–171.
[13] Gou G, Zhang M, Chen H, et al. Effect of humid-ity on poroshumid-ity, microstructure, and fatigue strength of A7N01S-T5 aluminum alloy welded joints in high-speed trains. Mater Des.2015;85:309–317.
[14] Tavakoli F, Davis SH, Kavehpour HP. Spreading and arrest of a molten liquid on cold substrates. Langmuir. 2014;30:10151–10158.
[15] De Ruiter R, Colinet P, Brunet P, et al. Contact line arrest in solidifying spreading drops. Phys Rev Fluids. 2017;2:043602.
[16] Zhang C, Gao M, Wang D, et al. Relationship between pool characteristic and weld porosity in laser arc hybrid welding of AA6082 aluminum alloy. J Mater Process Technol.2017;240:217–222.
[17] Tao W, Yang Z, Shi C, et al. Simulating effects of welding speed on melt flow and porosity for-mation during double-sided laser beam welding of AA6056-T4/AA6156-T6 aluminum alloy T-joint. J Alloys Compd.2017;699:638–647.
[18] Baoqiang C, Ruijie O, Bojin Q, et al. Influence of cold metal transfer process and its heat input on weld bead geometry and porosity of aluminum-copper alloy welds. Rare Metal Mater Engineer. 2016;45(3): 606–611.