HAL Id: hal-01914650
https://hal.archives-ouvertes.fr/hal-01914650
Submitted on 7 Nov 2018HAL is a multi-disciplinary open access
archive for the deposit and dissemination of sci-entific research documents, whether they are pub-lished or not. The documents may come from teaching and research institutions in France or abroad, or from public or private research centers.
L’archive ouverte pluridisciplinaire HAL, est destinée au dépôt et à la diffusion de documents scientifiques de niveau recherche, publiés ou non, émanant des établissements d’enseignement et de recherche français ou étrangers, des laboratoires publics ou privés.
Algorithm for the critical points assessment in the
romanian power system
Virgil Dumbrava, Bogdan Nicoara, Mircea Scutariu, Philippe Duquenne
To cite this version:
Virgil Dumbrava, Bogdan Nicoara, Mircea Scutariu, Philippe Duquenne. Algorithm for the critical points assessment in the romanian power system. Regional Conference, Montenegro, Nov 2004, Herceg Novi, Montenegro. pp.1-7. �hal-01914650�
OATAO is an open access repository that collects the work of Toulouse
researchers and makes it freely available over the web where possible
Any correspondence concerning this service should be sent
to the repository administrator:
[email protected]
This is an author’s version published in: http://oatao.univ-toulouse.fr/21034
To cite this version:
Dumbrava, Virgil and Nicoara, Bogdan and Scutariu, Mircea and Duquenne,
Philippe
Algorithm for the critical points assessment in the romanian power
system. (2004) In: Regional Conference, Montenegro, 5 November 2004 - 8
November 2004 (Herceg Novi,, Montenegro). (Unpublished)
ALGORITHM FOR THE CRITICAL POINTS ASSESSMENT
IN THE ROMANIAN POWER SYSTEM
V. Dumbrava, “POLITEHNICA” University of Bucharest, ROMANIA B. Nicoara, “POLITEHNICA” University of Bucharest, ROMANIA M. Scutariu, ELECTRICA Muntenia Sud S.A., Bucharest, ROMANIA P.Duquenne, Institut National Polytechnique de Toulouse, FRANCE
INTRODUCTION
The creation of electricity market and adjoining regulatory framework call on analysis focused on the maintenance and distribution networks operation optimization solutions aimed at the increase of the operational security and the economic efficiency of specific activities undertaken by distribution operators.
Across the 1990-2000 decade a series of concepts/models focused on the increase of efficiency for distribution activities have been developed both via activity organization models and specific software applications – that usually provide technical data support for asset management. The Asset Management Systems (AMS) can be described as dedicated software applications aimed at supporting the development of asset management functions, with a major objective on the maximization of income.
Basic functions within the asset management are: o Elaboration of maintenance strategies;
o Decisions on replacement or re-engineering of distribution networks assets;
o Introduction of new technologies, implementation of advanced applicative research in the field of asset management;
o Risk management implementation.
The evolution of maintenance management systems correlated with ever more frequent utilization of methodologies based on cost management as function of duration/lifecycle, or reliability-centered maintenance, etc. facilitate the extension of asset life duration and may bring useful information to support their management across their life-time span.
In the maintenance field there three major categories widely accepted of maintenance strategies: condition based maintenance (CBM), reliability centered maintenance (RCM) and risk-based maintenance (RBM). The advent of electricity markets has created additional incentives for the development and onset of applying reliability-centered maintenance strategies that are basically focused on achieving established/demanded reliability/performance levels at the same time with a minimization of the costs correlated with asset reliability level. According to other points presented in the literature, such as Roshler et al (1), Orlowska et al (3), Kopejtkova et al (4) results that may be obtained are:
- equipment/installations assessment based on the technical condition criteria and also on systems reliability. Thus an overall image of electrical distribution network technical condition can be obtained;
POLITEHNICA University of Bucharest, Power Engineering Faculty, Splaiul Independentei 313, Bucharest, sector 1, ROMANIA, e-mail [email protected]
MEĐUNARODNO REGIONALNO SAVETOVANJE O ELEKTRODISTRIBUTIVNIM MREŽAMA
REGIONAL CONFERENCE AND EXHIBITION ON ELECTRICITY DISTRIBUTION
Crna Gora, Herceg Novi, 5 - 8. oktobar 2004. / Montenegro, Herceg Novi, October 5 - 8, 2004 * * * * * * * * * * * * * * * * * * * * * * * * * * * * * * * * * * * * * * * * * * * * * * * * * * * * * * * * * * * * * * * * * *
PRETRAŽIVANJE / SEARCH
ŠTAMPANJE / PRINT
- emphasize critical points in the network and decide on the sequence of maintenance activities to be deployed for improvement.
This approach in terms of underlying strategy offers the opportunity to rank equipment from the technical condition and network importance points of view at the same time. The correlation of the two possible options for ranking allows a given entity to promote adequate allocation of resources for maintenance activities-related expenditure even in the case of a limited budget.
STATEMENT OF THE PROPOSED APPROACH
In order to determine the critical points the equipment of the electrical distribution network has been divided from operational pint of view in the following entitties:
- nodes (busbar systems);
- connections (electrical lines, auto-transformers and transformers).
In this paper the focus will go on the node entities. The methodology to determine the critical points can be easily extended to power substations as it will be shown in the following.
For the NODE entity the following equipment will be considered: primary equipment, secondary equipment, surge arresters, earth grounding, lightning rods, constructions (foundations, concrete frames, etc.).
In the TRANSFORMER entity it will be included: transformer/auto-transformer, current and voltage transformers included in the transformer/auto-transformer assembly, protection schemes associated to the transformer/auto-transformer.
In INTERNAL SERVICES entity the following equipment is normally taken into account: direct current and a.c. internal services.
In the COMPENSATION DEVICES the next equipment are included: compensation coils, synchronous compensators, capacitor banks.
In the IT-TELECOMMUNICATION entity the remote-control systems, SCADA and telecommunication systems are taken into consideration.
The determination of critical points within the distribution network is based on a multi-criteria analysis. The criteria considered are:
- node technical condition TC - level of importance in distribution network operation LI
- conveyed electric energy CE
For each of these criteria the nodes will be granted a mark from 1 to 100. Mark 1 corresponds to the best qualification while mark 100 describes the worst case. The marks associated to each criterion will be weighted based on weighting coefficients as in the following:
- node technical condition pTC [p.u.]
- level of importance in distribution network operation pLI [p.u.]
- conveyed electric energy pCE [p.u.]
The value of the weighting coefficients, on the grounds that they sum up to 1, shall be settled afterwards, based on a sensitivity analysis.
EQUIPMENT TECHNICAL CONDITION ASSESSMENT
In order to determine the technical condition of the nodes the following four criteria, together with their respective weighting coefficients are proposed:
• equipment physical usage PU pUF [p.u.] 0.45
• number of faults NF pNF [p.u.] 0.20
• unavailability duration UD pUD [p.u.] 0.15
• associated costs AC pAC [p.u.] 0.20
The mark for the technical condition of the equipment in a given node may be computed based on: AC AC UD UD NF NF PU PU node _ TC p M p M p M p M M = ⋅ + ⋅ + ⋅ + ⋅ (1)
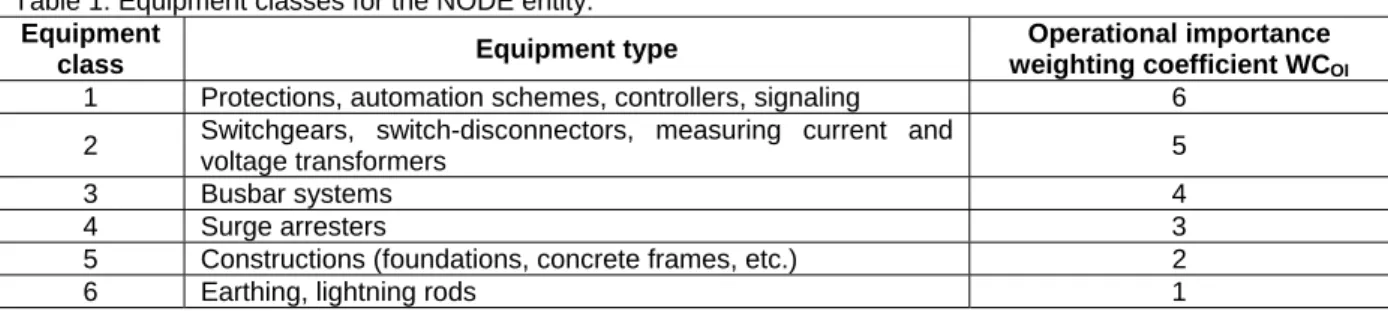
Since within the NODE entity a number of different equipment are considered altogether for the determination of the mark of the whole assembly the following procedure is proposed. As initial assumption the equipment considered for the NODE entity is divided into six classes, grouped according to their operational importance within the entity. The classes are presented in Table 1.
Table 1. Equipment classes for the NODE entity. Equipment
class Equipment type
Operational importance weighting coefficient WCOI
1 Protections, automation schemes, controllers, signaling 6 2 Switchgears, switch-disconnectors, measuring current and
voltage transformers 5
3 Busbar systems 4
4 Surge arresters 3
5 Constructions (foundations, concrete frames, etc.) 2 6 Earthing, lightning rods 1
Each physical unit accounted for in these classes will be granted a mark for the characterization of its physical usage condition, on a scale from 1 to 100. Ideally this mark should be produced via reliability centered maintenance based software, with a unitary vision on the whole range of individual equipment across the entire distribution network. Since such maintenance strategies are quite scarcely applied at distribution systems levels an alternate approach is proposed for the determination of the mark. It consists of the following sequence:
a) for each type of equipment embedded in the node entity the corresponding physical usage points are computed via:
time Life year ing Commission year Current PtsPU = (2) where ‘Current year’ denotes the year for which the physical usage is estimated and ‘Commissioning year’ stands for the commissioning year or the rehabilitation year. The life time is normally taken to be rated life span according to equipment producer. The computations will be undertaken on a representative sample of relevant magnitude for the distribution assets population.
b) within these samples, selected for each type of equipment, a ranking will be organized according to the physical usage points in the ascending order.
c) physical usage marks should be attached on the scale 1 to 100 for the whole range of each individual equipment samples, such as to maintain consistency – the worst cases will collect the biggest marks.
d) after each component of different samples attached to the various equipment embedded in the node entity received the physical usage mark, an average grade for each equipment class will be computed: j n 1 i i, j j , eq _ avg n M G j
∑
= = (3) where Gavg_eq,j is the average grade for class j of equipment, nj is the number of items in class j, while Mj,i stands for the mark received by item i in class j.e) based on average grades computed per types of equipment a physical usage mark for the mixture of equipment inside the node entity can be computed according to:
∑
∑
= = ⋅ = 6 1 k k , OI 6 1 k k , OI k , eq _ avg PU WC WC G M (4)where MPU is the corresponding mark for the usage degree of equipment embedded in the node under survey;
WCOI,k stands for the operational importance weighting coefficient for equipment class k; Gavg_eq,k is the average grade for usage in the equipment class k.
Number of Faults
PRETRAŽIVANJE / SEARCH
ŠTAMPANJE / PRINT
Given the observation that the importance of faults is consistently determined by the type of equipment in which they occurred, different weightings will be associated to different faults, depending on the type of equipment they originated from. To be consisted with the previous section assumption the weightings presented in Table 1 will be preserved for this mark also.
Based on the representative sample for each equipment type mentioned in the classes from Table 1, one can compute the equivalent number of faults per each type of equipment via the ratio of recorded faults within the same equipment class sample and the number of items in the corresponding sample. All types of equipment in the distribution network will be ranked in the ascending order of the equivalent number of faults values. The number of faults mark will be attached to each type of equipment in this ranking on the scale from 1 to 100 such as the worst performing equipment type to receive the highest values.
After this stage an average grade for each equipment class could be computed in a similar manner as it was presented in equation (3), while the number of faults mark can be subsequently determined, based on the average grades per equipment classes and using the same equation (4) where MPU is replaced with MNF.
Unavailability Duration
Since the node entity consists of a number of equipment classes, which in turn contain several equipment types, it is quite expectable to have some kind of dependability of the unavailability duration on the equipment type that represents the origin of the unavailability. Therefore in determination of the mark associated to unavailability duration this discrimination has to be considered and for the sake of consistency the same set of weighting coefficients described in Table 1, based on operational importance of the equipment type, will be employed.
In quite a similar way as it was presented in the previous section an equivalent unavailability duration can be computed per each equipment type, provided a statistically sound set of samples is associated to each type of equipment encountered in the distribution network. The equivalent unavailability duration may result from the ration of the sum of unavailability periods cumulated for all items in the given sample to the number of items in the corresponding sample. It should be well understood that samples will be extracted for each equipment type.
According to the resultant unavailability duration per equipment type it is possible to rank these types, in ascending order, and associate to each of them a corresponding unavailability mark, on the scale from 1 to 100. The association should be done such as equipment types with smaller unavailability duration to get the smallest marks.
After this process has been completed, and each equipment type received its unavailability mark, an absolutely similar conduct as described in section concerned with ‘Equipment Physical Usage’ will be employed to produce the unavailability duration mark. Again as previously described, average grades for each equipment classes will be computed and at the end they will be combined, via the operational importance weighting coefficients of Table 1, to result into the final mark.
Associated costs
It is conceived that most of the costs to be associated across operational activity in the distribution networks are those originated from the fault occurrence and from preventive maintenance, which is the current strategy with most distribution operators in Romania. Therefore in order to accurately describe the associated costs for each equipment type in a given distribution network the following assumption is made: for every item in the representative sample associated to each equipment type one can collect information to fill in a table in the form summarized via Table 2.
Table 2. Associated costs for equipment item Equipment Recorded faults Preventive
maintenance Corrective maintenance Un-served energy penalties Dispatching expenditure Ej Fj1 CMj1 UEj1 Fj2 CMj2 UEj2 … … … Fjn CMjn UEjn PMTj CMTj UETj DETj
According to this hypothesis the associated cost to equipment Ej due to various faults and remedial/preventive activities across Tj observation period sum up as presented in:
(
)
∑
= + + + + + = n 1 i Tj Tj Tj Tj i, j i, j Tj , j CM UE PM CM UE DE AC (5) An average associated cost, taken across the whole sample extracted for a given equipment type, can be computed which will define the associated cost due to faults and routinely preventive maintenance for this equipment type. These values will allow ranking various equipment types based on associated costs, in ascending order. The mark for associated cost will be attributed, in the scale from 1 to 100, to the elements in this ranking. It is of capital importance to ensure consistency, i.e. equipment types with lower associated costs to receive lower marks.After each equipment type receives its deserved associated costs mark, then an average grade for each equipment class will be computed as in (3):
j n 1 i i, j j , avg n M G j
∑
= = (6) where Gavg,j is the average grade for j equipment class, while nj represents the number of equipment types considered in the j equipment class set and Mj,i is the associated costs mark obtained by j equipment type of class i.Based on average grades an overall associated costs mark for the node entity can be computed using an equation similar to (4):
∑
∑
= = ⋅ = 6 1 k k , OI 6 1 k k , OI k , eq _ avg AC WC WC G M (7)where MCA stands for the associated costs for the equipment embedded in the surveyed node entity.
NOTES:
1. Similar criteria are applicable to equipment of entities Transformers, Internal Services,
Compensation Devices and IT-Telecommunications, with the following resultant marks for technical condition:
• MTC_transf, for the technical condition of entity Transformers; • MTC_is, for the technical condition of entity Internal Services; • MTC_cd, for the technical condition of entity Compensation Devices; • MTC_IT-Tel, for the technical condition of entity IT-Telecommunications.
2. In the case one desires to compute the mark for the technical condition of a compounded power substation, MTC_subst, there is the following proposed approach to be used:
• determine the technical condition average grade for all nodes contained in the substation, Gavg_TC_node as arithmetic average of the technical condition marks associated to each node;
• compute the substation technical condition mark as:
Tel IT _ TC cd _ TC is _ TC transf _ TC node _ TC _ avg subst _ TC 0.60 G 0.15 M 0.10 M 0.05 M 0.10 M M = ⋅ + ⋅ + ⋅ + ⋅ + ⋅ − (8)
RELEVANCE FOR SECURE OPERATION OF THE DISTRIBUTION NETWORK
Each of the entities that have been mentioned in this paper bear certain significance in relation to safe operation of the distribution network under survey. Probably most of this impact is due to the node entities. Therefore it is important to establish a measure to allow one estimating the importance of a given node upon the secure operation of the overall distribution network
In order to grasp this feature of node entities it is proposed to use information normally supplied by software packages that explore the following sub-criteria:
- identification of nodes and connections that pertain to characteristic sections from the static stability point of view;
- definition of the technical importance of the node or connection.
a) connection relevance/importance. The importance mark, for steady state, stems from inspecting the impact of a contingency which takes out that connection from the network (under survey are possible overloading of remaining circuits, non-allowable loading regimes, etc.). The importance mark, for static stability, is determined via analysis of the
PRETRAŽIVANJE / SEARCH
ŠTAMPANJE / PRINT
influence each connection trip may have on the power transfers in the grid across characteristic sections.
b) Nodes relevance/importance. Usually it results as an average from the mark awarded based on the number of connections to the node and the mark obtained via analysis of the transient stability conditions when a short-circuit occurs in the node, correlated with the clearance time.
- undeliverable energy in power stations due to faults that occur in the substations/nodes or on connections that facilitate the link to the Transmission System Operator grid or to local distribution networks.
DISTRIBUTED ELECTRIC ENERGY
Taking into account the statement issued in the beginning of this work, the third relevant criterion to be considered in the process is represented by the distributed/delivered electric energy. It is customary to determine the mark associated to this criterion starting with the values of energy flow through the given entity (node or connection) for the previous year and with the forecasted energy flow for the coming period of one year, energy to be fed towards direct customers or other participants in the electricity market.
It is envisaged to award the following weighting coefficients to these two data:
o Observed Electric energy flow, measured, through each node or connection, across the previous year.
Weighting coefficient pOE -> 0.40.
o Forecasted Electric energy flow through each node or connection, estimated via computation of characteristic operation regimes for characteristic season and day.
Weighting coefficient pFE -> 0.60.
SENSITIVITY ANALYSIS
In order to establish the final marks for nodes or connections a possible option is to consider various sets of weighting coefficients attached to criteria taken into account in this multi-criteria analysis. Possible options are presented in Table 3.
Table 3. Possible sets of weighting coefficients Criterion Technical
Condition
Relevance for distribution network operation Distributed Electric Energy WS1 0.30 0.35 0.35 WS2 0.35 0.35 0.30 WS3 0.40 0.33 0.27 WS4 0.30 0.40 0.35 WS5 0.33 0.33 0.34 WS6 0.40 0.30 0.30
It seems that the most suitable set of weighting coefficients is WS 6 for the following reasons: o it comes with the maximum chance to deny points for recently re-engineered capacities; o ensures fair chances for re-engineering the less important substations.
CONCLUSIONS
Based on the methodology discussed in this paper it is conceivable to create a ranking/hierarchy of critical points within a given distribution network based on a selection of criteria mentioned above. It finally results into a single list that contains the points in the network ordered according to the criticality revealed by the chosen criteria for major actions of refurbishment.
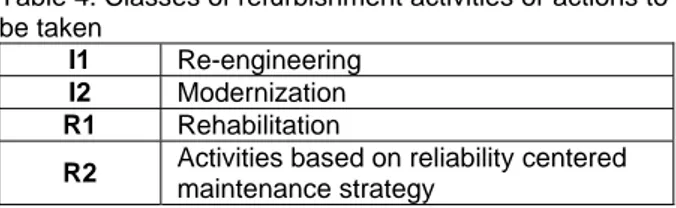
If one takes into consideration three major classes of refurbishment activities, presented in Table 4, there are possibilities to create action plans based on the entity position in the resultant hierarchy under two possible scenarios: having access to attracted funds (Table 4) and not having access to such funds (Table 5).
Table 4. Classes of refurbishment activities or actions to be taken
I1 Re-engineering I2 Modernization R1 Rehabilitation
R2 Activities based on reliability centered maintenance strategy
Table 5. Ranking of critical points in the distribution network and associated measures allocation, in absence of attracted funds.
Refurbishment activities or actions Position in hierarchy Class I1 I2 R1 R2 Top 10 % 0 ∗ (∗) (∗) Next 10 % of hierarchy 1 ∗ (∗) (∗) Next 10 % of hierarchy 2 ∗ (∗) Last 70 % of hierarchy 3 ∗ Table 6. Ranking of critical points in the distribution network and associated measures allocation when attracted funds become available.
Refurbishment activities or actions Position in hierarchy Class I1 I2 R1 R2 First 5 % (normally attracted funds) 0 ∗ (∗) Next 5 % of hierarchy 1 ∗ (∗) (∗) Next 10 % of hierarchy 2 ∗ (∗) (∗) Next 10 % of hierarchy 3 ∗ (∗) Last 70 % of hierarchy 4 ∗
To be more concise, actions marked in bold in the corresponding columns are those of first election. Depending on the availability of internal funding some of the critical points in a given class may be treated according to the second group or even third group of refurbishment activities or remedial actions.
By means of the proposed approach an objective tool to rank distribution network points in terms of their criticality judged on a multi-criteria analysis can be created and applied.
LIST OF REFERENCES
1. H. Rohsler, A. Strand, J.I. Rosales, F. Salamanca, 1998, “Expérience relative aux systèmes à maintenance basée sur l’état des matériels”, CIGRE, paper 23−103.
2. H. Rohsler, R. Ruhle, M. Waeber, A. Strand, 2000, “Management-system for design, construction and mainenance in high-voltage networks”, CIGRE, paper 23/39−06.
3. T.Orlowska, G. Balzer, M. Halfmann, C. Neumann, A. Strand, 2000, “Life cycle management of circuit-breakers by application of reliability centered maintenance”, CIGRE, paper 13−103.
4. D. Kopejtkova, H-P. Ott, H. Rohsler, F. Salamanca, J.J. Smit, A. Strand, P. Wester, 1996 “Strategy for condition based maintenance and updating of substations”, CIGRE, paper 23−104.
5. Y. Fushimi, N. Tokuda, T. Isozaki, T. Hara, 2000 “The multifunctional substation based on the novel assessment management”, CIGRE, paper 23/39−09.
6. S. Draber, E. Gelle, T. Kostic, O. Preiss, U. Schluchter, 2000 “How operation data helps manage lifecycle costs”, CIGRE, paper 23/39−02.
7. G. Balzer, O. Schmitt, A. Schneider, S. Gal, F. Balasiu, K. Bakic, 2002 “Life cycle assessment of substations: a procedure for an optimised asset management”, CIGRE, paper 23−302.
8. V. Biewendt, U. Christiansen, G. Friberg, F. Gallon, P. Kirchesch, Ph. Roussel, A. Schiemann, 2002, “Experiences with substation optimisation considering new technical and economical concepts”, CIGRE, paper 23−306.