LES CHANGEMENTS PROJETÉS DES CARACTÉRISTIQUES DES INONDA TI ONS DANS UN CONTEXTE MUL Tl-VARIÉ SUR LA RÉGION DE
QUÉBEC EN UTILISANT PLUSIEURS MRC DU PROJET NARCCAP
MÉMOIRE PRÉSENTÉ
COMME EXIGENCE PARTIELLE
DE LA MAÎTRISE EN SCIENCES DE L'ATMOSPHÈRE
PAR
MAI-lER BEN MANSO UR
UNIVERSITÉ DU QUÉBEC À MONTRÉAL Service des bibliothèques
Avertissement
La diffusion de ce mémoire se fait dans le respect des droits de son auteur, qui a signé le formulaire Autorisation de reproduire et de diffuser un travail de recherche de cycles supérieurs (SDU-522 - Rév.07 -2011). Cette autorisation stipule que «Conformément à l'article 11 du Règlement no 8 des études de cycles supérieurs, [l'auteur] concède à l'Université du Québec à Montréal une licence non exclusive d'utilisation et de publication de la totalité ou d'une partie importante de [son] travail de recherche pour des fins pédagogiques et non commerciales. Plus précisément, [l'auteur] autorise l'Université du Québec à Montréal à reproduire, diffuser, prêter, distribuer ou vendre des copies de [son] travail de recherche à des fins non commerciales sur quelque support que ce soit, y compris l'Internet. Cette licence et cette autorisation n'entraînent pas une renonciation de [la] part [de l'auteur] à [ses] droits moraux ni à [ses] droits de propriété intellectuelle. Sauf entente contraire, [l'auteur] conserve la liberté de diffuser et de commercialiser ou non ce travail dont [il] possède un exemplaire.»
recherche pour l'obtention de la maîtrise en sciences de l'atmosphère à l'UQÀM. Tout d'abord, j'adresse mes remerciements à ma professeme, Dr. Laxmi Sushama pour son encadrement et toute son équipe de recherche en particulier Dr. Dae Il Jeong qui m'a beaucoup aidé dans ma recherche.
Je tiens à remercier vivement ma femme Hadhemi Thlibi pour son soutien et sa patience dmant mes études sans oublier mon bébé Mohamed Adam pour ses beaux sourires qui m'ont encomagé à atteindre mon objectif.
Je remercie également mes parents Nomedine et Saïda, mon frère Marwan et ma sœur Marwa pom leurs soutiens malgrés 'les distances.
Enfm, je tiens à remercier tous les membres du centre ESCER pour leurs aides techniques et administratives.
TABLE DES MATIÈRES
LISTE DES FIGURES ... vii
LISTE DES TABLEAUX ... viii
LISTE DES ACRONYMES ... .ix
RÉSUMÉ ... xi
ABSTRACT ... xii
CHAPITRE! INTRODUCTION ... 1
CHAPITRE II PROJECTED CHANGES TO FLOOD CHARACTERISTICS (QUEBEC REGION) BASED ON THE NARCCAP MULTI-RCM ENSEMBLE AND MULTIVARIATE FREQUENCY ANAL YSIS APPROACH ... 9
2.1. INTRODUCTION ... 10
2.2. SIMULATIONS, OBSERVATIONS AND STUDY AREA ... 14
2.2.1 NARCCAP RCM simulations ... 14 2.2.2 Streamflow simulations ... 15 2.2.3 Observed data ... 15 2.3. METHODOLOGY ... 16 2.3.1 Reference grid ... 16 2.3.2 Flood risk ana1ysis ... 16 2.4. RESULTS ... 20 2.4.1 Basic statistics ... 20
2.4.2 Univariate analysis ... 23 2.4.4 Bivariate analysis ... 26 2.5. CONCLUSIONS ... 30
FIGURES ... 33 TABLEAUX ... 52 CHAPITRE III
CONCLUSION ... 54 RÉFÉRENCES ... 58
LISTE DES FIGURES
Figme Page
2.1 tudy area with location of selected CEHQ (Centre d'expertise hydrique du Québec) stream gauging stations.(Huziy et al.,2012, Jeong et al., 2014) .... 34
2.2 A schematic diagram showing flood characteristics (peak, volume and dmation) based on fixed threshold and base flow approaches. Hydrograph corre ponds to CEHQ station 40830 for the year 1996 ... 34
2.3 Biases in the (a) mean winter (DJF) snow water equivalent (in%) and (b) mean spring (MAM) 2-m temperatme (in °C) ... 35
2.4 Comparison of observed and modelled hydrographs (mean daily
streamflows ). The length of the observed record varies from 10 to 20 years within the 1970-1999 period. The values ofthe correlation coefficient (r) based on mean daily streamflow comparisons, station identification number is also shown ... 36 2.5 Mean of(a) peak, (b) volume and (c) dmation for RCM-NCEP (column 1),
RCM-AOGCMc (colmnn 2) and boundary forcing errors (column 3). Projected change is shown in column4 ... 39 2.6 5 year retmn leve] of(a) peak, (b) volume and (c) duration for RCM-NCEP
(column 1), RCM-AOGCMc (column 2) and Boundary forcing errors (column 3). Projected change is shown in column 4 ... .42
2.7 30 year· retmn leve] of (a) peak, (b) volume and (c) duration for RCM-NCEP (column 1), RCM-AOGCMc (colwnn 2) and boundary forcing errors (column 3). Projected change is shown in colwnn 4 ... .45
2.8 Joint occmrence probabilities for 5 years retmn level of (a) peak-volume, (b) peak-dmation and (c) volume-dmation (c) for RCM-NCEP (column 1), RCM-AOGCMc (colmnn 2) and boundary forcing errors (column 3). Projected change is shown in column 4 ... .48
2.9 Joint occunence probabilities for 30 years retmn leve] of (a) peak-volume, (b) peak-duration and (c) volmne-dmation for RCM-NCEP (colwnn 1), RCM-AOGCMc (column 2) and boundary forcing en·ors (column 3). Projected change is shown in column 4 ... 51
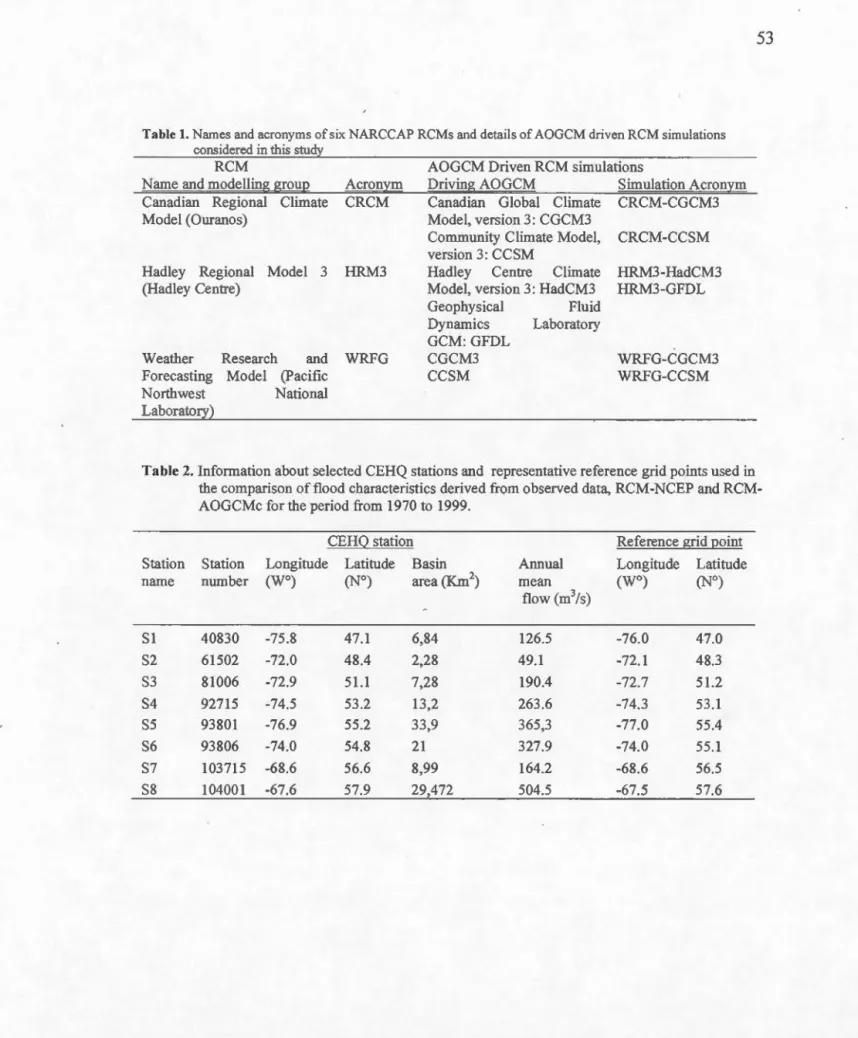
2.1 Nam es and Acronyms of Six NARCCAP RCMs and Details of AOGCM Driven RCM Simulations Considered in This study ... 53 2.2 lnf01mation about selected CEHQ stations and representative reference
grid points used in the comparison of flood characteristics derived from observed data, RCM-NCEP and RCM-AOGCMc for the period from 1970 to 1999 ... 53
AOGCM CCSM CRCM CGCM3 GCM GEV GFDL GIEC HadCM3 HRM3 IPCC MCG MCM MRC NCEP NARCCAP NCAO RCM SRES UQAM WRFG
LISTE
DES
ACRONYMES
Atmospheric-Ocean General Circulation Model
Comrnunity Climate System Model
Canadian Regional Climate Model
Canadian Global Climate Mode! version 3
Global Climate Model Generalized Extreme Value
Geophysical Fluid Dynamics Laboratory
Groupe d'experts Intergouvernemental sur l'Évolution du Climat Hadley Centre Coupled Mode!, version 3
Hadley Regional Mode! 3
Intergovernemental Panel on Climate Change
Modèle de Circulation Générale Million Cubic Meter
Modèle Régional du Climat
National Center for Environmental Prediction
North American Regional Climate Change Assessment Program National Center for Atmospheric Research
Regional Climate Model
Special Report on Emissions Scenarios Université du Québec à Montréal W eather Research & F orecasting
crues, c.-à-d le pic, le volwne et la durée, sont évalués pour 21 bassins versants situés
dans le Nord Est du Canada, couvrant principalement la province Québec. Plusieurs
modeles régionaux climatiques (MRC) d'ensemble proveneant du North American
Regional Climate Change Assessment Program (NARCCAP) sont utilisés. Trois
MRC sont considérés, pilotés par les ré-analyses II de Nationale Center of Environemental Prediction (MRC-NCEP), pour la période 1980-2004, et par quatre modèles de circulation générale de l'atmosphère-océan (MRC-MCGA) pour le climat present étalant sur la pèriode de 1971 à 2000 et le climat future pour la pèriode 2041 -2070. Une analyse de fréquence univariée pour chaque caractéristique d'inondation axée sur les niveaux de retour (5 et 30-ans) ainsi qu'une autre analyse bivariée dite copula basée sur les paires corrélés des caractéristiques des crues (c.-à-d pic-volume, pic-durée et volume-durée ) sont effectuées. Les erreurs de perfonnance des MRC provenant du parametrage dynamique et physique des modeles ainsi que les erreurs dues aux choix de forcage aux frontières par MCGA sont évaluées. En général, la
performance de MRC-NCEP varie d'un modele à un autre et depend fortement de
l'emplacement géographique des bassins visés. Les simulations MRC-MCGAs
presentent des configurations spatiales differentes pour les erreurs dues au forçage aux frontières dans chaque étape d'analyse des caractéristiques des crues: analyse satistique, univariée et bi-variée. Ceci depend essentiellement du choix de modèle de circulation générale pour le pilotage. Les MRC-MCGA suggèrent une augmentation future dans les valeurs moyennes, dans les niveaux de retom de 5- et 30-ans et dans les probabilités conjointes d'occunence des trois caractéri tiques des crues, avec quelques diffeérences entre les bassins versants et entre les différentes simulations des combinaisons des modèles.
Mots clés: changement climatique, modélisation climatique régionale, Copula,
ABSTRACT
In this study, climate change impacts on flood characteristics (i.e. peak, volume and duration) are evaluated for 21 northeast Canadian basins, covering mainly the Quebec province of Canada, based on a multi-Regional Climate Mode! (RCM) ensemble available through North American Regional Climate Change Assessment Program (NARCCAP). The set of simulations considered in tlils study includes simulations perfonned by three RCMs which are driven by National Centre for Environmental Prediction reanalysis II (RCM-NCEPs) for the 1980-2004 period and four Atmosphere-Ocean General Circulation Models (RCM-AOGCMs) for the current 1971-2000 and future 2041-2070 periods. The performance errors of RCMs due to internai dynamics and physics of the models are assessed by comparing streamflows generated from NCEP driven simulations with those observed on stations. A univariate frequency analysis of each flood characteristic corresponding to 5- and 30-yr retum periods as weil as Copula based bivariate frequency analyses for correlated pairs of flood characteristics (i.e. peak-volume, peak-duration and volume-duration) are evaluated and joined with the boundary forcing errors by comparing AOGCMs driven RCM simulations to those driven by NCEP. In general, the performance of RCM-NCEPs varies from one RCM to the other and strongly depends on the geographie location of each basin. Ail RCMs show different spatial behaviour of flood statistics and univariate and bivariate analyses which is due to the choice of the driving AOGCM. The analysis of RCM-AOGCMs for the future with respect to the current suggests an increase in the mean, marginal return levels and joint occurrence probabilities of flood characteristics with sorne differences noticed between basins, models and between different combinations ofRCMs and AOGCMs.
Keywords: Climate change; regional climate modelling; copula; floods
INTRODUCTION
Le changement climatique est un phénomène qui ne cesse de s'aggraver allumant le signal d'alerte par la communauté scientifique pour réagir et contrer ses effets sur la faune et la flore. En effet, le Groupe d'Experts Intergouvernemental sur l'Évolution du Climat (GIEC/IPCC), dans son cinquième rapport d'évaluation 2014, confirme ses inquiétudes concernant un réchauffement global, en cours et future, ce qui a affecté et affectera le cycle hydrologique. Le rapport prévoit une hausse de la moyenne globale de la température avec une augmentation de la précipitation en intensité et en fréquence. Ceci entraîne une accélération de la fonte de la neige ce qui peut engendrer des crues au début de la saison du printemps.
Ces changements peuvent avoir des impacts sur la couverture neigeuse, dont une diminution est prévue, ce qui promouvoir la fonte de la neige, en particulier dans plusieurs régions de 1 'Amérique du Nord. Tout cela peut conduire à un ruissellement plus important qui s'intensifie au début du printemps, comme indiqué dans Hanna et al., 2008; Cao et al., 2010 et Gosling et al., 2011, en se basant sur des modèles hydrologiques à l'échelle globale aussi bien qu'à l'échelle du bassin. A son tour, le changement de ruissellement peut affecter d'une manière significative la dynamique des crues dans les bassins fluviaux du Canada là où les débits élevés sont essentiellement générés par la fonte nivale (Thiémonge et al., 2015). Tous ces
2
changements, touchent sérieusement la société, conduisant à des énormes
répercussions environnementales, sociales et politiques. Par exemple, Hydra-Québec a indiqué que 96% de l'énergie totale produite dans la province de Québec est de
source hydrique, ce qui confmne l'omniprésence de l'eau dans l'économie de la
province (Hydra-Québec, 2013). Il est donc important d'étudier et d'évaluer les
changements subis par les événements extrêmes tels que les inondations, dans un
contexte de changement climatique, afin de favoriser une bonne gestion et adopter
les stratégies d'adaptation appropriée à l'échelle régionale.
Le changement climatique peut être dû, à la f?is, à la variabilité naturelle lié essentiellement à l'activité volcanique, la production solaire et l'orbite de la Terre autour du Soleil, soit à une activité humaine massivement émettrice en gaz à effet de serre. Depuis la révolution industrielle, l'impact de l'activité anthropique sur le climat devient de plus en plus visible, d'ailleurs c'est lui le facteur déterminant sur lequel se base les scénarios climatiques utilisés pour faire des projections future de système climatique. Depuis des décennies, la communauté scientifique ne cesse de développer ses outils et ses modèles pour reconstruire le systèmes atmosphère, terre et océan, et modéliser les liaisons complexes entre eux. Les modèles climatiques globaux avec leurs bilans d'eau et d'énergie fermés, avec ses composants représentants aussi bien
1 'atmosphère et la terre, sont considérés comme un outil éminent pour comprendre la
complexité du système à l'échelle globale. La limitation d'un modèle global vient de
sa faible résolution rendant la modélisation de certain processus hydrologique une
tache pas trop réaliste. D'où vient le modèle climatique régionale, ql,l'avec sa fine résolution offre une représentation des processus atmosphériques et de la surface
terrestre plus fiable surtout pour l'interaction teiTe-atrnosphère. Nombreu es récentes
études ont profité de la technique de la réduction d'échèle dynamique (downscaling), en utilisant les MRC piloté par un modèle global, pour évaluer les impacts de
Huziy et al., 2012; Clavet-Gaumont et al., 2012; Teutschbein et al., 2012; Tian et al.,
2013; Jeong et al., 2014; Bosshard et aL, 2014; Charlton et al., 2014).
Le cinquième rapport de GIEC projette, une diminution de 7 % de la surface du manteau neigeux de l'hémisphère Nord au printemps. Pour le Nord Est de l'Amérique
incluant le Québec, les scientifiques prévoient une augmentation de la température
moyenne annuelle de l'ordre de 2°C et une augmentation de 10% de la précipitation,
avec des différences entre les saisons, pour la période 2081-2100 en se référant à la période 1986-2005 et en utilisant 32 modèles CMIP5 ( Coupled Model Intercomparison Project) sous le scenario RCP2.6. Tous ces faits, favorisent le risque d'avoir des crues printanières plus intenses. Donc plusieurs études ont été menées
pour évaluer 1 'impact des changements climatiques sur les caractéristiques des débits de quelques rivières individuellement (e.g. Dibike and Coulibaly, 2007; Quilbé et al.,
2008; Minville et al., 2008; Saad et al. 2015). Alors que Huziy et aL, (2012) était
intéressé à l'étude des changements projetés aux différentes caractéristiques de débit
y compris les pointes de crue dans un cadre univariée sm la région nord-est du
Canada couvrant 21 bassins du Québec qui est la même région prise en compte dans cette étude. Huziy (2012) a montré que l'impact d'un phénomène d'inondation n'est
pas liée seulement à son débit de pointe mais aussi au volume et a la durée de l'évènement. Jeong et aL, (2013) a étudié l'impact du changement climatique sur les
trois caractéristiques des crues de printemps, à savoir pic de crue, le volwne et la durée, pom la même zone d'étude en utilisant l'approche de copula ( approche
multivariée) et les simulations du Modèle Régional Canadien du Climat (MRCC) et il
a approuvé que les trois caractéristiques sorlt étroitement corrélés deux a deux entre
eux.
L'analyse des résultats trouvés à partir d'un MRC doivent être pris avec précaution.
4
et al., 2014) liées à la formulation du modèle ( le choix du domaine, la paraméterisation, les processus physiques ... ), à la variabilité interne du modèle (
déclenchée essentiellement par les conditions initiales) et aussi à la dépendance aux forçage dans les conditions aux limites (choix de MCGA). Toutes ces erreurs doivent
être quantifiées pour assurer une bonne lecture des résultats obtenus. D'où vient
l'intérêt du cette étude qui s'intéresse a l'évaluation des changements projetées aux caractéristiques des crues printanières au Québec en utilisant plusieurs MRC
provenant du projet NARCCAP ( North American Regional Climat Change
Assessment Program). La zone d'étude couvre 21 bassins versants au Nord Est canadien, principalement situées dans la province du Québec et certaines parties dans l'Ontario et la Terre Neuve et Labrador au Canada. Cette zone a été. délimitée par
Hydro-Québec/Ouranos, et représente la plupart des principaux basins versants du Québec au nord du fleuve Saint Laurent et a 1 'ouest du Labrador.
Chaque MRC du projet NARCCAP est caractérisé par une grille spécifique différente
aux autres, avec une résolution spatiale horizontale de l'ordre de 50 Km avec des projections différentes. Les simulations des différents MRC adoptent le scénario
d'émission de gaz à effet de serre A2 qui est le scénario le plus pessimiste, en haut de peloton des scénarios d'émissions du SRES (Special Report on Emissions Scenarios)
publié par GIEC. A2 se caractérise par un accroissement continuel de la population et
des émissions des gaz à effet de serre, il semble être le scenario le plus raisonnable et
probable vu les efforts modestes pour lutter contre ce phénomène et les enjeux
politiques de la tâche. Chaque MRC est piloté par les ré-analyse NCEP et au moins un de quatre MCGA partenaires selon les exigences de NARCCAP. La résolution d'un modèle de circulation générale de l'atmosphère est de l'ordre de 300 km (dans le
cas de NARCCAP) ce qui rend la répresentation des bassins versants des rivières inadéquate.
Le recoms aux modèles régionaux du climat constitue un choix judicieux et bien justifié, afin de determiner les données de ruissellement utilisées pom deriver les débits d'écoulement ce qui rend l'étude beaucoup plus representative. Tel que indiqué précédemment, l'utilisation de MRC amène plusiems semees d'errems. Donc il faut qualifier et quantifier ses errems pom valider les modèles avant d'utiliser ses simulations. Pom se faire, une panoplie des observations est utilisée dans cette étude
à savoir: les données des débits quotidiens observés pom 8 stations de jaugeage repatties sm la région de Québec provenant de CEHQ (Centre d'expertise hydrique du Québec; http://www.cehq.gouv.qc.ca/). Ces stations de jaugeages sélectionnés sont dispersées sur la plupatt du domaine considéré, représentant diverses conditions hydrologiques allant des petits exutoires montagneux aux grandes surfaces du bassin versant principal.
Une autre variable impmtante pour les crues printanières est l'équivalent en eau de la neige, cette variable est fournie de Brown et al. (2003) et finalement la température
sous forme des données analysées par l'Unité de recherche climatique quadrillée (CRU2; Mitchell et Jones, 2005). L'utilité de ses observations est son utilisation pom quantifier l'errem de performance des modèles considérés. En effet, les observations de chaque variable ont été comparées avec les simulations corTespondantes, issues du MRC considéré, piloté par les ré-analyses NCEP pom la période commune entre les deux. La repartition des stations n'est pas uniforme dans l'espace et n'obèit pas à la régularité d'une grille d'un modèle. Pom remédier è cet obstacle une grille de référence a été choisie avec une résolution horizontale de 45 km qui a servit pom définir les masques des bassins versants au Québec. Cette grille a été utilisée dans plusiew·s études (huziy et al., Clavet-Goumont et al., Monette et al., Jeong et al.). Un autre défit dans la validation d'un modèle climatique régional est la quantification des errems dues aux choix de MCGA qui impose les conditions laterales du MRC. En
- - - -- - - -- -- - -
-6
d'autres mots, il faut déterminer la sensibilité d'un MRC au choix de pilotage extérieur. Dans cette étude, la quantification de cette sensibilité est effectuée en comparent les simulations de MRC pilotées par MCGA avec celles pilotées par NCEP.
Dans la plupart des études, l'évaluation des impacts des changements climatiques sur les caractéristiques des crues, a été entamée généralement en adoptant une approche tmivariée qui donne une information limitée de l'occurrence d'inondation (par
exemple Huziy et al, 2012; .. Clavet-Gaumont et al, 2012). Cependant, une inondation
est un événement multivariée caractérisé par son pic de pointe, son volume et sa durée (Chebana et Ouarda, 2009; Ben Aissia et al, 2011; Jeong et al, 2014). Par conséquent, il est raisonnable d'étudier les changements appréhendés sur les caractéristiques des crues d'un point de vue multivarié. Certaines techniques ont été développées pour modéliser les caractéristiques des crues multivariées comme une généralisation des distributions univariées (par exemple exponentielle bivariée (Favre
et al, 2002); Copula (Jeong et al, 2014)). Copula présente un outil adéquat pour la modélisation des fonctions des distributions conjointes a partir des distributions marginales univariées car elle permet la modélisation de la dépendance entre les variables corrélées (Parent et al., 2014). Nombreuses récente publications ont utilisé la théorie des copulas pour étudier les distributions multivariées de diverses variables hydrométéorologiques vu la flexibilité de cette technique (Song et al, 2010; Cahill et
al, 2011; Chowdhary et al, 2011; Zhang et al., 2011; Kwak et al, 2012; Jeong et al,
2014; Tong et al, 2014).
Il est important de noter que pour les bassins au nord-est du Canada, aucune étude n'a abordé les changements projetés sur les caractéristiques de crue , d'une manière systématique tel que présenté dan cette étude, en utilisant une approche multivariée
et en se basant sur des simulations d'ensemble provenant de plusieurs MRC du projet NARCCAP, afin d'évaluer les ince1iitudes liées à ces modèles.'
En bref, dans cette étude, une évaluation des impacts des changements climatiques
sur les caractéristiques des crues printanières de mars à juin pour 21 bassins versants
de la province de Québec en utilisant plusieurs modèles climatiques régionaux du projet NARCCAP, est effectuée pour une période de référence de 1971-2000 et une période de climat future visée de 2041-2070. Cette étude est basée sur une approche multivariée utilisant Copula. Les simulations utilisées proviennent du projet
NARCCAP et correspondent aux MRC suivants : CRCM (OURANOS 1 UQAM), le
HRM3 (Hadley Centre) et le WRFG (Pacifie Northwest National Lab 1 NCAR). Aux moments de la réalisation de cette étude, seules ces trois simulations fournjssent le ruissellent, qui est utilisé pour le calcul des débits à l'aide du schéma de routage
W ATROUTE. Les MRCs considérés sont pilotés par les ré-analyses NCEP ainsi que
quatre MCGA : le CCSM (NCAR), le CGCM3 (CCCMA), le GFDL (NOAA) et
HadCM3 (Hadley centre) pour la simulation du climat présent et futur. Un total de six
combinaisons des MRC-MCGA sont utilisées pour les projections climatiques et trois
simulations RCM-NCEP sont comparées avec les observations. Toutes les
simulations et les observations sont interpolées sur la meme grille dont la résolution est de 45x45 km.
Les principaux objectifs de cette étude sont:
• Évaluer et quantifier les erreurs de performance des MRCs en
comparent les variables simulées des crues (débits, EEN et la température),
avec celles observées.
8
•Effectuer l'analyse statistique des moyennes des caractéristiques des crues printanières (i.e. pic, volume et durée) et leurs niveaux de retour pour 5 et 30 ans.
• Analyser et quantifier les erreurs associées au choix de forçage aux frontières (pilotage) c'est-à-dire comparer chaque MRC-MCGA par rapport à la simulation de référence MRC-NCEP correspondante pour les
caractéristiques moyennes des crues, pour leurs niveaux de retour de 5-et 30-ans et pour leurs probabilités conjointes de présence en utilisant Copula.
• Estimer les changements appréhendés pour les caractéristiques
moyennes des crues, pour leurs niveaux de retour et pour leurs probabilités
conjointes de présence pour la période 2041-2070.
• Analyser et discuter les résultats obtenus.
Organisation du mémoire :
À la suite de 1 'introduction présentée ci-haut, un article rédigé en anglais fera office de chapitre II pour ce mémoire et remplacera donc les chapitres II
(méthodologie) et III (résultat) présents normalement dans un mémoire. Cet article comprend les sections suivantes: (1) l'introduction comprenant la revue littéraire et le
contexte de l'étude, (2) la description des modèles et du domaine, (3) la
méthodologie, ( 4) la présentation des résultats et (5) discussion et conclusion. Finalement, le chapitre III présentera les résultats de cette étude sous forme de
CHAPITRE II
PROJECTED CHANGES TO FLOOD CHARACTERISTICS FOR
NORTHEAST CANADA BASED ON THENARCCAP MULTI
-
RCM
ENSEMBLE AND MUL TIV ARIA TE FREQUENCY ANAL
YSIS
APPROACH
l * . 1 l
M. B. Mansour ' , L. Sushama, D. I. Jeong
1
Centre ESC ER (Étude et Simulation du Climat à l'Échelle Régionale), University of Quebec at Montreal, 201 Ave. President-Kennedy, Montreal, Quebec H3C 3P8,
Canada
'corresponding author address: Centre ESCER, Uruversité du Québec à Montréal,
201 Ave. President-Kennedy, Montreal, Quebec H2X 3Y7, Canada
---~~~~~~
-lü
2.1. INTRODUCTION
The fifth assessment report (ARS) of the Intergovernmental Panel on Climate Change (IPCC, 20 13) reported that observed global mean surface temperature has increased by 0.8S°C for the 1880-2012 period. ARS reported a likely increase in precipitation, in terms of frequency and intensity for the northern hemisphere (NH) mid-latitude land areas (Kbarin et al., 20 13). In addition, the report also documented an increase of global near surface and troposphere air specifie humidity since the 1970s and decrease of snow cover extent by about 0.8 x 10⁶ Km2 per decade for the same period in the northern hemisphere (Brown and Robinson, 2011 ), especially in spring (Stocker et al., 2013). For North America, a future increase in the intensity and frequency of precipitation is projected by Christensen et al. (2007) which is confmned by Collins et al. (2013), accompanied by an increase of temperature, particularly over high-latitude regions. These increases can have an impact on the snow season length and on the snow depth that are expected to decrease over most of North America. Ail this could lead to an earlier and larger spring runoff, as noted in Hanna et al. (2008), Cao et al. (20 1 0), and Gosling et al. (20 11), based on global and basin-scale hydrological models. These changes in spring nmoff can significantly affect flood dynamics in the Canadian river basins where high flows are essentially generated due to spring snowmelt (Mareuil et al., 2007). Such changes impact society and can cause enormous environmental, social, and political repercussions. For instance, Hydra-Québec reported that 96% of the total energy produced in the province of Quebec is hydro-based and therefore stability of water resources is very important to the economy of the province (Hydra-Québec, 2013). It is therefore important to investigate projected changes to the characteristics of extreme events such as floods in the context of a changing climate to support proper management and adaptation strategies at regional scale.
Atmosphere Ocean Global Climate Models (AOGCMs), with their complete closed
water budget including both the atmospheric and land surface branches, are the
comprehen ive tool used to generate information about present and future climates
following various scenarios proposed by IPCC. For instance, AOGCM simulations
can be used to understand better the linkages and feedbacks between climate and hydrological systems, and to evaluate the impact of climate change on various hydro-meteorological variables. However, AOGCMs, because of their coarse resolution,
have difficulties to simulate extreme weather events with the intensity and frequency
comparable to what is observed, particularly precipitation extremes (Wehner, 2010
and Orlowsky et al., 2011). Regional Climate Models (RCMs) can overcome this limitation by offering higher spatial resolution compared to AOGCMs, allowing
greater topographie realism and finer-scale atmospheric dynamics to be simulated and
thereby better represent extremes at local and regional scales. Many recent studies
have used RCMs to evaluate projected changes to various components of the hydrological cycle including mean, seasonal and extreme flows in their studied
regions ( e.g. Huziy et al., 20 12; Clavet-Gaumont et al., 20 12; Teutschbein et al., 2012; Charlton et al., 2012; Tian et al., 2013; Jeong et al., 2014; Bosshard et al., 2014).
RCMs are associated with various sources of uncertaintie (Bosshard et al., 2014),
including (1) structural uncertainty associated with model formulation (e.g., domain
size and location, physical processes and parameterization), (2) internai variability
(triggered by differences in the initial conditions), and (3) dependence on lateral
boundary forcing (i.e., choice of the AOGCM). To evaluate these uncertainties, the use of multi-RCM ensemble becomes indispensable. The North American Regional
Climate Change Assessment Program (NARCCAP) (Meams et al., 2013; Khaliq et
12
Assessment of climate change impacts on flood characteristics has been generally
studied based on a univariate approach, which provides only limüed information
about the probability of flood occurrences (e.g. Huziy et al., 2012; Clavet-Gaumont et al., 2012). However, a flood is a multivariate event characterized by its peak, volume and duration (Chebana and Ouarda, 2009; Ben Aissia et al., 2011; Jeong et al., 2014). Therefore, it is reasonable to study ' changes to flood characteristics from a
multivariate viewpoint. Sorne techniques have been developed to madel multivariate
flood events as a generalization of the univariate approach, e.g. bivariate exponential
distribution (Favre et al., 2002); copula based bi- and trivariate analyses (e.g. Karmakar and Simonovic, 2008; Jeong et al., 2014). Many recent studies have used
copula approaches to investigate multivariate distributions of various hydro-meteorological variables, due to their flexibility (Song et al., 201 0; Cahill et aL, 2011;
Chowdhary et al., 2011; Zhang et al., 2012; Kwak et 'aL, 2012; Jeong et al., 2014;
Tong et al., 20 14; Jiang et al., 20 15). Therefore, Copula based multivariate framework is a reasonable approach for modelling joint distribution functions from
univariate marginal distributions as it allows modelling the dependence between two
or more correlated variables (Parent et al., 2014)
This study is focused on the province of Quebec which plays a significant role in the
Canadian economy due to its large number of hydroelectric power generating
stations. According to the ARS (IPCC, 2014), eastern North America including middle and southem parts of Québec is projected to experience an increase in the annual mean temperature of the order of 2°C and precipitation by 10% under the
RCP2.6 scenario based on 32 CMIP5 (Coupled Madel Intercomparison Project Phase
5) simulations for the 2081-2100 period with respect to the 1986-2005 period. For this region, sorne previous studies have been performed to investigate changes to
streamflow characteristics for few individual river basins (e.g. Dibike and Coulibaly,
al. (2012) studied projected changes to various streamflow characteristics including flood peaks in a univariate setting over the entire northeast Canadian region, covering ail Quebec basins, which is also the region considered in this study. Also, Jeong et al.,
(2013) studied the impact of climate change on three spring flood characteristics (i.e.,
flood peak, volume and duration) for the same study area using the multivariate
copula approach and the Canadian Regional Climate Model simulations. It is
important to note that for the northeast Canadian basins, no study has addressed so far projected changes to flood characteristics within a multivariate setting using a
multi-RCM ensemble.
In this study, projected changes to three spring flood characteristics (i.e., flood peak,
volume and duration) within a multivariate framework, for 21 northeastern Canadian
basins using multi-RCM ensemble, which pennits evaluation ofvarious uncertainties,
are assessed. A set of six simulations from three RCMs for current (1971-2000) and
future (2041-2070) climates, driven by four different AOGCMs, are considered. To
assess projected changes NCEP (National Center for Environmental Prediction)
driven RCM simulations are compared to observations for assessing performance
en·ors. Conventional univariate frequency analysis is performed for individual flood
characteristics and copula based bivariate frequency analyses for three pairs of flood
characteristics (i.e., peak-volume, peak-duration and volume-duration).
This paper is organized as follows. In section 2, RCM simulations as weil as observed streamflow, temperature and snow water equivalent (SWE) data are presented.
Section 3 is devoted to the methodology adapted for assessing the perfonnance of
RCMs, as well as evaluation of projected changes to flood characteristics. Detailed
results of the study are presented and discussed in Section 4 and main conclusions are
14
2.2. SIMULATIONS, OBSERVA TI ONS AND STUDY AREA
2.2.1 NARCCAP RCM simulations
Flood characteristics are derived from the multi-RCM simulations available through
NARCCAP. All RCMs have been driven by NCEP reanalysis II and two distinct
AOGCMs over the North American domain covering Canada, USA and most of
Mexico for the IPCC's Special Report on Emissions Scenarios (SRES) A2 scenario.
It is important to note that ail RCMs use different projections but the same horizontal
resolution of 50 km. Detailed description of model characteristics is available from
NARCCAP (www.narccap.ucar.edu/data!rcm-characteristics.htrnl), Meams et al.
(2009), and also from the individual modelling group's website.
This study employs simulations from three RCMs (i.e. CRCM, HRM3 and WRFG),
which provide runoff needed to generate streamflow, driven by NCEP reanalysis II
and fow· AOGCMs (i.e. CCSM, CGCM3, HadCM3 and GFDL). Table 1 shows
acronyms and full names of various RCM-AOGCM pairs: CRCM and WRFG are
driven by CCSM and CGCM3, and HRM3 is driven by HadCM3 and GFDL. The
NCEP-driven simulations are available for the 1980-2004 period, while the
AOGCM-driven simulations are available for the current 1971-2000 and futme
2041-2070 periods. The NCEP-driven simulations are used to assess performance
en·ors associated with streamflow hydrographs and spring flood related variables,
while AOGCM-driven cmrent and futme period simulations are used in the
assessment of projected changes to flood characteristics. Throughout this article,
different RCM simulations will be refened to as 'RCM-LBC', where RCM refers to
the acronym of the RCM and LBC to the respective lateral boundary condition, i.e., NCEP or the AOGCM driving the regional madel at the boundaries.
2.2.2 Streamflow simulations
This study focuses on the Northeastern part of Canada, which consists of 21 watersheds located mainly in the Quebec province of Canada (Figure 1). Runoff values simulated by RCMs are used to generate streamflow based on a modified version of the W A TROUTE rou ting scheme, following Poitras et al. (20 11). The routing scheme is based on a cell-to-cell routing framework. Flow directions, river lengths and their slopes employed in the routing scheme are estirnated based on HydroSHEDS data (Lehner et al., 2008; Huziy et al., 2012). Poitras et al. (2011) provide detailed description on streamflow calculation from RCM-simulated runoff.
2.2.3 Observed data
Observed daily streamflow data from 8 gauging stations for the Québec regiOn (Figme 1) are obtained from CEHQ (Centre d'expertise hydrique du Québec; http://www.cehq.gouv.qc.ca/) dataset. Information about the gauging stations (i.e.,
location, representative drainage area, and annual mean flow) is provided in Table 2. These selected stations are scattered over most of the study domain, representing various hydrological conditions ranging from small mountainous basin outlets to large basin main stream outlets, with drainage areas ranging from 2.28 to 33.9 km2 and annual mean flow from 49.1 to 504.5 m3/s.
Observed dataset of SWE is obtained from Brown et al. (2003). This dataset was produced by applying the snow depth analysis scheme developed by Brasnett (1999) to generate a 0.3° latitude/longitude grid of daily and monthly mean snow depth and corresponding estimated water equivalent for North America. This observational dataset was produced for the 1979- 1997 period. The gridded Climatic Research Unit
16
(CRU2; Mitchell and Jones, 2005) dataset is used to validate simulated temperature in this study .
2.3. METHODOLOGY
2.3.1 Reference grid
In arder to ensure a better companson between different RCM simulations, a reference grid is highly desirable. The selected reference grid has a horizontal resolution of 45 km and polar-stereographie projection. This grid has been used in a number of previous studies across Canada. Before perfonning any analysis, all model-simulated data were interpolated to this reference grid using the inverse distance squared method (http://www.ncl.ucar.edu/), while the observed data were aggregated to the same reference grid.
2.3.2 Flood risk analysis
2.3 .2. 1 Identification of flood characteristics
A flood event can be characterised by its peak, volume and duration as illustrated in Figure 2. A fixed threshold approach is used in this study to determine flood characteristics. This approach assumes a threshold discharge and considers upper part of the hydrograph as a flood event (Grimaldi and Serinaldi 2006; Kannakar and Simonovic 2008; Jeong et al., 20 14). Besides the flood peak, a flood event is also characterized by its duration which is identified by detennining time points corresponding to rise in discharge from the threshold (start date) and return to threshold (end date) as shawn in Figure 2 (Kannakar and Simonovic, 2008). The associated flood volume is detennined by removing the ba e flow from the total volume of streamflow over the flood duration. For the present work, following Jeong
et al. (2014), the fixed threshold i taken as l.3!J., where Il- is the mean annual streamflow. There is a greater possibility for the base flow to be included in the identified flood event if too small a threshold is selected. On the other hand, a very
large threshold will result in the exclusion of large amounts of flood flow volwne. Jeong et al. (20 14) selected l.3!J. threshold as it pro vides a reasonable compromise to
address the above mentioned contrasting extreme conditions. In addition, this
threshold is also found suitable for,all observation stations and CRCM grid points in
the study area.
2.3.2.2 Marginal and joint distributions
Marginal frequency analysis is developed on the basis of sea onal maximum values of flood characteristics. Following results of Jeong et al. (2014), the Generalized Extreme Value (GEV) distribution is used to model marginal distributions of the three flood characteristics. From these marginal distributions, a bivariate distribution
function is developed following the copula approach.
The copula theory has been used to construct joint distributions of multiple variables by connecting multivariate probability distribution to its one-dirnensional marginal probability distribution functions (Nelsen 1999). Let X and Y be two random
variables with the marginal cwnulative distribution functions (CDFs) Fx and Fr, the joint cwnulative distribution function of (X, Y), F xr(x, y), can be expressed as:
Fxy(x,y) = C[Fx(x), Fy(y)] (1)
where C is a bivariate copula of (X, Y). If Fx(x) = u and Fr(y) =v, the expression (1) can be written as follows:
18
C(u, v)= FXY[Fi1 (u), Fi1(v)], (u, v) E [0,1]2 (2)
where Fx-1 and Fi 1 are generalized inverses of Fx and Fr, respectively.
Nelsen (1999) suggested a number of copula families (e.g., Archimedean, elliptical
and extreme value) to construct multivariate probability distribution functions. For
hydrological studies, the Archimedean copula family offers many advantages (Zhang
and Singh 2006): the Archimedean family is easy to construct and numerous copula
models belong to this class (McNeil and Neslehovà 2009). Furthennore, this family is
also applicable for both positively and negatively correlated variables. Sorne
Canadian studies have used this family for single-site bivariate flood frequency
analysis ( e.g. Favre et al. 2004; Aissia et al. 2011; Karmakar and Simonovic 2009). A
bivariate Archimedean copula can generally be expressed as:
Ce(u, v)= 0-1[0(u)
+
0(v)] (3)where subscript 8 of copula C is parameter hidden in the generating function ~· For
the Archimedean copula, () can be determined from the relationship between KCC
(Kendall's correlation coefficient) rand generating function ~(t), which is defined by
r = 1
+
4J.
01 0
,(t) dt (Karmakar and Simonovic, 2009), where t = u or v. The KCC r
0 (t)
is a well-known nonparametric measure of dependence between any two (X and Y)
random variables. In this study, the Archimedean Clayton copula is used following
Jeong et al. (2014). The equation, generating function ~(t) and relationship between () and r for this copula are respectively given by:
-1
C8(u,v) = [u-8
+
v-8 -1]8 () E (O,oo) (4)0(t) =
c
8 - 1 (5)()
In this study, a joint occmTence probability is investigated which is defined as the probability of both X and Y exceeding simultaneously their respective thresholds, i.e. P(X >x and Y> y). Here x and y denote the values of X and Y corresponding to a
selected return period. Following Yue and Rasmussen (2002) and Liu et aL (2011 ),
this probability is f01mulated as:
P(X >x and Y> y)= 1-Fx(x)- Fy(y)
+
Fxv(x,y)= 1- Fx(x)- Fy(y)
+
C[Fx(x), Fv(Y)] (7)For both x and y, flood peak, volume and duration corresponding to 5- and 30-year return periods for the current climate are used. The joint occuJTence probabilities of peak-volume, peak-dmation and volume-duration pairs for the current climate and their projected changes for the futme climate are studied. The joint occurrence probability P(X > x and Y> y) for an r-year return period is denoted by P,..
2.3.2.3 Performance and lateral boundary forcing Errors
Sirnulated temperatme and SWE from the RCM-NCEP simulations and streamflows
generated from the W A TROUTE model are compared to those observed, to assess performance en·ors, i.e., errors due to the internai dynamics and physics of each RCM. The lateral boundary forcing en·ors are also assessed by comparing flood characteristics derived from RCM-AOGCM simulations, for the CUITent 1980-2000 period, to those detived from RCM-NCEP simulations for the same time period.
20
2.4. RESUL TS 2.4.1 Basics statistics 2.4.1.1 Assessment of errors
a) Perfmmance errors
Biases in winter (DJF) SWE are estimated by comparing mean winter SWE from CRCM, HRM3 and WRFG simulations driven by NCEP reanalysis with those from the gridded North American SWE data from Brown et al. (2003) for the 1980-1997 period (Figure 3a). For CRCM-NCEP, positive performance errors are noted for most part of the domain, with the magnitude of errors increasing from south to north. The spatial pattern of the performance en·ors for HRM3-NCEP appears to divide the study area into two parts: positive for northern half and negative for the southern half of the ·
domain. WRFG-NCEP underestimates observed SWE for most of the considered watersheds, except those located in the very north. HRM3 and WRFG underestimate win ter SWE for the sou them part of the domain. This fact could imply reduced winter runoff and streamflow over this region. Spring (MAM) temperature biases presented in Figure 3b are estimated by comparing mean temperature from CRCM, HRM3 and WRFG simulations driven by NCEP with those from the gridded Climatic Research Unit (CRU2; Mitchell and Jones 2005) data for the 1980-1999 period. These results suggest an overestimation of temperature by ali three simulations for the central and northern regions, with the biases being larger for CRCM and HRM3. An
underestimation of spring temperature is noted for southern basins by ali RCM simulations.
Observed and modelled hydrographs (mean daily streamflows) are compared at the selected stations in Figure 4. The modelled hydrographs are derived from CRCM-NCEP, HRM3-NCEP and WRFG-NCEP simulations. There are large differences
between observed and modelled hydrographs both in the magnitude and timing of peak flows, which can partly be explained by the biases in the winter SWE and spring temperature of the RCMs. For instance, CRCM-NCEP generally yields larger and early peaks compared to the observations for the northem stations 104001, 93801,
93806 and 103715. These results can be explained by the overestimation of winter SWE for the upstream regions and positive biases in the spring temperatures for these stations. However, CRCM-NCEP underestimates flood peak magnitudes for the central gauging stations (i.e., 81006, 92715, and 61502). Streamflows generated from HRM3-NCEP and WRFG-NCEP simulations underestimate observed flood peak magnitudes for the southern gauging stations 40830, 61502 and 81006 during the
spring period. This negative bias can be attributed to the underestimation of winter SWE by this models for southern basins mentioned before, which affect spring flood peak. In general, for ali basins and for the three RCMs, simulated peaks occur earlier than observed. This behaviour is believed to be due to the positive temperature biases
(Figure 3b) during spring (MAM). b) Boundary forcing errors
Boundary forcing errors are assessed by comparing mean spring flood characteristics derived from AOGCM-driven simulations with those from NCEP-driven simulations for the 1980-2000 period. Results shawn in Figure Sa suggest that the spatial patterns of mean peak flows are about similar for RCM-NCEPs and RCM-AOGCMs. Positive boundary forcing errors are noted for mean peak flows simulated by CRCM-CGCM3 and CRCM-CCSM for the entire Quebec region, except for small negative errors
shawn by CRCM-CCSM for one south-western watershed. For HRM3, mean peak flood from AOGCM-driven simulations are larger than those from NCEP-driven simulations for the central regions. A clear disagreement between HRM3 simulations driven by two AOGCMs for southern watersheds can be noticed; HRM3-GFDL
22
shows negative errors while HRM3-HadCM3 shows small positive errors. Most
watersheds located in the north and central parts show positive boundary forcing
errors for WRFG-CCSM and WRFG-CGCM3. Overall, lm·ger errors are associated
with CRCM-CCSM and HRM3-HadCM3 and smaller errors with HRM3-GFDL. lt
should be noted that the influence of the driving AOGCM on the mean peak flow is
considerable. In fact, for each RCM, simulations driven by two different AOGCMs
exhibit very different behaviours for a number of watersheds.
Based on the results shown in Figure 5b, mean flood volumes generated by RCM
-NCEPs are about similar to those generated by RCM-AOGCMs. Larger boundary
forcing errors are associated with CRCM-CCSM and WRFG-CGCM3, compared to
other RCM-AOGCM combinations, where positive errors are noted for most of the
watersheds. Mean flood volumes for all RCM-AOGCM simulations are larger than
those for NCEP-driven simulations for the northem basins, except for
HRM3-HadCM3. Negative boundary forcing errors are noted for the southem basins for
HRM3-GFDL. It is notable that spatial patems of the boundary forcing errors of RCM-AOGCM simulations for the flood volume are simlar to those for the flood peak presented in Figme 5a. The comparison between mean flood duration values
simulated by RCM-AOGCM arid those simulated by RCM-NCEP suggest, as shown
in Figure 5c, positive boundary forcing errors (larger than 20%) for
CRCM-AOGCMs and WRFG-AOGCMs for almost the entire study domain.
HRM3-AOGCMs show positive errors for the central basins and negative errors for the
c) Projected changes
Projected changes to the mean values of flood characteristics are obtained by
comparing flood characteristics simulated by RCM-AOGCMs for future period to
those for the current period. In Figure S, mean values of flood characteristics for the RCM-AOGCMs for the current climate are shown in the second column and their
projected changes are shown in the fowth column. For the flood peak (Figure Sa), an
increase in futme mean peak flow is suggested by CRCM-CCSM, HRM3-AOGCMs
and WRFG-CCSM for the central and southem basins. CRCM-CGCM3 and
WRFG-CGCM3 generally suggest an increase in future peak flow, except for sorne southern
basins. For the flood volwne (Figure Sb), an increase in the mean flood volume is
expected in the future climate, mainly for the western basins based on
CRCM-AOGCMs, HRM3-HadCM3 and WRFG-CCSM. However, rest of the mode!
imulations project an increase in the future for the eastern regions. It is noted that the largest increase is simulated by CRCM-CCSM. A future increase in the mean flood duration is simulated by most of the models for the entire domain, particularly for the
central and southern basins with large values associated with WRFG-CCSM (Figure
Sc).
2.4.2 Univariate analysis
2.4.2.1 Boundary forcing errors
Lateral boundary forcing errors for S- and 30-year retwn levels of the three flood characteristic are shown in Figmes 6 and 7. Results of S-year return levels of flood peak (Figme 6a) suggest that retum values of AOGCM-driven simulations are
considerably larger than those of NCEP-driven simulations for most of the
watersheds and for most RCM-AOGCMs, except for CRCM-CCSM, which shows
24
boundary forcing enors are relatively larger for HRM3 and WRFG compared to
CRCM. For the 30-year retum levels of flood peaks (Figure 7a), the differences
between NCEP-driven and AOGCM-driven RCM simulations are similar to those of
5-year return levels in tenns of spatial pattem of errors, with larger values associated with the 30-year retum levels. The influence of the driving AOGCM is obvious for CRCM and WRFG as they show large differences for this statistic based on their
driving AOGCMs. Larger boundary forcing errors are associated with
WRFG-AOGCMs and CRCM-CGCM3 compared to the other models.
The behaviour of boundary forcing errors associated with the 5-year retum levels of flood volume (Figure 6b) is comparable to that of flood peak with larger values for
the latter characteristic. RCM-AOGCMs produce larger values than RCM-NCEPs for
most of the regions, except for CRCM-CCSM, which suggests small negative
differences for the southem and east-central basins. Lru·ger boundary forcing enors
are associated with CRCM-CCSM and HRM3-GFDL compared to the other
RCM-AOGCM combinations. Similar differences for the 30-year retwn levels of flood
volume are found for NCEP-driven and AOGCM-driven simulations (Figure 7b).
Small boundary forcing errors ru·e associated with HRM3-AOGCM simulations,
whereas large errors are associated with WRFG-CCSM.
For the flood duration associated with 5-year retum levels (Figure 6c), positive
boundruy forcing errors are noted for most of the model combinations and for most of
the basins with larger enors associated with HRM3-AOGCMs compared to the other
mode! combinations. The comparison between 30-year return levels of flood duration
simulated by RCM-AOGCMs and those simulated by RCM-NCEP (Figure 7c)
suggest large positive boundary forcing errors (larger than 30%) for most of the
RCM-AOGCM combinations analysed. lt should be noted that the influence of the
considerable as the lateral boundary forcing errors could differ in magnitude across
various basins for all RCM-AOGCM combinations. It is also important to note that
larger values of boundary forcing errors in 5- and 30-year retum levels are associated
with flood duration compared to flood peak and volume. Boundary forcing errors
associated with the 30-year return levels of three flood characteristics are larger than
those associated with the 5-year retum levels.
2.4.2.2 Projected changes
Future projected changes to 5- and 30-year return levels of flood characteristics are
shown in the fourth column of Figures 6 and 7. For the 5-year retmn levels of flood
peak, the CRCM-AOGCMs project a small increase (Jess than 20%) for the central
and southem basins. HRM3-AOGCMs and WRFG-CCSM suggest a decrease in
future return levels of flood peak for severa] southem basins. The results shown in the
fourth column of Figure 6b suggest future increases in the 5-year return levels of
flood volume based on sorne RCM-AOGCMs for the majority of the grid points in
the study area. HRM3-AOGCMs and WRFG-CCSM project a future decrease for
severa] southern basins, which is consistent with the projected changes in the 5-year
retum levels of flood peak. It should be noted that the percentage of projected
changes in the 5-year retum levels of flood volume are larger than those of flood peak
for the same return period and this can be due to the future increase in the 5-year
return levels of flood dmation. Results of projected changes in the 5-year return
levels of flood duration (Figure 6c) show an increase in future for most of the basins
and models. Larger increase (large than 40%) is projected by ali models for the
central and northern regions.
The spatial pattern of future changes to the 30-year return levels of flood peak (Figure
7a) is similar to that of the 5-year return levels with larger errors for the 30-year
26
the west central basins but no significant changes for the rest of the domain except
some southern basins, where a decrease is projected by WRFG-CCSM. CRCM
-AOGCMs and HRM3-AOGCMs suggest positive changes for most of the basins. It is
noted that largest changes are associated with CRCM-CGCM3. For the 30-year return levels of flood volume, a future projection which is consistent with that of the 5-year return leve! is shown in Figure 7b. CRCM-AOGCMs, HRM3-HadCM3 and WRFG-CGCM3 proj ect a larger increase (larger than 20%) for most of the grid points of the study area, while HRM3-GFDL and WRFG-CCSM suggest a future decrease for some southern watersheds and an increase for the central and northem basins. For the
flood duration, a future increase in the 30-year return levels for most of the
watersheds is simulated by most of the RCM-AOGCM simulations. It is important to
note that the estimation of marginal 30-year retum values is more uncertain than the 5-year return levels.
2.4.3 Bivariate analysis
2.4.3.1 Boundary forcing errors
The boundary forcing errors associated with the joint occurrence probability for the
flood peak-volume pair corresponding to 5-year return leve! (third column in Figure
8a) generally show positive errors for the six simulations for most of the study region, except WRFG-AOGCMs which show some negative errors for severa! southem basins. Large boundary forcing errors are associated with WRFG-AOGCMs, whereas
small errors are associated with CRCM-CCSM. The joint occurrence probability of the peak-volume pair for the 30-year retum level (third colwnn in Figure 9a) simulated by CRCM-AOGCMs shows positive boundary forcing errors for the
northem watersheds. The pair of HRM3-AOGCMs shows positive boundary forcing
errors for the joint occurrence probability corresponding to 30-year return period
thresholds of peak-volume pair for most grid points of the study domain.
WRFG-CCSM and WRFG-CGCM3 show positive errors for the entire domain with sorne
southem basins associated with negative errors. Larger boundary forcing errors are
associated with WRFG-AOGCMs compared to the other simulations.
For the peak-dw-ation pair of flood characteristics (Figure Sb), results of joint
occurrence probability corresponding to 5-year retw-n period threshold show large
values for RCM-AOGCMs compared to those for RCM-NCEPs for a large number of
watersheds. CRCM-CCSM and CRCM-CGCM3 show positive boundary forcing
errors for the entire study domain. The HRM3-AOGCM and WRFG-AOGCM
simulations pairs produce larger joint occurrence probability (more than 20%) than
their NCEP driven simulations for the 5-year retl.ll11 level. Joint occw-rence
probability of CRCM-AOGCMs for the peak-dw-ation pair of 30-year retum level
shows positive boundary forcing errors for most of the watersheds. HRM3-AOGCM
and WRFG-AOGCM show positive differences for most of the grid points of the
domain with sorne negative errors dispersed across sorne basins, especially for
northem basins based on simulations of WRFG-AOGCMs pair and central basins
based on HRM3-GFDL simulation. Smaller boundary forcing en·ors are associated
with CRCM-AOGCM.
For the flood volume-dw-ation pair corresponding to 5-year return level (third column
in Figw-e Sc), WRFG-CGCM3 suggests positive boundary forcing errors for most of
the studied basins. CRCM-AOGCMs show negative bias for the eastern and southern
basins, while HRM3-AOGCMs do not show any specifie spatial pattern as positive
and negative errors are noted over the study area. CRCM-CCSM shows positive
28
return levels of volume-duration pair (third column in Figw-e 9c), for most of the watersheds except the central eastern basins where it shows negative bias. CRCM-CGCM3 shows positive errors for the central and southem basins and negative errors
for the remaining basins, while HRM3-AOGCMs and WRFG-AOGCMs provide
positive err ors for most of the basins. 2.4.3.2 Projected changes
Projected changes to joint occurrence probability of flood characteristics are assessed by comparing RCM-AOGCM simulated values for the current 1971-2000 and future 2041-2070 periods. These changes are shown in the fourth colurnn of Figures 8 and 9 for 5- and 30-year retum levels, respectively. For both current and future periods, joint occurrence probability P is calculated using thresholds estirnated from the marginal distributions for the current climate as presented in the methodology section.
For the peak-volume pair, corresponding to 5-year retum level (fourth colurnn in Figure 8a), larger increases in P for the central and southern basins, smaller decreases for the north-eastern basins are suggested by CRCM-CCSM and CRCM-CGCM3
simulations. HRM3-AOGCMs and WRFG-CCSM suggest future increases (Jess than
20%) for the majority of the basins, while WRFG-CGCM3 suggests future values of P relatively similar to those in the current period for the west-central regions and future increases for the rest of the domain. For the joint occurrence probability conesponding to 30-year retum level (fowih colurnn in Figme 9a), the pattern of the projected changes is similar to that for the 5-year retum level. CRCM-AOGCMs and
HRM3-AOGCMs suggest an increase in the joint occwTence probability of
peak-volume pair associated with the 30-year retmn level for most of the basins, while WRFG-AOGCMs produce increases for the entire region, except the west central basins where simulations project near normal values of P.
Results of projected changes to the joint occurrence probability corresponding to
5-year retum level of peak-duration pair are consistent with the conesponding results projected for the 5-year retum level of peak-volume pair. CRCM-AOGCMs suggest a future increase in the statistic for the central and southem basins while a future
decrease for few north eastern basins is suggested by CRCM-CCSM. The HRM3
-AOGCMs and WRFG-AOGCMs project a smaller increase in the probability that
peak and duration of floods exceed simultaneously their fixed thresholds for most of the basins, except the west central region where the HRM3-AOGCMs project values
doser to those for the current period. CRCM-AOGCMs and HRM3-AOGCMs project ·an increase in the joint occurrence probability conesponding to the 30-year
return leve] of peak-duration pair for the entire domain, except the central basins,
while WRFG-AOGMs suggest an increase in the probability in the future for the
entire domain of study. Overall, larger increases are associated with CRCM
-AOGCMs.
Based on ail RCM-AOGCMs, an increase in the future P values (larger than 20%) conesponding to 5-year retum period thresholds is projected for most of the basins.
Same changes are expected for the joint occwTence probability associated with
30-year return period, except the central basins where CRCM-AOGCMs and HRM3
-AOGCMs project future P values doser to those of the current simulations. Here also, the influence of the choice of driving AOGCM on the percentage of projected
30
2.5. CONCLUSIONS
In the present study, climate change impacts on three spring (March to June) flood
characteristics (i.e., peak, volume and duration) for 21 watersheds located mainly in
the Quebec province of Canada are assessed. Univariate and copula based bivariate
frequency analyses are used to develop projected changes based on simulations
produced with three different RCMs available from NARCCAP for current
(1970-1999) and future (2041-2070) climates. In arder to evaluate the performance of
RCMs, simulated hydrographs of RCM-NCEPs are compared with those observed at
eight selected gauging stations. Moreover, results of univariate and bivariate
frequency analyses of RCM-AOGCMs are compared to those from RCM-NCEPs in
arder to evaluate boundary forcing errors.
From the va.rious analyses presented and discussed 111 this paper, the following
conclusions can be drawn:
• Comparison of hydrographs of NCEP-driven RCM simulations against those at
selected gauging stations suggests that the behaviour of RCM simulated
hydrographs, peak flows and time to peak depends on the geographie locations of
selected stations. For the northern and sorne southern stations, CRCM
overestimates flood peaks, mostly related to the overestimation of winter
precipitation that led to the overestimation of winter SWE for the upstream regions. The timing of peaks was earlier than observed and is due to the
overestimation of spring temperature at these stations. HRM3 shows negative performance errors for the southem gauging stations, and is due to the underestimation of SWE over this region. However, it performs relatively well for northem watersheds. WRFG performs weil on the estimation of flood peaks for
most ofthe southerly stations.
• Spatial patterns of lateral boundary forcing error differ with flood characteristics and RCM-AOGCM combinations. In general, CRCM-AOGCMs and
HRM3-AOGCMs provide smaller errors compared to WRFG-AOGCMs for the three
flood characteristics. RCM-AOGCMs particularly show smaller errors for the
southem basins for basic statistics and univariate analyses.
• Based on the comparison of current and future period RCM-AOGCM
simulations, an increase in the mean values of ali three flood characteristics is noted. It is important to mention that sorne differences exist between basins and
between different combinations ofRCMs and AOGCMs.
• Results show an increase in the projected changes of selected marginal return levels of flood peak, volume and duration for the majority of the basins studied. These fmdings are consistent with previous findings of Huziy et al. (20 12) and
Clavet-Gaumont et al. (2012) for flood peaks and those of Jeong et al. (2014) for the three flood characteristics for the same 21 watersheds.
32
characteristics (i.e., peak-volwne, peak-duration and volume-duration) are studied for the very frrst tune based on a multi-RCM ensemble for the 21 watersheds considered in this study. Results show important regional differences and
differences related to the choice of the RCM and driving fields. Projections
suggest future increases in P, with lager increases for longer retum period
thresholds (i.e. 30-year) than shorter retum period thresholds (i.e. 5-year).
The results of this study will be useful to support proper management and adaptation
strategies in many sectors, particularly energy sector. Though the model uncertainty
is considered by using six RCM-AOGCM combinations, the assessment is Iimited to
only Quebec province and the SRES A2 emission scenario. A more comprehensive
evaluation of flood risk would involve a rouch broader set of RCMs and AOGCMs
than considered in this study. An expanded set of emission scenarios is also necessary
to properly evaluate scenario-related uncertainties in the future projections of flood
1
- B><ln dol no>llcnl • CEHOl!l l• , • . x ~~~ndp~t
34
Figme 1. Study area with the selected CEHQ (Centre d'expertise hydrique du Québec) stream gauging
stations (Huziy et al.,2012, Jeong et al., 2014). 800 1·- peak ô 0) (/) 600
--M E ,1 volume-
,, ~/
;;::: 400 E co ~ (lj .?:- 200 co 0~
0 0 50 100 150 200 250 300 350 Time (days)Figme 2. A schematic diagram showing flood characteristics (peak, volume and duration) based on
fixed threshold and base flow approaches. Hydrograph corresponds to CEHQ station 40830 for the
CRCM-NCEP HRM3-NCEP WRFG-NC P 11111 hll 111 -10 -60 -1110 -1 -2 ·-'
Figme 3. Biases in the (a) mean winter (DJF) snow water equivalent (in %) and (b) mean spring (MAM) 2-m temperature (in °C)