Prevalence and characteristics of addictive behaviors in a community
sample: A latent class analysis
Jory Deleuze
a,⁎
, Lucien Rochat
b, Lucia Romo
c, Martial Van der Linden
b, Sophia Achab
d, Gabriel Thorens
d,
Yasser Khazaal
d, Daniele Zullino
d, Pierre Maurage
a, Stéphane Rothen
d, Joël Billieux
a,⁎
a
Laboratory for Experimental Psychopathology (LEP), Psychological Science Research Institute, Université catholique de Louvain, Louvain-la-Neuve, Belgium
b
Cognitive Psychopathology and Neuropsychology Unit, University of Geneva, Geneva, Switzerland
c
Clinique Psychanalyse Développement (CLIPSYD), University Paris Ouest-Nanterre la Défense, Paris, France
d
Addictology Division, Department of Mental Health and Psychiatry, Geneva University Hospitals, Geneva, Switzerland
a b s t r a c t
a r t i c l e i n f o
Article history: Received 6 February 2015 Received in revised form 1 April 2015 Accepted 1 April 2015
Available online 11 April 2015
Keywords: Addictive behavior Substance use Behavioral addiction Prevalence Latent class analysis
While addictions to substances such as alcohol, tobacco, and other drugs have been extensively investigated, in-terest has been growing in potential non-substance-related addictive behaviors (e.g., excessive gambling, buying or playing video games). In the current study, we sought to determine the prevalence and characteristics of a wide range of addictive behaviors in a general population sample and to identify reliable subgroups of individuals displaying addictive behaviors.
Seven hundred seventy participants completed an online survey. The survey screened for the presence and char-acteristics of the main recognized substance and behavioral addictions (alcohol, tobacco, cannabis, other drugs, gambling, compulsive shopping, intensive exercise, Internet and mobile phone overuse, intensive work involve-ment, and overeating) in a three-month period. Key aspects of addiction were measured for each reported behav-ior, including negative outcomes, emotional triggers (positive and negative emotional contexts), search for stimulation or pleasure, loss of control, and cognitive salience.
Latent class analysis allowed us to identify three theoretically and clinically relevant subgroups of individuals. The first class groups problematic users, i.e., addiction-prone individuals. The second class groups at-risk users who frequently engage in potentially addictive behaviors to regulate emotional states (especially overinvolvement in common behaviors such as eating, working, or buying). The third class groups individuals who are not prone to addictive behaviors.
The existence of different groups in the population sheds new light on the distinction between problematic and non-problematic addiction-like behaviors.
© 2015 The Authors. Published by Elsevier B.V. This is an open access article under the CC BY-NC-ND license (http://creativecommons.org/licenses/by-nc-nd/4.0/).
Contents
1. Introduction . . . 50
2. Methods . . . 50
2.1. Participants and procedure . . . 50
2.2. Online survey . . . 50
2.3. Data analysis . . . 51
3. Results . . . 51
3.1. Descriptive and exploratory analyses. . . 51
3.2. Latent class analysis . . . 51
4. Discussion . . . 54
4.1. Prevalence and characteristics of addictive behaviors . . . 54
4.2. Latent class analysis . . . 54
4.3. Limitations, perspectives, and conclusions . . . 54
⁎ Corresponding authors at: Institute of Psychological Science, Université catholique de Louvain, Place Cardinal Mercier, 10, B-1348 Louvain-la-Neuve, Belgium. Tel.: +32 10 478629; +32 10 474638.
E-mail addresses:[email protected](J. Deleuze),[email protected](J. Billieux).
http://dx.doi.org/10.1016/j.abrep.2015.04.001
2352-8532/© 2015 The Authors. Published by Elsevier B.V. This is an open access article under the CC BY-NC-ND license (http://creativecommons.org/licenses/by-nc-nd/4.0/).
Contents lists available atScienceDirect
Addictive Behaviors Reports
j o u r n a l h o m e p a g e : w w w . e l s e v i e r . c o m / l o c a t e / a b r e pContributions . . . 55 Declaration of interests . . . 55 References. . . 55
1. Introduction
A growing interest is emerging in the study of addictive behaviors in everyday life. This interest is reinforced by the fact that a significant part of the population is concerned with such problematic behaviors, given their variety and widespread prevalence (e.g.,Linskiy et al., 2012). Moreover, the consequences of addictions on health and psychological well-being (e.g., social exclusion, invalidity, physical illness), as well as on global social and economic concerns (e.g., reinsertion programs, health-related costs), are heavy (Peleteiro, Castro, Morais, Ferro, & Lunet, 2015; Rehm et al., 2009).
Negative consequences resulting from the frequent consumption of alcohol and drugs have been widely investigated and constitute a cru-cial public health concern (UNODC, 2012; World Health Organization, 2010). Beyond substance-related disorders, the concept of addiction has recently been widened with the inclusion of addictive disorders that are unrelated to substance use, namely,“behavioral” addictions. Currently, the only recognized behavioral addiction is“disordered gam-bling”, although “Internet gaming disorder” has been proposed as a new tentative condition in Section 3 of the Diagnostic and Statistical Manual of Mental Disorders (5th ed.; DSM-5;American Psychiatric Association, 2013).1Diagnostic criteria of behavioral addictions have been aligned
with those of Substance Use Disorders (SUDs) (Ko et al., 2014; Petry & O'Brien, 2013; Petry et al., 2014), mostly including symptoms of with-drawal, tolerance, cognitive salience, unsuccessful attempts to quit, and risks of relapse (American Psychiatric Association, 2013). In the last decade, a growing number of data established psychological and neurobiological similarities between Internet gaming disorder and SUDs (e.g.,Achab, Karila, & Khazaal, 2014; Grant, Brewer, & Potenza, 2006; Grant, Potenza, Weinstein, & Gorelick, 2010; Ko et al., 2013; Vanes et al., 2014; Wareham & Potenza, 2010). Nowadays, the excessive practice of, or involvement in, a wide range of other activities (e.g., shopping, sex, sport, mobile phone use) has been associated with addictive patterns of use (e.g.,Billieux, Van der Linden, & Rochat, 2008; Landolfi, 2013; Mentzoni et al., 2011), although the evidence garding their psychological and neurobiological similarities to SUDs re-mains scarce (Billieux, Maurage, Lopez-Fernandez, Kuss, & Griffiths, 2015).
Elevated comorbidity has been identified in past studies across SUDs
(Sintov et al., 2010) and between SUDs and gambling disorder
(Wareham & Potenza, 2010), suggesting common and transdiagnostic factors such as neurobiological alterations (Grant et al., 2006), height-ened impulsivity and reduced executive control (Groman, James, &
Jentsch, 2009), or maladaptive dysfunctional metacognitive beliefs
(Spada, Caselli, Nikčević, & Wells, 2015). In recent years, a wide range of behaviors has been conceptualized as addictive behavior, such as ex-ercise addiction (e.g.,Berczik et al., 2014), excessive social networking (e.g.,Griffiths, Kuss, & Demetrovics, 2014), and overinvolvement in work (e.g.,Andreassen, 2014). Nevertheless, their co-occurrences and similarities have received little attention.
The objective of the current study was tofill this gap by screening for the prevalence of a wide range of behavioral and substance addictions in order to analyze their co-occurrences and characteristics in a sample
of volunteers from the community. To this end, we created a compre-hensive questionnaire to assess (1) the prevalence and frequency (in a three-month period) of a wide range of potentially addictive behaviors (use of alcohol, tobacco, cannabis, other psychoactive substances; gambling; shopping; exercising; working; eating; Internet use; mobile phone use) and (2) the presence of addiction symptoms (negative out-comes, emotion triggers, search for stimulation or pleasure, loss of con-trol, cognitive salience) for each behavior in which participants had been involved during the last three months. After having considered the prevalence of each behavior, a latent class analysis (LCA) method was applied to identify the existence of subgroups on the basis of the ad-dictive behaviors that participants reported themselves to be involved in. The identified subgroups were then compared for their potential ad-dictive involvement in the assessed behaviors. This innovative analysis allowed us to identify both addiction-prone and non-addiction-prone individuals, as well as to explore the type of behavior and substance uses in which they were involved.
2. Methods
2.1. Participants and procedure
Participants were recruited through announcements sent on the intranets of the Universities of Geneva (Switzerland) and Louvain-la-Neuve (Belgium) and through their dissemination on social networks and specialized health-related forums. The entire survey was delivered by using the online services of the“Survey Monkey” website. Anonym-ity of the participants was guaranteed (no personal data were collected, including Internet Protocol addresses). The informed consent of the participant was required before starting the online survey. The study protocol was approved by the ethical committee of the Psychology De-partment of the University of Geneva.
Inclusion criteria were being over 18 years of age and afluent French speaker. A total of 819 individuals were included in the study. Forty-nine participants were excluded because they did not complete the entire questionnaire (n = 22) or because of too many missing data therein (n = 27). Afinal sample of 770 participants (534 females, 69.3%) completed the entire survey. Their age ranged from 18 to 72 years (M = 30.36, SD = 10.68, median = 27). Years of schooling ranged from 4 to 29 (M = 17.04, SD = 3.19). At the time of the survey, the participants reported being employed (54.2%), undergraduate stu-dents (38.4%), unemployed (5.7%), or retired (1.4%), or they did not specify their occupation (0.3%). Most participants (93%) were native French speakers and the remaining werefluent French speakers. 2.2. Online survey
The online survey2was composed of a short section assessing
demo-graphic variables, followed by a comprehensive questionnaire designed to screen for a wide range of potential addictive behaviors (use of alco-hol; tobacco; cannabis; other drugs; gambling; shopping; exercising; working; eating; use of Internet; use of mobile phone). One item was left free for respondents wishing to report any other potential addictive behavior. Each behavior was addressed sequentially and non-relevant behaviors were skipped (i.e., if the participant did not consume a 1 Online games, however, reflect only one aspect of the cyberaddiction spectrum.
In-deed, several other types of Internet-related disorders have been identified, including ex-cessive involvement in cybersex, in online gambling, and in social networks (Griffiths & Pontes, 2014; Kuss, Griffiths, Karila, & Billieux, 2014).
2
The English and French versions of the questionnaire used, called the Comprehensive Inventory of Substance and Behavioral Addictions (CISBA), are available on request from the corresponding authors.
substance or was not involved in a specific activity). Importantly, com-mon or“everyday” activities that almost everyone is involved in, such as shopping, exercising, working, eating, and using a mobile phone, were screened for their corresponding excessive or intensive manifestation (compulsive shopping; binge eating; intensive exercise, work, and use of the mobile phone). For these behaviors specifically, the respondents were asked to take into consideration only the excessive episodes to avoid the measurement of regular, non-excessive, everyday behaviors. For example, excessive shopping was assessed with the following item:“During the last three months, how often did you make excessive shopping (e.g., unnecessary purchases, significant expenses)”, and exces-sive working was assessed with the following item:“During the last three months, how often did you work in an excessive way and beyond your obligations (e.g., overtime, during the week-end, at home at night)”.
Several behaviors also required further disentanglement, particular-ly drug consumption (type of drug used), gambling (type of gambling activity practiced), and Internet use (type of online activity practiced). For these activities, after participants had indicated whether they were concerned or not, an additional list of subtypes was proposed: cocaine, amphetamines, solvents, sedatives, hallucinogens, and opiates (for drugs); lotteries, both online poker and casino, poker and cards, ca-sino games, slot machines, scratch cards, and bets (for gambling activi-ties); multiplayer games, other games, social networking, chatting, online pornography, and searching or downloading (for online activi-ties). For these multifaceted activities, participants could also indicate a subtype that was not proposed and were eventually asked to indicate their preferred subtype among those proposed.
For each behavior that the participant was concerned about, the fre-quency of involvement during the last three months was addressed with afive-point Likert scale (1 = “never,” 2 = “less than once per month,” 3 = “a few times per month,” 4 = “a few times per week,” and 5 =“every day or almost every day”). The three-month period was chosen to cover as many occurrences of behaviors as possible among individuals over a sufficient period: not too short to miss any less frequent behaviors, and not too long to avoid reporting behaviors that were no longer relevant to the current and recent habits of the in-dividual. This approach reduces the risks of biased and/or imprecise memories, with a better accuracy than for a 12-month period or for life-time prevalence. Six items targeting key features of addictions were then proposed. These items measured (1) negative outcomes, (2) emo-tion triggers (one item for each positive and negative emoemo-tional con-text), (3) the search for stimulation or pleasure, (4) loss of control, and (5) cognitive salience. Each item was assessed with a four-point Likert scale (1 =“I strongly agree,” 2 = “I somewhat agree,” 3 = “I somewhat disagree,” and 4 = “I strongly disagree”). The labeling of each item was adapted to the related behavior.
2.3. Data analysis
Descriptive analyses were used to determine the three-month prevalence and endorsement of addiction symptoms for each type of behavior. Scores for frequency and addiction symptoms were reversed when necessary so that a positive answer indicated a higher score (“I strongly agree” = 4).
LCAs were performed by using the software R (Development Core Team, 2008) with the package poLCA (Linzer & Lewis, 2011). LCA is a multivariate method, similar to cluster analysis, which allows identi fica-tion of discrete multivariate variables (called“latent classes”) in the population on the basis of multivariate categorical data. The advantage of LCA over cluster analysis is that it can be conducted on nominal and categorical variables (including binary variables). Therefore, frequencies of potential substance and behavioral addictions were recoded into binary codes on the basis of a three-month prevalence (1 = presence of the behavior; 0 = absence of the behavior). LCA was performed on all behaviors to determine the probability of involvement in each addictive behavior per latent class, as well as co-occurrence of
addictive behaviors within latent classes. The class assignment was based on the maximum posterior probability.
As our study was exploratory and we had no a priori hypotheses regarding the number of subgroups in our sample, several models (ranging from 1 to 10 classes) were computed and compared. The num-ber of latent classes to choose from was determined by relying on two criteria: the Akaike information criterion (AIC) and the Bayesian infor-mation criterion (BIC). Both are measures of the relative quality of a model, penalizing the number of estimated parameters in order to find the most parsimonious model. The best solution is chosen based on the smallest index. An additional index of entropy was calculated for accuracy, with values close to 1 meaning better homogeneity of the classes.
Latent classes were then compared for frequency of involvement and addiction symptoms (for all addictive behaviors, and then separate-ly for substance vs. behavioral addictions). To perform these anaseparate-lyses, we created three types of scores: (1) scores of frequency and addiction symptoms for all potential addictive behaviors reported by participants, (2) scores of frequency and addiction symptoms for potential substance addictions reported by participants, and (3) scores of frequency and ad-diction symptoms for potential behavioral adad-dictions reported by par-ticipants. Each score was computed by averaging the relevant items to obtain a global score for each participant (e.g., if a participant reported being involved in four types of addictive behaviors, his or her global “loss of control” score was obtained by averaging the answers provided for these four behaviors). Analyses of variance with Newman–Keuls post hoc tests were then used to compare latent classes on demograph-ical variables with external correlates (addiction symptoms). Chi-square tests were used to test gender differences among latent classes. All analyses were conducted with a significance threshold of α = .05, two-tailed.
3. Results
3.1. Descriptive and exploratory analyses
Prevalence and frequencies of involvement for each type of behavior (substance use, gambling, online activities, and excessive behaviors) for a three-month period are reported inTable 1.3We determined the
pro-portion of individuals who endorsed addiction symptoms (at least once per month in a three-month period) for each potential addictive behav-ior. These data are summarized inTable 1.
Table 2shows the proportion of individuals who were positively
concerned about each type of addiction symptom. The lack of respon-dents per subtype of drug and gambling games led us to consider both behaviors as a whole (i.e., not distinguishing their subtypes). For Inter-net activities, the use of social Inter-networks, chatting, and both categories of video games were chosen for their particular salience.
3.2. Latent class analysis
An LCA was performed on the basis of the three-month prevalence (1 = presence of the behavior; 0 = absence of behavior).Table 3
shows the twofit indices (AIC and BIC) for the various models comput-ed, as well as a measure of class homogeneity (entropy). Thefit indices follow the rule of the smaller the better. According to the AIC, the bestfit is the seven-class model. However, the AIC constantly decreases as the
3
Ninety-two participants responded to the supplementary item provided at the end of the questionnaire. The more frequent answers were watching television/movies/series (n = 13); sexual behaviors, including sex, masturbation, or voyeurism (n = 25); and lei-sure activities such as reading/music/games (n = 8). Several other behaviors (e.g., biting nails, controlling assets or the stock market) were reported by only one or two pants. These additional answers were provided by a very small proportion of the partici-pants and grouped heterogeneous problematic behaviors that were not necessarily considered to be potential addictions. For these reasons, they were not taken into account in the analyses.
number of classes increases. Therefore, in this case, it becomes uninfor-mative. The BIC reaches its minimum at the three-class solution, which is a more suitable solution. On the other hand, the measure of entropy shows better homogeneity of the classes with a two-class model. Still, entropy must be cautiously used to select a model (Collins & Lanza, 2013). Indeed, as more classes are considered, entropy is expected to
decrease because of the growing risks of assignment errors, as evi-denced by the drop between the two-class and the three-class models. Conversely, entropy progressively increases after three classes, making it unreliable.
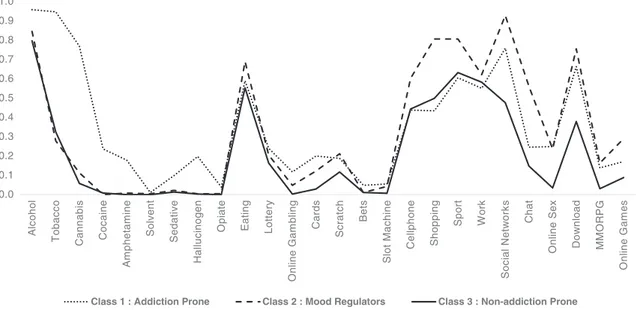
Although the various models were considered, we ended up retaining a three-class model. This choice was motivated by the princi-ple of parsimony, which was further supported by the latent class com-parisons (see below) that emphasized the theoretical and clinical relevance of the three-class model. Indeed, choosing a model with two classes would potentially lead to a binary interpretation of the results (e.g., addicts vs. non-addicts), which excludes profiles expressing risks or tendencies toward addictions. In contrast, a model composed of too many classes would be difficult to conceptualize and interpret.Fig. 1
depicts the three classes in terms of the probability of endorsing each specific behavior item, knowing that the subject belongs to one of the classes.
The identified classes were then compared for key addiction symp-toms. For this analysis, wefirst compared the classes for all addiction symptoms (i.e., without distinguishing substance and behavioral addictions), and then separately for substance and behavioral addic-tions. Comparisons between classes emphasized the following results
(seeTable 4). Regarding frequency, members of thefirst class were
more involved in the targeted behaviors, followed by those in the sec-ond class. If we consider only substance addiction, members of the first class were significantly more involved than those in the other clas-ses, with no differences between those in the second and third classes. When we consider only behavioral addictions, those in the second class reported more involvement than those in the other classes. Nega-tive outcomes associated with the behavior were more important in members of both thefirst and second classes, as compared with those in the third class. Negative emotional contexts more frequently trig-gered the assessed behaviors in members of thefirst class, and positive emotional contexts more often triggered the targeted behaviors in members of thefirst and second classes, as compared with members of the third class. If we consider only substance abuse, it appears that those in thefirst class more often consumed substances in response to negative emotions. If we consider only excessive behaviors not related to substance use, they were more frequently triggered by negative emo-tional contexts in members of the second class and by positive emotion-al contexts in members of both thefirst and the second classes. When we consider the search for stimulation and pleasure (hedonic aspects), those in thefirst class more often consumed substances for this purpose. Compared with those in the third class, members of both thefirst and second classes were more involved in non-substance-related behaviors to search for pleasure and stimulation. Finally, regarding both loss of control and cognitive salience, it appears that these two key aspects of addiction were more pronounced, specifically with regard to substance use, only in those in thefirst class. Regarding demographics, no differ-ences between classes were found regarding level of education, where-as members of the third clwhere-ass were older than members of the two other
Table 1
Prevalence and frequency of use. Behavior Three-month prevalence Less than once per month A few times per month A few times per week Every day or almost Alcohol use 83.36 6.88 38.83 30.77 6.88 Tobacco use 39.07 1.42 3.37 4.80 29.48 Cannabis use 16.86 4.54 5.71 2.59 4.02 Excessive shopping 59.07 42.07 15.32 1.68 – Excessive sport 68.55 17.01 22.85 23.63 5.06 Excessive work 59.07 11.42 21.94 16.49 9.22 Excessive eating 60.23 20.38 25.45 10.51 3.89 Excessive mobile phone
use 49.45 7.27 10.38 11.03 20.77 Drugs 5.94 3.63 1.29 0.25 0.77 Cocaine use 1.28 0.90 0.38 – – Antidepressant use 0.26 – – – 0.26 Hallucinogen use 1.02 0.77 0.25 – – Amphetamine use 0.63 0.38 0.25 – – Opiate use 0.37 – – 0.12 0.25 Others 0.12 – – – 0.12 Involvement in gambling 29.84 16.49 10.38 2.20 0.77 Lottery 10.76 4.67 4.54 1.55 – Poker 2.19 1.55 0.64 – – Online poker 1.91 0.64 0.64 0.25 0.38 Casino 1.41 1.16 0.25 – – Scratch cards 9.46 6.49 2.85 – 0.12 Bets 0.88 0.25 0.51 – 0.12 Slot machines 0.24 0.12 0.12 – – Others 0.51 0.51 – – – Involvement in online activities 84.52 1.03 4.02 14.93 64.54 Multiplayer games 1.79 – 0.12 0.64 1.03 Other games 4.13 – 0.25 1.29 2.59 Social networks 32.58 – 1.16 4.02 27.40 Chatting 4.9 0.12 0.25 0.77 3.76 Pornography 0.88 – 0.12 0.38 0.38 Searching/downloading 16.34 0.77 1.16 4.41 10 Forum 1.29 – – – 1.29 Others 3.22 – 0.12 0.38 2.72
Note. Numbers are expressed as a percentage of the total sample.“Others” = answers cor-responding to other behaviors reported by the participants.
Table 2
Frequency of each addiction symptom per behavior.
NC NEG POS STI LC CS
n % % % % % % Alcohol use 642 8 18.5 70.7 58.7 9.9 14.2 Tobacco use 301 20 68.9 59 63 74.1 42.2 Cannabis use 130 17.1 30.8 65.4 91.6 27 29.5 Drug use 46 19.5 26 50 71.7 23.9 41.3 Gambling involvement 230 2.6 6.1 38.7 63.3 3.9 10 Excessive shopping 455 13.4 38 50 56.3 24.2 25.4 Excessive sport 528 5.2 34.7 53.1 69.7 9.7 36 Excessive work 455 44.1 21 26 22.4 32.3 46.9 Social network use 251 14.7 32.3 39.7 44.8 52.3 14.1 Chat use 38 21 39.5 50 43.2 34.2 15.8 MMO use 14 57.1 42.9 42.9 85.8 64.3 50 Use of other games 32 25.1 34.4 31.2 83.9 50 37.5 Excessive eating 464 25.1 61.9 42.2 62.6 54.2 38.1 Excessive mobile phone use 381 9.7 36.2 48.3 21.4 16.5 8.2 Note. Proportions are based on the total number of individuals (n) who consume/practice the reported behavior. NC = negative consequences in everyday life; NEG = negative emotional context; POS = positive emotional context; STI = search for stimulation; LC = loss of control; CS = cognitive salience; MMO = massively multiplayer online game.
Table 3
Fit indices for the latent class analyses. Number of latent
classes
AIC BIC Entropy
2 15,319.27 15,565.52 0.7815 3 15,147.76 15,519.47 0.6536 4 15,083.52 15,580.68 0.6886 5 15,034.38 15,657 0.6958 6 14,998.74 15,746.81 0.7156 7 14,977.95 15,851.47 0.7435 8 – – – 9 – – – 10 – – –
Note. The maximum likelihood was not found beyond the seven solutions because of the lack of convergence. AIC = Akaike information criterion; BIC = Bayesian information criterion.
classes. It also appears that the third class comprised a higher propor-tion of females.
From thesefindings, the first class (12.2% of the participants) ap-pears to group individuals with high addiction proneness and therefore was labeled“addiction-prone individuals.” The second class (31.6%)
comprises individuals who are involved in targeted behaviors to regulate their emotional states; hence, we labeled the class“mood regulators.” Lastly, the third class (56.2%) appears to comprise individ-uals who are less involved in the targeted constructs, and we labeled the class“non-addiction-prone individuals.”
0.0 0.1 0.2 0.3 0.4 0.5 0.6 0.7 0.8 0.9 1.0 Alc ohol T obac c o Cannabis Coc a in e Am phetam ine Solvent Sedative Halluc inogen Op ia te Eating Lottery O n line G a m b ling Cards Sc ra tc h Bets Slot Mac hine Cellphone Shopping Spor t Wo rk Soc ial Netw or k s Chat O n line Sex Dow n load MMO RPG On li n e Ga m e s
Class 1 : Addiction Prone Class 2 : Mood Regulators Class 3 : Non-addiction Prone
Fig. 1. Latent classes. The Y-axis indicates the conditional probability of item endorsement by latent class membership. The number for the latent class solution is based on the Bayesian information criterion and index of entropy.
Table 4
Descriptive statistics for the three classes.
Class 1 Class 2 Class 3
(N = 94, 12.2%) (N = 243, 31.6%) (N = 433, 56.2%) “Addiction Prone” “Mood regulators” “Non-Addiction Prone”
Type of behavior Range M (SD) M (SD) M (SD) F p η2
Mean scores FR 1–5 2.67 (.41) 1.90 (.48)a 1.60 (.47)a,b 204.4 .00 .34 NC 1–4 1.61 (.46) 1.51 (.46) 1.42 (.46)a 7.0 .00 .01 NEG 1–4 2.03 (.56) 1.97 (.63) 1.84 (.68)a 5.2 .00 .01 POS 1–4 2.43 (.57) 2.48 (.61) 2.23 (.65)a,b 13.4 .00 .03 STI 1–4 2.69 (.56) 2.47 (.60)a 2.24 (.70)a,b 21.7 .00 .05 LC 1–4 2.06 (.51) 1.80 (.53)a 1.79 (.63)a 8.6 .00 .02 CS 1–4 1.90 (.66) 1.73 (.58)a 1.61(.63)a 9.2 .00 .02 Substance FR 1–5 2.98 (.58) 1.17 (.79)a 1.10 (.77)a 246.6 .00 .39 NC 1–4 1.62 (.57) 1.39 (.59)a 1.31 (.59)a 10.1 .00 .02 NEG 1–4 2.16 (.69) 1.82 (.87)a 1.80 (.92)a 6.5 .00 .01 POS 1–4 2.74 (.73) 2.75 (.80) 2.54 (.85)a 5.6 .00 .01 STI 1–4 3.02 (.61) 2.54 (.91)a 2.38 (.96)a 18.6 .00 .05 LC 1–4 2.16 (.61) 1.61 (.79)a 1.72 (.90)a 14.6 .00 .04 CS 1–4 1.95 (.74) 1.56 (.79)a 1.56 (.79)a 9.9 .00 .02 Behavior FR 1–5 2.37 (.56) 2.63 (.50)a 2.10 (.55)a,b 76.5 .00 .16 NC 1–4 1.60 (.58) 1.60 (.50) 1.49 (.50) 3.9 .02 .01 NEG 1–4 1.91 (.62) 2.07 (.63)a 1.85 (.70)b 8.7 .00 .02 POS 1–4 2.12 (.66) 2.25 (.62) 1.98 (.70)b 12.4 .00 .03 STI 1–4 2.36 (.69) 2.41 (.60) 2.14 (.70)a,b 13.8 .00 .03 LC 1–4 1.96 (.61) 1.96 (.57) 1.84 (.65) 3.5 .03 .00 CS 1–4 1.85 (.73) 1.85 (.62) 1.65 (.68) 8.6 .00 .02
Demographics Age 18–72 28.85 (7.78) 26.54 (7.05) 32.81 (12.19)a,b
29.63 .00 .07 Education 4–29 16.78 (3.16) 17.05 (3.14) 17.09 (3.23) .33 .71 .00 Genderd
– 58.5 65.4 73.9c
– .04 –
Note. Means in the same row with different exponents differ at pb .05, using Student–Newman–Keuls post hoc tests. FR = frequency; NC = negative consequences; NEG = negative emo-tional context; POS = positive emoemo-tional context; STI = search for stimulation; LC = loss of control; CS = cognitive salience.
Chi-square analyses were performed to assess gender differences,χ2(2, N = 770) = 11.17, p = .00. aStatistically significant in comparison to class 1.
b
Statistically significant in comparison to class 2.
c
Statistically significant in comparison to classes 1 and 2.
d
4. Discussion
The aim of the current study was to explore the prevalence and char-acteristics of potential addictive behaviors in the general population and to identify reliable subgroups of individuals displaying addictive behav-iors. Relying on LCA, we identified three theoretically and clinically rel-evant subgroups of individuals. Thefirst class groups problematic users (i.e., addiction-prone individuals). The second class groups at-risk users, who frequently engage in potentially addictive behaviors (especially overinvolvement in common behaviors such as eating, working, or buy-ing) to regulate emotional states. The third class groups individuals who are not prone to addictive behaviors.
4.1. Prevalence and characteristics of addictive behaviors
The large majority of the sample had consumed alcohol within the last three months (83.36%), which is in line with numerous data show-ing that excessive alcohol consumption is an important health issue in Western countries (Harper & Matsumoto, 2005; Rehm et al., 2010). It is worth noting that in our sample, alcohol consumption is rarely asso-ciated with addiction symptoms and has thus to be considered as non-problematic for most of the participants (seeTable 2). The preva-lence of tobacco smoking was 39.07% in the current sample. Unlike alco-hol consumption, smoking was frequently associated with an addictive pattern of use (the most pronounced symptoms were loss of control and negative mood regulation). The prevalence of cannabis use was 16.86%, and it appears that cannabis was mostly consumed for hedonic pur-poses (stimulation, pleasure) while experiencing positive affect states. Illegal drugs were consumed by only 5.94% of our sample (cocaine being consumed the most at 1.28% of the sample).
In our study, potential behavioral addictions were divided into two subtypes: activities in which only a part of the sample is involved (e.g., gambling, video gaming), and activities that are excessive manifes-tations of everyday behaviors (e.g., eating, shopping). The prevalence of gambling in the current sample was 29.84% (the most frequent types of gambling reported were lotteries and scratch cards). Gambling behav-iors were generally driven by hedonic purposes (search for stimulation and pleasure) and were rarely related to loss of control or negative out-comes. It is worth noting that, for online activities, the use of social net-works (the most reported at 32.58%) is frequently associated with the loss of control (for 52.3%). Thisfinding is in line with recent proposals that social network involvement often results in excessive or addictive use (e.g.,Griffiths et al., 2014; Wilson, Fornasier, & White, 2010). Also of note is that although online game use was reported by a small pro-portion of the participants, it was very often associated with loss of con-trol (64.3%) and negative outcomes (57.1%), which confirms that this is a high-risk activity for an addictive pattern of use (Billieux, Deleuze, Griffiths, & Kuss, 2015; Kuss, Louws, & Wiers, 2012).
Regarding“excessive” manifestations of everyday behaviors, our re-sults emphasized their high prevalence (seeTable 2). They are generally performed for hedonic and mood regulation purposes and are less fre-quently associated with problematic involvement (e.g., loss of control, negative outcomes). Among these everyday behaviors, it appears that “binge” eating is the behavior that is most frequently triggered by neg-ative emotional states, supporting the evidence that excessive eating is commonly used to cope with negative affect (e.g.,Anestis, Selby, Fink, & Joiner, 2007; De Young, Zander, & Anderson, 2014). The case of exces-sive work warrants further discussion, as 44.1% of the sample reported negative outcomes and 46.9% reported being concerned with cognitive salience. Nevertheless, this result should be cautiously interpreted, as working schedules are mostly imposed by external factors and may be driven by factors that were not assessed in the current study (e.g., socio-economic status). Accordingly, working involvement cannot be easily compared with the other targeted behaviors in this study, in line with previous studies emphasizing the difficulty in distinguishing elevated work involvement from“workaholism” (e.g.,Andreassen,
Hetland, & Pallesen, 2013; Wojdylo, Baumann, Fischbach, & Engeser, 2014).
4.2. Latent class analysis
LCA allowed us to distinguish three profiles on the basis of the three-month prevalence of a wide range of potential addictive behaviors.
Thefirst class (12.2% of the sample) represented addiction-prone in-dividuals. As illustrated inFig. 1, individuals who consume substances (alcohol, tobacco, cannabis, and other drugs) have a greater likelihood of belonging to this class. Compared with those in other classes, they have more frequent involvement in the investigated behaviors and are more often characterized by an addictive pattern of use associated with negative outcomes, loss of control, search for pleasure or stimula-tion, and cognitive salience. These results are in line with previous stud-ies emphasizing that impulsivity (characterized by poor executive control and decision making, high sensation seeking, or a heightened sensitivity to conditioned cues;Bechara, 2005; Groman et al., 2009) constitutes a core construct of addictive behaviors.
We named the second class of participants (31.6% of the sample) the “mood regulators.” Members of this class tend to regulate their mood through their involvement in the potentially excessive behaviors mea-sured in the study. These members are not characterized by an addictive pattern per se. Indeed, our analyses demonstrated that although these members displayed excessive behaviors in negative and positive emo-tional contexts, these behaviors are not associated with key features of addiction such as loss of control, cognitive salience, or negative out-comes. However, we cannot exclude the possibility that these individ-uals may be susceptible to displaying problematic behaviors if their way of regulating emotions is maintained in the long run. For example, the emotional cascade model (Selby, Anestis, & Joiner, 2008) and the con-cept of experiential avoidance (Hayes, Wilson, Gifford, Follette, & Strosahl, 1996) suggest that addictive-like behaviors can develop in in-dividuals who escape from uncomfortable feelings or experiences by consuming substances or engaging in distractive behaviors. As depicted inFig. 1, the behaviors favored by these individuals are“excessive” manifestations of everyday behaviors, such as shopping, exercising, eat-ing, or use of the mobile phone. Thesefindings are consistent with the numerous data emphasizing that such types of behaviors are frequent in community samples. They are often displayed to enhance or maintain a positive mood or to avoid or reduce a negative mood (Billieux, Gay, Rochat, & Van der Linden, 2010; Cyders & Smith, 2008; Hayes et al., 1996; Selby et al., 2008; Thayer, Newman, & McClain, 1994).
The third class groups the majority of the sample (56.2%). They are considered to be non-prone to addictive disorders on the basis of their lower frequency of involvement and their lower probability (with re-spect to the other classes) of endorsing addiction symptoms. This class consisted of more female and younger participants than the other clas-ses did. This latterfinding can be considered in light of previous studies that emphasized that young age is associated with greater risks of displaying addictive behaviors (Chambers, Taylor, & Potenza, 2003;
Whelan et al., 2012). A possible explanation is that both young age
and being male are associated with high impulsivity and sensation seek-ing (e.g.,Billieux et al., 2012; d'Acremont & Van der Linden, 2005), both of which are predictors of addictive behaviors (e.g., Harden & Tucker-Drob, 2011; Quinn & Harden, 2013; Steinberg, 2008).
4.3. Limitations, perspectives, and conclusions
The participants in the current study were a self-selected sample, which may influence the prevalence rates (Khazaal et al., 2014). More-over, as the present analysis is based on a cross-sectional analysis that focused on the previous three months, we cannot take into account the variability of addictive behaviors and their evolution across time, neither the potential influence of the testing period (e.g., holiday, cele-bration period), which should be explored through longitudinal studies.
It is also worth noting that the effect size of the differences reported in
Table 4is of small amplitude, which could be due to the nature of the sample (community participants) and/or the fact that each addiction symptom was assessed with only one item. Therefore, the differences highlighted here between the classes should be confirmed in future studies by using more specific instruments (e.g., impulsivity question-naire). Finally, behavioral measures (e.g., laboratory tasks that measure impulsivity) should be conducted to further determine the characteris-tics of each class.
Despite these limitations, this study is thefirst to use LCA in order to identify specific subgroups of individuals from the prevalence and char-acteristics of a wide range of addictive behaviors in a community sam-ple. The strong proposal resulting from our study is that the“addictive behavior spectrum” groups heterogeneous behaviors. Some are non-problematic and are displayed for hedonic and mood regulation pur-poses, whereas others are more problematic and associated with loss of control, cognitive salience, and negative outcomes. This might lead to a renewal of the classic diagnosis-based approach to addictions and to a deep reconsideration of the“normal” versus “pathological” bound-aries in the addictionfield.
In conclusion, we would like to warn against the current trend that too easily assimilates a wide range of everyday behaviors (e.g., eating, shopping, mobile phone use, working, exercising) as behavioral addic-tions. For example, the current study suggests that excessive involve-ment in the targeted behaviors is not necessarily associated with the presence of core symptoms of addiction. Furthermore, this trend con-tributes to the pathologization of everyday behaviors (seeBillieux et al., 2014; Mihordin, 2012). It also neglects the fact that the behaviors under the scope of investigation in the present paper are multi-determined and heterogeneous. Therefore, they should not necessarily be conceptualized as addictions.
Contributions
Joël Billieux, Lucien Rochat, Martial Van der Linden, Sophia Achab, Gabriel Thorens, Yasser Khazaal, and Daniele Zullino designed the study and elaborated the questionnaire used in the online survey. Joël Billieux, Jory Deleuze, and Lucia Romo acquired the data. Jory Deleuze and Stéphane Rothen did the statistical analyses. Jory Deleuze, Stéphane Rothen, and Joël Billieux interpreted the results. Jory Deleuze, Joël Billieux, Pierre Maurage, and Stéphane Rothen wrote the article. Martial Van der Linden, Sophia Achab, Gabriel Thorens, Yasser Khazaal, Daniele Zullino, Lucien Rochat, and Lucia Romo reviewed the manuscript. All au-thors approved thefinal version of the manuscript.
Declaration of interests
This research was supported by a grant obtained from the Belgium National Lottery. The funding agency had no role in the design and con-duct of the study; the collection, management, analysis, and interpreta-tion of the data; and the preparainterpreta-tion, review, or approval of the manuscript. The work of Pierre Maurage (Research Associate) is funded by the Belgian Fund for Scientific Research (F.R.S.-FNRS, Belgium).
References
Achab, S., Karila, L., & Khazaal, Y. (2014). Pathological gambling: update on decision making and neuro-functional studies in clinical samples. Current Pharmaceutical Design, 20, 4000–4011.http://dx.doi.org/10.2174/13816128113199990625. American Psychiatric Association (2013).Diagnostic and statistical manual of mental
disor-ders (5th ed.). Arlington, VA: American Psychiatric Publishing.
Andreassen, C. S. (2014). Workaholism: An overview and current status of the research. Journal of Behavioral Addictions, 3, 1–11.http://dx.doi.org/10.1556/JBA.2.2013.017. Andreassen, C. S., Hetland, J., & Pallesen, S. (2013). Workaholism and work–family
spill-over in a cross-occupational sample. European Journal of Work and Organizational Psychology, 22, 78–87.http://dx.doi.org/10.1080/1359432X.2011.626201.
Anestis, M. D., Selby, E. A., Fink, E. L., & Joiner, T. E. (2007). The multifaceted role of distress tolerance in dysregulated eating behaviors. International Journal of Eating Disorders, 40, 718–726.http://dx.doi.org/10.1002/eat.20471.
Bechara, A. (2005). Decision making, impulse control and loss of willpower to resist drugs: A neurocognitive perspective. Nature Neuroscience, 8, 1458–1463.http://dx. doi.org/10.1038/nn1584.
Berczik, K., Griffiths, M. D., Szabo, A., Kurimay, T., Kokonyei, G., Urbán, R., et al. (2014).
Exercise addiction—The emergence of a new disorder. Australasian Epidemiologist, 21(2), 36–40.
Billieux, J., Deleuze, J., Griffiths, M. D., & Kuss, D. J. (2015a).Internet addiction: The case of massively multiplayer online role playing games. In N. el-Guebaly, G. Carrà, & M. Galanter (Eds.), The textbook of addiction treatment: International perspectives (pp. 1515–1525). New York, NY: Springer.
Billieux, J., Gay, P., Rochat, L., & Van der Linden, M. (2010). The role of urgency and its un-derlying psychological mechanisms in problematic behaviours. Behaviour Research and Therapy, 48, 1085–1096.http://dx.doi.org/10.1016/j.brat.2010.07.008. Billieux, J., Maurage, P., Lopez-Fernandez, O., Kuss, D. J., & Griffiths, M. D. (2015b). Can
dis-ordered mobile phone use be considered a behavioral addiction? An update on cur-rent evidence and a comprehensive model for future research. Curcur-rent Addiction Reports.http://dx.doi.org/10.1007/s40429-015-0054-y(Advance online publication). Billieux, J., Philippot, P., Schmid, C., Maurage, P., De Mol, J., & Van der Linden, M. (2014). Is dysfunctional use of the mobile phone a behavioural addiction? Confronting symptom-based versus process-based approaches: Conceptualizing mobile phone dysfunctional use. Clinical Psychology & Psychotherapy.http://dx.doi.org/10.1002/ cpp.1910(Advance online publication).
Billieux, J., Rochat, L., Grazia, C., Carré, A., Offerlin-Meyer, I., Defeldre, A. C., et al. (2012). Val-idation of a short French version of the UPPS-P Impulsive Behavior Scale. Comprehensive Psychiatry, 53, 609–615.http://dx.doi.org/10.1016/j.comppsych.2011.09.001. Billieux, J., Van der Linden, M., & Rochat, L. (2008). The role of impulsivity in actual and
problematic use of the mobile phone. Applied Cognitive Psychology, 22, 1195–1210.
http://dx.doi.org/10.1002/acp.1429.
Chambers, R. A., Taylor, J. R., & Potenza, M. N. (2003). Developmental neurocircuitry of motivation in adolescence: A critical period of addiction vulnerability. American Journal of Psychiatry, 160, 1041–1052.http://dx.doi.org/10.1176/appi.ajp.160.6.1041. Collins, L. M., & Lanza, S. T. (2013).Latent class and latent transition analysis: With
applica-tions in the social, behavioral, and health sciences. New York, NY: Wiley.
Cyders, M. A., & Smith, G. T. (2008). Emotion-based dispositions to rash action: Positive and negative urgency. Psychological Bulletin, 134, 807–828.http://dx.doi.org/10. 1037/a0013341.
d'Acremont, M., & Van der Linden, M. (2005). Adolescent impulsivity: Findings from a community sample. Journal of Youth and Adolescence, 34, 427–435.http://dx.doi. org/10.1007/s10964-005-7260-1.
De Young, K. P., Zander, M., & Anderson, D. A. (2014). Beliefs about the emotional conse-quences of eating and binge eating frequency. Eating Behaviors, 15, 31–36.http://dx. doi.org/10.1016/j.eatbeh.2013.10.012.
Development Core Team (2008).R: A language and environment for statistical computing. Vienna, Austria: R Foundation for Statistical Computing.
Grant, J. E., Brewer, J. A., & Potenza, M. N. (2006).The neurobiology of substance and be-havioral addictions. CNS Spectrums, 11(12), 924–930.
Grant, J. E., Potenza, M. N., Weinstein, A., & Gorelick, D. A. (2010). Introduction to behav-ioral addictions. The American Journal of Drug and Alcohol Abuse, 36, 233–241.http:// dx.doi.org/10.3109/00952990.2010.491884.
Griffiths, M. D., & Pontes, H. M. (2014). Internet addiction disorder and Internet gaming disorder are not the same. Journal of Addiction Research & Therapy, 5(4), e124.
http://dx.doi.org/10.4172/2155-6105.1000e124.
Griffiths, M. D., Kuss, D. J., & Demetrovics, Z. (2014). Chapter 6—Social networking addiction: An overview of preliminaryfindings. In K. Rosenberg, & L. Feder (Eds.), Behavioral addictions: Criteria, evidence, and treatment (pp. 119–141). San Diego, CA: Academic Press (Retrieved fromhttp://www.sciencedirect.com/science/article/pii/ B978012407724900006).
Groman, S. M., James, A. S., & Jentsch, J. D. (2009). Poor response inhibition: At the nexus between substance abuse and attention deficit/hyperactivity disorder. Neuroscience & Biobehavioral Reviews, 33, 690–698.http://dx.doi.org/10.1016/j.neubiorev.2008.08. 008.
Harden, K. P., & Tucker-Drob, E. M. (2011). Individual differences in the development of sensation seeking and impulsivity during adolescence: Further evidence for a dual systems model. Developmental Psychology, 47, 739–746.http://dx.doi.org/10.1037/ a0023279.
Harper, C., & Matsumoto, I. (2005). Ethanol and brain damage. Current Opinion in Pharmacology, 5, 73–78.http://dx.doi.org/10.1016/j.coph.2004.06.011.
Hayes, S. C., Wilson, K. G., Gifford, E. V., Follette, V. M., & Strosahl, K. (1996). Experiential avoidance and behavioral disorders: A functional dimensional approach to diagnosis and treatment. Journal of Consulting and Clinical Psychology, 64, 1152–1168.http://dx. doi.org/10.1037/0022-006X.64.6.1152.
Khazaal, Y., van Singer, M., Chatton, A., Achab, S., Zullino, D., Rothen, S., et al. (2014). Does self-selection affect samples' representativeness in online surveys? An investigation in online video game research. Journal of Medical Internet Research, 16(7), e164.
http://dx.doi.org/10.2196/jmir.2759.
Ko, C. -H., Liu, G. -C., Yen, J. -Y., Chen, C. -Y., Yen, C. -F., & Chen, C. -S. (2013). Brain corre-lates of craving for online gaming under cue exposure in subjects with Internet gam-ing addiction and in remitted subjects. Addiction Biology, 18, 559–569.http://dx.doi. org/10.1111/j.1369-1600.2011.00405.x.
Ko, C. -H., Yen, J. -Y., Chen, S. -H., Wang, P. -W., Chen, C. -S., & Yen, C. -F. (2014). Evaluation of the diagnostic criteria of Internet gaming disorder in the DSM-5 among young adults in Taiwan. Journal of Psychiatric Research, 53, 103–110.http://dx.doi.org/10. 1016/j.jpsychires.2014.02.008.
Kuss, D. J., Griffiths, M. D., Karila, L., & Billieux, J. (2014). Internet addiction: A systematic review of epidemiological research for the last decade. Current Pharmaceutical Design, 20, 4026–4052.http://dx.doi.org/10.2174/13816128113199990617.
Kuss, D. J., Louws, J., & Wiers, R. W. (2012). Online gaming addiction? Motives predict ad-dictive play behavior in massively multiplayer online role-playing games. Cyberpsychology, Behavior and Social Networking, 15, 480–485.http://dx.doi.org/10. 1089/cyber.2012.0034.
Landolfi, E. (2013). Exercise addiction. Sports Medicine (Auckland, N.Z.), 43, 111–119.
http://dx.doi.org/10.1007/s40279-012-0013-x.
Linskiy, I. V., Minko, A. I., Artemchuk, A. P., Grinevich, E. G., Markova, M. V., Musienko, G. A., et al. (2012). Addictive behavior among young people in Ukraine: A pilot study. Substance Use & Misuse, 47, 1151–1158.http://dx.doi.org/10.3109/10826084.2012. 683926.
Linzer, D. A., & Lewis, J. B. (2011).poLCA: An R package for polytomous variable latent class analysis. Journal of Statistical Software, 42(10), 1–29.
Mentzoni, R. A., Brunborg, G. S., Molde, H., Myrseth, H., Skouverøe, K. J. M., Hetland, J., et al. (2011). Problematic video game use: Estimated prevalence and associations with mental and physical health. Cyberpsychology, Behavior and Social Networking, 14, 591–596.http://dx.doi.org/10.1089/cyber.2010.0260.
Mihordin, R. (2012). Behavioral addiction—Quo vadis? The Journal of Nervous and Mental Disease, 200, 489–491.http://dx.doi.org/10.1097/NMD.0b013e318257c503. Peleteiro, B., Castro, C., Morais, S., Ferro, A., & Lunet, N. (2015). Worldwide burden of
gas-tric cancer attributable to tobacco smoking in 2012 and predictions for 2020. Digestive Diseases and Sciences.http://dx.doi.org/10.1007/s10620-015-3624-x. Petry, N. M., & O'Brien, C. P. (2013). Internet gaming disorder and the DSM-5. Addiction,
108, 1186–1187.http://dx.doi.org/10.1111/add.12162.
Petry, N. M., Rehbein, F., Gentile, D. A., Lemmens, J. S., Rumpf, H. -J., Mößle, T., et al. (2014). An international consensus for assessing internet gaming disorder using the new DSM-5 approach: Internet gaming disorder. Addiction, 109, 1399–1406.http://dx. doi.org/10.1111/add.12457.
Quinn, P. D., & Harden, K. P. (2013). Differential changes in impulsivity and sensation seeking and the escalation of substance use from adolescence to early adulthood. Development and Psychopathology, 25, 223–239. http://dx.doi.org/10.1017/ S0954579412000284.
Rehm, J., Baliunas, D., Borges, G. L. G., Graham, K., Irving, H., Kehoe, T., et al. (2010). The relation between different dimensions of alcohol consumption and burden of dis-ease: An overview. Addiction, 105, 817–843.http://dx.doi.org/10.1111/j.1360-0443. 2010.02899.x.
Rehm, J., Mathers, C., Popova, S., Thavorncharoensap, M., Teerawattananon, Y., & Patra, J. (2009). Global burden of disease and injury and economic cost attributable to alcohol
use and alcohol-use disorders. The Lancet, 373, 2223–2233.http://dx.doi.org/10.1016/ S0140-6736(09)60746-7.
Selby, E. A., Anestis, M. D., & Joiner, T. E. (2008). Understanding the relationship between emotional and behavioral dysregulation: Emotional cascades. Behaviour Research and Therapy, 46, 593–611.http://dx.doi.org/10.1016/j.brat.2008.02.002.
Sintov, N. D., Kendler, K. S., Young-Wolff, K. C., Walsh, D., Patterson, D. G., & Prescott, C. A. (2010). Empirically defined subtypes of alcohol dependence in an Irish family sam-ple. Drug and Alcohol Dependence, 107, 230–236. http://dx.doi.org/10.1016/j. drugalcdep.2009.11.003.
Spada, M. M., Caselli, G., Nikčević, A. V., & Wells, A. (2015). Metacognition in addictive be-haviors. Addictive Behaviors, 44, 9–15.http://dx.doi.org/10.1016/j.addbeh.2014.08. 002.
Steinberg, L. (2008). A social neuroscience perspective on adolescent risk-taking. Developmental Review, 28, 78–106.http://dx.doi.org/10.1016/j.dr.2007.08.002. Thayer, R. E., Newman, J. R., & McClain, T. M. (1994). Self-regulation of mood: Strategies
for changing a bad mood, raising energy, and reducing tension. Journal of Personality and Social Psychology, 67, 910–925. http://dx.doi.org/10.1037/0022-3514.67.5.910.
UNODC (2012). World drug report 2012. Retrieved fromhttp://www.unodc.org/ documents/data-and-analysis/WDR2012/WDR_2012_web_small.pdf
Vanes, L. D., van Holst, R. J., Jansen, J. M., van den Brink, W., Oosterlaan, J., & Goudriaan, A. E. (2014). Contingency learning in alcohol dependence and pathological gambling: Learning and unlearning reward contingencies. Alcoholism, Clinical and Experimental Research, 38, 1602–1610.http://dx.doi.org/10.1111/acer.12393.
Wareham, J. D., & Potenza, M. N. (2010). Pathological gambling and substance use disor-ders. The American Journal of Drug and Alcohol Abuse, 36, 242–247.http://dx.doi.org/ 10.3109/00952991003721118.
Whelan, R., Conrod, P. J., Poline, J. -B., Lourdusamy, A., Banaschewski, T., Barker, G. J., et al. (2012). Adolescent impulsivity phenotypes characterized by distinct brain networks. Nature Neuroscience, 15, 920–925.http://dx.doi.org/10.1038/nn.3092.
Wilson, K., Fornasier, S., & White, K. M. (2010). Psychological predictors of young adults' use of social networking sites. Cyberpsychology, Behavior and Social Networking, 13, 173–177.http://dx.doi.org/10.1089/cyber.2009.0094.
Wojdylo, K., Baumann, N., Fischbach, L., & Engeser, S. (2014). Live to work or love to work: Work craving and work engagement. PLoS ONE, 9(10), e106379.http://dx.doi.org/10. 1371/journal.pone.0106379.
World Health Organization (2010). ATLAS on substance use (2010)—Resources for the prevention and treatment of substance use disorders. Retrieved fromhttp://www. who.int/substance_abuse/publications/treatment/en/