SÉLECTION DES SITES DE TANIÈRES ET DES TANIÈRES DE REPRODUCTION CHEZ LE RENARD ARCTIQUE À L'ÎLE BYLOT, NUNA VUT
MÉMOIRE PRÉSENTÉ À
L'UNIVERSITÉ DU QUÉBEC À RIMOUSKI Comme exigence partielle du programme de
Gestion de la faune et de ses habitats
PAR
GUILLAUME SZOR
Avertissement
La diffusion de ce mémoire ou de cette thèse se fait dans le respect des droits de son auteur, qui a signé le formulaire « Autorisation de reproduire et de diffuser un rapport, un mémoire ou une thèse ». En signant ce formulaire, l’auteur concède à l’Université du Québec à Rimouski une licence non exclusive d’utilisation et de publication de la totalité ou d’une partie importante de son travail de recherche pour des fins pédagogiques et non commerciales. Plus précisément, l’auteur autorise l’Université du Québec à Rimouski à reproduire, diffuser, prêter, distribuer ou vendre des copies de son travail de recherche à des fins non commerciales sur quelque support que ce soit, y compris l’Internet. Cette licence et cette autorisation n’entraînent pas une renonciation de la part de l’auteur à ses droits moraux ni à ses droits de propriété intellectuelle. Sauf entente contraire, l’auteur conserve la liberté de diffuser et de commercialiser ou non ce travail dont il possède un exemplaire.
Je tiens tout d'abord à remercier Dominique, mon superviseur, pour m'avoir donné la chance de me lancer dans ce projet de maîtrise, et surtout pour m'y avoir laissé cheminer avec toute la liberté désirée et en me faisant toujours autant confiance. Ce que j'ai appris au cours des trois dernières années dépasse largement le cadre académique de ma maîtrise. Je tiens également à remercier Ilya Klvana, qui a été un partenaire essentiel à la mise en place du «Projet Renard» et sans qui l'été 2003 n'aurait jamais été une si belle réussite! Merci pour tes idées, ton enthousiasme, et surtout ton soutien moral et nos nombreuses longues discussions s'étendant de la science à l'essence même de la vie! Je tiens bien entendu à remercier tout ceux avec qui j'ai passé des été incroyables à l'île Bylot, surtout Patrick Bergeron et Marie-Andrée Giroux qui m'ont enduré, moi et mes pieds, pendant plus de 200 heures enfermés dans une tente d'à peine la grandeur d'une demie salle de bain! Merci à Vincent Careau, autant pour ton bouillonnement cérébral incessant que pour nos conneries, duos d'harmonicas et chansons dont le grand succès «The Abandandoned Den », qui ont tant égayé mes été de terrains. Merci à Benoît Tremblay dont j'ai testé les connaissances botaniques mais jamais réussi à atteindre leurs limites. Merci à Ben, Momo, Manon, Ti-Côté, Gab et Jimmy qui se sont se sont si généreusement sacrifiés pour m'aider à compter mes si chères crottes de lemmings. Merci également à tout le reste de l'équipe de recherche de l'île Bylot sans qui ces trois derniers étés n'auraient jamais été si mémorables! Finalement, un gros merci à Alain Caron pour son énorme coup de main lors de mes analyses géospatiales et statitisques.
Ce projet n'aurait pu être possible sans le support et financement des organismes suivants: l'Association des chasseurs et trappeurs de Mittimatalik, le Centre d'études nordiques, les Chaires de recherche du Canada, le Conseil de gestion des ressources fauniques du Nunavut, le Conseil de recherche en sciences naturelles et en génie du Canada (CRSNG), l'Étude du Plateau Continental Polaire, la Fondation de l'Université du Québec
à Rimouski, la Fondation Canadienne pour l'Innovation, le Fond de recherche sur la nature et les technologies du Québec (FQRNT), l'Initiative des écosystèmes du Nord (Environnement Canada), le Ministère des Affaires Indiennes et du Nord, Parcs Canada, le
AVANT-PROPOS
Ce mémoire est présenté sous la forme d'un article à être soumis à la Revue canadienne de Zoologie ainsi que d'un protocole préparé pour l'Agence Parcs Canada et le Comité de gestion conjointe des parcs (Joint Park Management Committee) du Parc national du Canada Sirmilik. Une revue de littérature a été ajoutée au mémoire afin de fournir au lecteur un supplément d'informations sur le sujet d'étude.
Contribution des auteurs
Bien que Dominique Berteaux et Gilles Gauthier soient co-auteurs de l'article principal, le manuscrit doit être considéré comme le mémoire de l'étudiant. L'apport de D. Berteaux et G. Gauthier se limite aux fonctions de supervision. Ils ont guidé l'étudiant lors de la planification du travail de terrain et lors de la rédaction du mémoire. Guillaume Szor a planifié l'échantillonnage, récolté les données de terrain, fait les analyses statistiques et rédigé le mémoire.
RÉSUMÉ
L'utilisation de tanières est une stratégie courante chez plusieurs carnivores terrestres, utilisant ces structures comme site de mise-bas et d'élevage des jeunes, ou simplement comme refuge ou lieu de repos. La localisation de ces tanières semble rarement aléatoire mais plutôt influencée par l'abondance des ressources alimentaires ou la facilité d'échapper à la prédation. Le premier objectif de mon projet était de déterminer quels étaient les paramètres influençant la localisation des tanières d'un carnivore vivant dans un écosystème arctique. Nous avons examiné les caractéristiques et l'environnement de 83 tanières de renards arctiques (Alapex lagapus) sur la plaine sud de l'île Bylot, Nunavut, Canada. La topographie, le microclimat et la distribution des ressources alimentaires aux tanières (n = 83) ont été comparés aux caractéristiques de sites aléatoires dans l'aire d'étude (échelle du paysage) ainsi qu'aux caractéristiques d'autres sites potentiels dans un rayon de 100 mètres autour des tanières ( échelle locale). Les tanières de renards arctiques étaient majoritairement excavées dans des buttes ou pentes naturelles, préférentiellement aux endroits où le substrat était sablonneux, assurant ainsi un bon drainage du site. Nous avons également observé une préférence pour les sites ayant un faible couvert de neige au printemps et une plus grande exposition au sud, générant ainsi une température du sol plus élevée aux tanières et donc un dégel du sol plus rapide à la fin de l'hiver. Nous suggérons que la sélection de sites bien drainés et où la fonte des neiges est accélérée permet aux renards arctiques d'avoir accès à une couche de sol meuble plus épaisse au-dessus de la strate de pergélisol. L'accès à un sol meuble, dans un environnement arctique, semblerait donc représenter le facteur limitant principal pour l'établissement de tanières chez ce carnIvore.
Le second objectif de mon projet était d'identifier les contraintes apparentes auxquelles les renards arctiques sont exposés lors du choix de leur site de reproduction. Nous avons comparé l'environnement de 27 tanières utilisées pour la mise-bas à l'environnement de 53 tanières inactives. La sélection d'une tanière de reproduction semble fortement liée à la distribution des ressources alimentaires ainsi qu'à la compétition intra ou interspécifique. Plus précisément, le renard arctique sélectionne les tanières situées dans les habitats où sa proie principale (lemming) abonde ou celles localisées à proximité d'une importante source de proies alternatives (colonie d'oie). Cependant, la présence de plusieurs tanières à proximité semble diminuer l'attrait d'une tanière donnée, possiblement à cause de la compétition potentielle que ces tanières voisines génèrent. Ainsi, nous suggérons que malgré la grande abondance de tanières existantes, le nombre de tanières de haute qualité disponibles pour la reproduction demeure limité. Considérant la présence grandissante du renard roux dans le haut arctique canadien, il est donc possible qu'une importante compétition s'installe entre ces deux espèces pour l'accès aux tanières de qualité. D'après nos observations, le renard arctique demeure pour l'instant le principal prédateur terrestre à l'île Bylot. Un programme de suivi de la communauté de renards de l'île Bylot est cependant essentiel afin de surveiller l'évolution de ce fragile écosystème. Nous proposons un protocole de terrain adapté pour un tel suivi. Ce protocole constituera pour Parcs Canada un élément important dans le suivi de l'intégrité écologique du Parc National du Canada de Sirmilik.
TABLE DES MATIÈRES
REMERCIEMENTS ....... i
AVANT-PROPOS ........ iii
TABLE DES MATIÈRES ... v
CHAPITRE 1: INTRODUCTION GÉNÉRALE ...•....... 1
UTILISATION DE TANIÈRES CHEZ LES CARNiVORES •••••••••••••••••••••••••••••••••••••••••••••••••••••••••••••••••••• 1 Sélection d'un site de tanière chez le renard arctique ... 2
STATUT DE LA COMMUNAUTÉ DE RENARDS ARCTIQUES ET ROUX DE L'ÎLE BVLOT •••••••.•••••••.• 5 Conséquences de l'expansion du renard roux pour le renard arctique ... 6
BIBLIOGRAPHIE •••••••••••••••••••••••.••••••.•••••••••••••••••••••••••••••••••.•••••••••••••••••••••••••••••••••••••••••••••••••••••••••• 10 CHAPITRE 2: DEN ECOLOGY OF AN ARCTIC MAMMAL: SELECTION OF DENNING SITES AND REPRODUCTIVE DENS BY ARCTIC FOXES ON BYLOT ISLAND, NUNA VUT, CANADA ... 13
INTRODUCTION ... 17
MATERIALS AND METHODS ••••••••••••••••••••••••••••••••••••••••••••••••••••••••••••••••••••••••••••••••••••••••••••••••••••••••• 19 Study area ... 19
Landscape characteristics of denning sites ... 20
Local characteristics of denning sites ... 23
Comparisons of reproductive and non-breeding dens ... 24
RESULTS .•••..•••••••.•..••••••••••••...••••.••••••••••••••••••••••••••••••••••••••••••.••.•••••••••••••••••••••••••••••••••••••••••.•••••••.•• 26
Landscape characteristics of den sites ... 26
Local characteristics of denning sites ... 26
Comparisons of reproductive and non-breeding dens ... 27
DISCUSSION ... 29
Selection of denning sites ... 29
Selection of reproductive dens ... 31 CONCLUSION ••••••••••.•••••••••••••••••••.••••••••••••••.•••••••••.•••••••••••••.•••••••••••••••••••••••••••••••••••••••••••••••••••••••••• 33 ACKNOWLEDGEMENTS •••••••••••••••••••••••••••••••••••••••••••••••••••••••••••••••••••••••••••••••••••••••••••••••••••••••••••••••• 34 REFERENCES •••••••••••••••••••••••••••••••••••••••••••••••••••••••••••••••••••••••••••••••••••••••••••••••••••••••••••••••••••••••••••••••• 35 TABLES AND FIGURES •••••••••••••••••••••••••••••••••••••••••••••••••••••••••••••••••••••••••••••••••••••••••••••••••••••••••••••••••• 39 CHAPITRE 3: SUIVI DE LA COMMUNAUTÉ DE RENARDS DE L'ÎLE BYLOT .... 53
ACKNOWLEDGEMENTS •••••••••••••••••••••••.•••••••••••••••••••••••••••••.••••••••••••••••••••••••••••••••••.••••••••.••••.•••••••.• 56 INTRODUCTION •••••••••••••••••••••••••••••••••••••••••••••••••••••••••••••••••••••••••••••••••••••••••••••••••••••••••••••.•••••••.•••••• 57 GENERAL BIOLOGY OF ARCTIC AND RED FOXES ••••••••••.••••••••••••••••••••••••••••••••••••••••.•••••••••.•••••••.• 59 Arctic fox (Alopex lagopus) ... 59
Red fox (Vulpes vulpes) ... 62
PROTOCOLS ••••••.••••••••••••••••••••••••••••••••••••••••••••••••••••••••••••••••••••••••••••••••••••••••••••••••••••••••••••••••••••••••••• 66 Den search ... 66
Visit of dens and populations monitoring ... 68 LITERATURE CITED ........................ 76
CHAPITRE 1
INTRODUCTION GÉNÉRALE
UTILISATION DE TANIÈRES CHEZ LES CARNIVORES
L'utilisation de refuges est un phénomène courant chez de nombreuses espèces animales. Plusieurs carnivores tels que le loup, le renard, le lynx ou la martre utilisent des cavités, naturelles ou excavées, comme site de mise bas, de cache alimentaire ou simplement de repos. Divers paramètres semblent affecter le choix d'un site de tanière, notamment la distance à un point d'eau chez le lynx roux (Lynx rufus) (Kolowski et Woolf 2002), l'inclinaison et l'orientation du terrain pour le lynx du Canada (Slough 1999) ou le type de sol chez l'ours grizzly (Ursus arctos) (McLoughlin et al. 2002). Le choix d'un site de tanière, plus particulièrement pour la reproduction, semble rarement aléatoire et est souvent basé sur deux principaux facteurs: la facilité d'échapper à la prédation et l'abondance locale de ressources alimentaires. Par exemple, la majorité des tanières de lynx du Canada (Lynx canadensis) ou de martre d'Amérique (Martes americana) sont situées dans des lieux de haute densité de débris ligneux grossiers, procurant une couverture horizontale et verticale et protégeant ainsi de la prédation, des intempéries et produisant un couvert de fuite additionnel (Ruggiero et al. 1998; Slough 1999). Pour le renard
véloce (Vulpes velox) ainsi que le renard-chaton à longues oreilles (Vulpes macrotis), la présence de haute végétation abritant les insectes dont ils se nourrissent semble être un facteur important lors du choix d'un site de tanière (Pruss 1999; Arjo et al. 2003). Les caractéristiques physiques de la tanière en soi affectent également le choix d'un animal cherchant une tanière pour se reproduire. Le nombre de trous ainsi que leur grosseur sont des caractéristiques importantes chez certaines espèces. Par exemple, les jeunes renards à oreilles de chauve-souris (Otocyon
megalotis) vivant dans l'est et le sud de l'Afrique se réfugient fréquemment dans les trous de
petits diamètres afin d'échapper à la prédation par de plus gros carnivores (Arjo et al. 2003).
L'orientation des trous, la surface totale de la tanière ainsi que la végétation sur et autour de la tanière sont toutes des caractéristiques pouvant également jouer un rôle dans le choix d'une tanière de reproduction (Dalerum et al. 2002). L'identification des éléments influençant le choix d'un site de reproduction peut nous permettre d'identifier les contraintes auxquelles sont exposés
les individus d'une espèce donnée lors de cette période critique de leur cycle de vie.
Sélection d'un site de tanière chez le renard arctique
Plusieurs études ont été effectuées sur les tanières de renards arctiques, principalement sur leur morphologie et leur distribution spatiale. Les propriétés des sites de tanières varient considérablement d'une région à l'autre. Différentes caractéristiques ont été relevées comme jouant un rôle potentiel dans l'établissement d'une tanière (tableau-1). Macpherson (1969) nota que les tanières étaient habituellement plus présentes dans les sites sablonneux mais stables,
facilement drainés, avec beaucoup de végétation et une pente douce. De plus, les sites
surplombant de larges vallées, ou le lit d'une rivière, semblaient préférés dans l'arctique canadien (Macpherson 1969). Certaines études ont indiqué que la température du sol et la profondeur du sol meuble au-dessus du pergélisol seraient des facteurs affectant le choix d'un site de tanière chez le renard arctique (Chesemore 1969; Smits et al. 1988). D'après Prestrud (1992b), les sites avec une épaisseur et couverture de neige plus faible seraient également préférés par les renards. Les études de Chesemore (1969), Smith et al. (1988), Prestrud (1992b) et Dalerum et al. (2002) ont démontré que les pentes orientées vers le sud étaient habituellement plus utilisées,
possiblement à cause du microclimat plus chaud qu'on y retrouve et qui mène à une fonte des
(1994) soutiennent que ce serait plutôt l'orientation des vents dominants qui déterminerait l'orientation des trous des tanières, les entrées étant placées de façon à empêcher au vent de s'engouffrer dans les tanières. Eide et al. (2001) ont démontré que les terrains ayant une structure modérément irrégulière et accidentée semblent être préférés par le renard arctique au Svalbard. D'après les auteurs, ce type de terrain offrirait une plus grande quantité de sites potentiels pour une tanière, puisqu'on y trouverait plus de sites exposés au soleil, ayant une plus haute température et étant plus rapidement libérés de la neige au printemps. Finalement, Tannerfeldt et al. (2002) ont démontré que la présence d'une tanière utilisée par un renard roux à proximité diminuerait les chances d'utilisation d'une tanière par le renard arctique.
Tableau 1: Résumé des différents paramètres affectant la localisation des tanières de renard arctique d'après la littérature. «Oui» indique que le paramètre affecte la localisation des tanières. Les cases laissées blanches indiquent que ce paramètre n'avait pas été étudié.
Lieu Alaska Nunavut Alaska Yukon Svalbard Groenland Alaska Svalbard Suède 50 203 42 42 56 17 83 34 77 OUI OUI OUI OUI (3 CIl (1) '"0 (1)
t:
variable OUI OUI OUI OUI OUI variable OUI OUI non OUI OUI OUI OUI OUI OUI OUI OUI OUI OUI (1) "0 t:: (1) (1) .~ :> (1) ;:l s:: o U OUI variable variable Référence Chesemore, 1969 Macpherson, 1969 Garrott et al.1983 Smits et al. 1988 Prestrud, 1992 Nielsen et al., 1994 Anthony, 1996 Eide et al., 2001 Dalerum et al., 2002 Jusqu'à maintenant, aucune étude n'a exploré les relations possibles entre les sites de tanière et la distribution des ressources alimentaires. Le renard arctique est généralement reconnu comme étant un prédateur opportuniste, se nourrissant principalement de rongeurs, de carcasses de phoques ou de grands ongulés, de poissons et invertébrés marins, et exploitant également lescolonies d'oiseaux marins et d'oies lorsqu'elles sont présentes. Dans la grande majorité de son aire de répartition, sa diète est cependant largement dominée par les lemmings (Dalerum et Angerbjorn 2000; Elmhagen et al. 2000; Frafjord 2000). Les importantes variations de populations souvent cycliques caractéristiques de ces micro-mammifères influencent largement la dynamique des populations de renards arctiques (Hersteinsson et al. 1989; Angerbjorn et al.
1995; Tannerfeldt et Angerbjorn 1998). Lors d'années de forte abondance de lemmings, la
proportion de renards reproducteurs augmente considérablement, ainsi que la taille des portées pouvant atteindre jusqu'à 18 renardeaux, la plus importante chez les carnivores (Tannerfeldt et
Angerbjorn 1998). À l'opposé, lors des creux de populations de lemmings, l'effort de
reproduction ainsi que la taille des portées diminuent de façon significative tandis que le taux de prédation sur les proies alternatives augmente (Angerbjorn et al. 1995; Tannerfeldt et Angerbjorn
1998; Bêty et al. 2001). Selon Roth (2003), les variations d'abondance des ressources marines
auraient également une influence sur la dynamique des populations côtières de renards arctiques, principalement lors de creux de population de lemmings. Finalement, Eide et al. (2004) ont également démontré l'influence des variations spatiales et temporelles des proies sur la taille et le
degré de chevauchement du domaine vital du renard arctique. Considérant l'influence marquée
des ressources alimentaires sur la reproduction du renard arctique, il est probable que la
distribution des tanières soit également liée à la distribution des ressources alimentaires. Aucune étude ne s'est penchée jusqu'à maintenant sur cette question.
L'objectif de cette étude était donc d'identifier tout d'abord les facteurs environnementaux (topographie, microclimat et distribution des ressources alimentaires) influençant la sélection d'un site de tanière chez le renard arctique à l'île Bylot. Malgré le grand nombre de tanières existantes dans une région, seulement quelques-unes d'entre elles sont
généralement utilisées répétitivement pour la reproduction. Une comparaison de l'environnement des tanières utilisées à des fins de reproduction et de celles non-utilisées pour la reproduction nous permettra d'identifier les différences existant entre ces deux catégories de tanières. Ce deuxième objectif permettra de mieux cerner les contraintes possibles auxquelles est exposé le renard arctique lors de sa période de reproduction.
STATUT DE LA COMMUNAUTÉ DE RENARDS ARCTIQUES ET ROUX DE L'ÎLE BVLOT
Au cours des derniers siècles, l'aire de répartition du renard roux a drastiquement changé à cause d'introductions anthropiques ou d'expansions naturelles de l'espèce. Le renard roux est maintenant le carnivore ayant l'aire de répartition la plus grande (Voigt 1987), s'étendant à travers la majeure partie de l'Europe, l'Asie, l'Amérique du Nord, l'Australie (où il a été introduit au cours du 1ge siècle) et une partie de l'Afrique du Nord.
Bien qu'indigène en Amérique, au nord du 40-45e parallèle, le renard roux était auparavant rare ou même absent dans le centre et l'est des États-Unis, ainsi que dans les forêts de feuillus où le renard gris (Urocyon cinereoargentus) était très présent jusqu'à la fin du 17e siècle
(Churcher 1959; Larivière et Pasitschniak-Arts 1996). Lors de la colonisation de l'Amérique du Nord (1650-1750), plusieurs renards roux européens ont été introduits, principalement pour la chasse, dans de nouveaux territoires où le renard roux était encore absent. Il semble y avoir un désaccord dans la littérature au niveau de la parité des espèces de renard roux provenant de l'Europe et celle déjà présente en Amérique (Voigt 1987). Certains auteurs soutiennent que le renard roux indigène, Vulpes fulva, serait une espèce différente de son cousin européen, Vulpes vulpes, et il s'en suit donc une confusion au niveau de laquelle des populations a par la suite étendu son aire de répartition. Audubon et Bachman (1854, cités par Churcher, 1959)
mentionnent néanmoins que le renard roux était absent jusqu'en 1750 au sud de la Pennsylvanie et ont documenté par la suite une expansion de son aire de répartition jusqu'en Georgie en 1850.
Godin (1977) soutient également que le renard roux s'était établi le long de la côte du sud-est des
États-Unis en 1750 et y repoussait graduellement le renard gris.
Une expansion nordique de la distribution du renard roux a également été notée plus
récemment. Au cours du 20e siècle, le renard roux a été observé dans des régions du nord de
l'Amérique où il n'avait encore jamais été signalé. D'après différentes informations provenant de communautés Inuit, le renard roux aurait été aperçu sur l'île de Baffin pour la première fois en 1918 puis aurait étendu graduellement son aire de répartition vers le nord jusqu'à atteindre les îles de Cornwallis et Ellesmere en 1962 (Macpherson 1964). La première mention de la présence
du renard roux sur l'île Bylot remonte à 1977 dans un rapport publié par Kempf et al. (1978).
Marsh (1938) signala également l'arrivée de quelques renards roux à Eskimo Point (Arviat) en 1932, puis à Chesterfield pendant l'hiver de 1933-1934, ce qui fut suivit par une hausse importante de la population dans les années suivantes. En Europe et en Russie, une même expansion de l'aire de répartition du renard roux vers de plus hautes latitudes et altitudes a également été observée (Chirkova 1968). D'après Lindstrom (1989), la population de renards
roux aurait environ triplé en Fennoscandinavie entre 1930 et 1960.
Conséquences de l'expansion du renard roux pour le renard arctique
Tout organisme vivant nécessite un apport d'énergie en provenance de son habitat afin de combler ses demandes énergétiques basales et répondre à ses besoins présents. Lorsque deux espèces similaires partagent un même habitat, la restriction des ressources mène souvent à une compétition entre les organismes pour l'accès à celles-ci. Deux différents type de compétition
peuvent se produire dans ce cas: une compétition par exploitation (interactions indirectes entre les individus dont les ressources sont diminuées par le compétiteur) ou par interférence
(interactions directes et physiques entre les individus pour l'accès aux ressources). Une autre
réponse possible à un manque de ressource peut être une modification de la niche écologique fondamentale d'un des organismes, résultant en l'exclusion d'un des compétiteurs de son habitat d'origine et donc en une ségrégation des deux espèces dans le territoire.
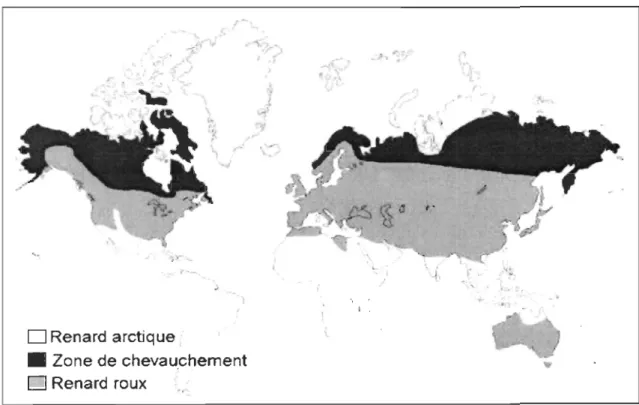
Dû aux importantes expanSIOns de l'aire de répartition du renard roux, il existe maintenant une zone importante de chevauchement dans la répartition géographique des renards roux et arctiques (figure 1). Une diminution importante de la répartition et de l'abondance du
renard arctique a également été observée, dans toute son aire de répartition circumpolaire, suite
aux invasions du renard roux (Marsh 1938; Chirkova 1968; Linnell et al. 1999). Différentes études ont été conduites sur les interactions entre les deux espèces. Grâce entre autres à sa plus
grande taille et à son agressivité, le renard roux est dominant par rapport au renard arctique
,.-.,tf
f' :j'"
\!
( '
-o
Renard arctique,• Zone de chevau.cryement
o
Renard rouxFigure 1: Aire de répartition actuelle des renards roux et arctiques (d'après Larivière et Pasitschniak-Arts,
(Rudzinski et al. 1982) et peut même être un prédateur de ce dernier (Frafjord et al. 1989). Ainsi, dans les zones de chevauchement des deux espèces, le renard roux conserve habituellement l'accès aux habitats les plus productifs et le renard arctique est confiné aux territoires plus nordiques ou de plus hautes altitudes et ainsi plus pauvres (Linnell et al. 1999). Hersteinsson and Macdonald (1992) ont proposé l'hypothèse selon laquelle la limite sud de l'aire de répartition du
renard arctique serait déterminée par la compétition avec le renard roux. Lors du choix d'une
tanière, le renard arctique semble également éviter les sites à proximité de ceux utilisés par le renard roux (Marsh 1938; Tannerfeldt et al. 2002). Cette importante pression du renard roux autant au niveau de l'alimentation que du choix d'un site de tanière semble donc avoir un effet
important sur la dynamique des populations de renards arctiques. En Fennoscandinavie, la
présence du renard roux semble avoir été un facteur important dans la dégradation des
populations de renards arctiques. Le renard arctique est maintenant menacé d'extinction dans
cette région malgré sa protection depuis 1928 (Hersteinsson et al. 1989). Aucune étude n'a été conduite en Amérique du Nord sur l'effet de la compétition interspécifique et les dangers potentiels de l'expansion nordique de l'aire de répartition du renard roux sur les populations de renards arctiques.
Compte tenu de la grande similarité entre les niches écologiques des renards roux et arctiques (Elrnhagen et al. 2002), ainsi que de la limitation des ressources disponibles dans l'arctique, il est fort possible qu'une importante compétition s'installe entre les deux espèces.
L'accès à une tanière de reproduction s'avère une dimension importante de la niche écologique
des deux espèces et pourrait donc représenter une source de compétition. Il est donc important de
bien comprendre l'écologie actuelle du renard arctique et les facteurs influençant son choix d'un
augmenter. Un suivi intensif de la communauté de renards à la limite de la distribution actuelle du renard roux est également primordial. Ce suivi nous permettra de mieux comprendre les impacts potentiels que pourrait impliquer une augmentation d'abondance du renard roux sur les populations canadiennes de renards arctiques. L'île Bylot est située à la limite nordique de l'aire de répartition actuelle du renard roux et fait partie du Parc National du Canada de Sirmilik depuis 2001. Elle représente donc l'endroit idéal pour instaurer un tel programme de suivi de la communauté de renards dans l'arctique canadien. Le dernier objectif de cette étude était donc d'établir un protocole de suivi des populations de renards de l'île Bylot qui constituera un élément important dans le suivi de l'intégrité écologique de l'écosystème du Parc National du Canada de Sirmilik.
En résumé, l'utilisation de tanières est une pratique courante chez plusieurs carnivores. Cependant, les exigences en terme d'habitat de tanière varient d'une espèce à l'autre en fonction de leurs besoins particuliers. Chez le renard arctique, plusieurs caractéristiques topographiques ont déjà été proposées comme jouant un rôle dans la sélection d'un site de tanière dans différentes régions de sa répartition circumpolaire. Les objectifs du présent projet sont donc d'identifier les caractéristiques d'habitat sélectionnées par le renard arctique lors de l'établissement d'une tanière à l'île Bylot et, en second lieu, de déterminer les variables d'importance pour cette espèce lors de la sélection d'une tanière particulière pour s'y reproduire, parmi l'ensemble de toutes celles disponibles. Troisièmement, considérant les conséquences probables de l'empiétement progressif du renard roux sur l'aire de répartition du renard arctique, le dernier objectif de l'étude est d'établir un programme de suivi à long terme de la communauté de renards de l'île Bylot.
BIBLIOGRAPHIE
Angerbjorn, A., M. Tannerfeldt, A. Bjarvall, M. Ericson, J. From, et E. Noren. 1995. «Dynamics of the Arctic Fox Population in Sweden». Annales Zoologici Fennici 32:55-68.
Anthony, R. M. 1996. «Den use by arctic foxes (Alopex lagopus) in a subarctic region of western Alaska». Canadian Journal of Zoology-Revue Canadienne De Zoologie 74:627-631. Arjo, W. M., T. l Bennett, et A. J. Kozlowski. 2003. «Characteristics of CUITent and historical
kit fox (Vulpes macrotis) dens in the Great Basin Desert». Canadian Journal of Zoology-Revue Canadienne De Zoologie 81 :96-102.
Bêty, l, G. Gauthier, J. F. Giroux, et E. Korpimaki. 2001. «Are goose nesting success and
lemming cycles linked? Interplay between nest density and predators». Oikos 93:388-400.
Chesemore, D. L. 1969. <<Den ecology of the Arctic fox in northern Alaska». Canadian Journal of Zoology-Revue Canadienne De Zoologie 47:121-129.
Chirkova, A. F. 1968. «The relationship between arctic fox and red fox in the far north.». Problems of the North Il: 111-113.
Churcher, C. S. 1959. «The specific status of the new world red fox». Journal of mammalogy 40:513-520.
Dalerum, F., et A. Angerbjorn. 2000. <<Arctic fox (Alopex lagopus) diet in Karupelv valley, East Greenland, during a summer with low lemming density». Arctic 53:1-8.
Dalerum, F., M. Tannerfeldt, B. Elmhagen, D. Becker, et A. Angerbjorn. 2002. <<Distribution, morphology and use of arctic fox Alopex lagopus dens in Swedem>. Wildlife Biology 8:185-192.
Eide, N. E., l U. Jepsen, et P. Prestrud. 2004. «Spatial organization of reproductive Arctic foxes
Alopex lagopus: responses to changes in spatial and temporal availability of prey». Journal of Animal Ecology 73:1056-1068.
Eide, N. E., C. Nellemann, et P. Prestrud. 2001. «Terrain structure and selection of denning areas by arctic foxes on Svalbard». Polar Biology 24:132-138.
Elmhagen, B., M. Tannerfeldt, et A. Angerbjorn. 2002. «Food-niche overlap between arctic and red fox es». Canadian Journal of Zoology-Revue Canadienne De Zoologie 80:1274-1285.
Elmhagen, B., M. Tannerfeldt, P. Verucci, et A. Angerbjorn. 2000. «The arctic fox (Alopex lagopus): an opportunistic specialist». Journal ofZoology 251:139-149.
Frafjord, K. 2000. <<Do arctic and red fox es compete for food?». Zeitschrift Fur Saugetierkunde-International Journal of Mammalian Biology 65:350-359.
Frafjord, K., D. Becker, et A. Angerbjorn. 1989. <<Interactions between Arctic and Red Foxes in Scandinavia -- Predation and Aggression». Arctic 42:354-356.
Garrott, R. A., L. E. Eberhardt, et W. C. Hanson. 1983. <<Arctic fox den identification and
characteristics in northern Alaska». Canadian Journal of Zoology-Revue Canadienne De Zoologie 61 :423-426.
Godin, A. J. 1977. Wild mammals of New England. Johns Hopkins University Press.
Blatimore. 304pp.
Hersteinsson, P., A. Angerbjorn, K. Frafjord, et A. Kaikusalo. 1989. «The Arctic Fox in Fennoscandia and Iceland - Management Problems». Biological Conservation 49:67-8l. Hersteinsson, P., et D. W. Macdonald. 1992. «Interspecific Competition and the
Geographical-Distribution of Red and Arctic Foxes Vulpes-Vulpes and Alopex-Lagopus». Oikos 64:505-515.
Kolowski, J. M., et A. Woolf. 2002. «Microhabitat use by bobcats in southern Illinois». Journal of Wildlife Management 66:822-832.
Larivière, S., et M. Pasitschniak-Arts. 1996. «Vulpes Vulpes». Mammalian Species 537:1-11. Lindstrom, E. 1989. «The role of medium-sized carnivores in the Nordic boreal forest». Finnish
Game Research 46:53-63.
Linnell, J. D.
c.,
O. Strand, et A. Landa. 1999. «Use of dens by red Vulpes vulpes and arcticAlapex lagapus foxes in alpine environrnents: Can inter-specific competition explain the non-recovery ofNorwegian arctic fox populations?». Wildlife Biology 5:167-176.
Macpherson, A. H. 1964. <<A northward range extension of the red fox in the eastern Canadian arctic.». Journal of mammalogy 45:138-140.
- . 1969. The dynamics of Canadian arctic fox populations., Pages 1-49, Canadian Wildlife Service Report Series No.8. Ottawa, Ontario, Canada, Govemment of Canada.
Marsh, D. B. 1938. «The influx of the red fox and its colour phases into the barren lands». The Canadian Field-Naturalist 52:60-61.
McLoughlin, P. D., H. D. Cluff, et F. Messier. 2002. «Denning ecology ofbarren-ground grizzly bears in the central Arctic». Journal of Mammalogy 83:188-198.
Nielsen, S. M., V. Pedersen, et B. B. Klitgaard. 1994. <<Arctic Fox (Alapex lagapus) Dens in the Disko Bay Area, West Greenland». Arctic 47:327-333.
Prestrud, P. 1992. <<Physical Characteristics of Arctic Fox (Alapex lagapus) Dens in Svalbard».
Arctic 45:154-158.
Pruss, S. D. 1999. «Selection of natal dens by the swift fox (Vulpes velax) on the Canadian prairies». Canadian Journal of Zoology-Revue Canadienne De Zoologie 77:646-652. Roth, J. D. 2003. «Variability in marine resources affects arctic fox population dynamics».
Journal of Animal Ecology 72:668-676.
Rudzinski, D. R., H. B. Graves, A. B. Sargeant, et G. L. Storm. 1982. <<Behavioral interactions ofpenned red and arctic foxes». Journal ofWildlife Management 46:877-884.
Ruggiero, L. F., D. E. Pearson, et S. E. Henry. 1998. «Characteristics of Arnerican marten den sites in Wyoming». Journal of Wildlife Management 62:663-673.
Slough, B. G. 1999. «Characteristics of Canada Lynx, Lynx canadensis, maternai dens and denning habitat». Canadian Field-Naturalist 113:605-608.
Smits, C. M. M., C. A. S. Smith, et B. G. Slough. 1988. <<Physical characteristics of arctic fox
Tannerfeldt, M., et A. Angerbjorn. 1998. «Fluctuating resources and the evolution of litter size in the arctic fox». Oikos 83:545-559.
Tannerfeldt, M., B. Elmhagen, et A. Angerbjorn. 2002. <<Exclusion by interference competition? The relationship between red and arctic foxes». Oecologia 132:213-220.
Voigt, D. R. 1987. Red Fox, Pages 379-392 in M. Novak, J. A. Baker, M. E. Obbard, and B. Malloch, eds. Wild furbearers management and conservation in North America. North Bay, ON, Ontario Trappers Association.
CHAPITRE 2
DEN ECOLOGY OF AN ARCTIC MAMMAL: SELECTION OF DENNING SITES AND REPRODUCTIVE DENS BY ARCTIC FOXES ON BYLOT ISLAND, NUNAVUT,
CANADA
Manuscrit en préparation pour une publication.
Guillaume Szorl, Dominique Berteaux 1 and Gilles Gauthier2
1 Chaire de recherche du Canada en conservation des écosystèmes nordiques, Département de biologie et Centre d'études nordiques, Université du Québec à Rimouski, 300 allée des Ursulines,
Rimouski, Qc, Canada, G5L 3Al
2 Département de biologie et Centre d'études nordiques, Université Laval, Québec, Qc, Canada,
G. SZOR, D. BERTEAUX AND G. GAUTHIER. Den ecology of an arctic mammal: selection of dennning sites and reproductive dens by arctic foxes on Bylot Island, Nunavut, Canada.
The utilization of refuges is a common strategy for numerous animal species in order to
maximize their survival and that of their offspring. The majority of carnivores use natura! or excavated cavities as rest sites or for parturition and cub rearing. Den site choice, particularly for
reproductive purpose, is rarely random but often based on two main factors: the ease to escape
from predators and the local abundance of food resources. Due to the small number of predators
and the low predictability of cyclic prey species present in arctic ecosystems, characteristics used
by arctic carnivores when selecting a denning area may differ from those used by southern species. We examined the environment and characteristics of 83 arctic fox (Alopex lagopus) dens
on the south plain of Bylot Island, Nunavut, Canada. We compared topography, microc1imate
and food resource distribution between denning sites and random locations in a 425 km2 study
area (landscape scale) and with other potential den sites in a 100 m radius around dens (local
scale) to determine characteristics used by arctic foxes when selecting a denning area. Den sites
were preferably located in mounds or slopes and were c10ser to streams than expected under a
random scenario. Foxes preferred to excavate dens at sites with low snow coyer at spring, high
ground temperature and depth to permafrost, and steep and southerly exposed slopes with sandy
substrate. Of the 83 dens examined in this study, only 27 were used at least once to rear a litter
between 2003 and 2005 inc1usively. Applying resource selection function analysis (RSF), we
found that an attractive force (distribution of food resources) and a repulsive one (presence of
other dens in the vicinity) affected selection of dens for reproduction. Despite the high density of
dens in our study area (1.84 / 10 km2), we suggest that high quality dens available for
G. SZOR, D. BERTEAUX ET G. GAUTHIER. Écologie des tanières d'un mammifère arctique: sélection des sites de tanière et des tanières de reproduction chez le renard arctique à l'île Bylot, Nunavut, Canada.
L'utilisation de refuges est une stratégie courante chez plusieurs espèces animales afin de maximiser leur survie ainsi que celle de leur progéniture. La plupart des carnivores utilisent des cavités, naturelles ou excavées, comme site de repos ou comme lieu de mise-bas et d'élevage des jeunes. Le choix d'un site de tanière, plus particulièrement pour la reproduction, semble rarement
aléatoire et est souvent basé sur deux principaux facteurs: la facilité d'échapper à la prédation et l'abondance locale de ressources alimentaires. Considérant le nombre peu élevé de prédateurs ainsi que la faible prédictibilité des proies cycliques présentes dans les écosystèmes arctiques, il
est possible que les caractéristiques utilisées par un carnivore arctique, lors de la sélection d'un site de tanière, diffèrent de celles utilisées par les espèces du sud. Nous avons examiné l'environnement et les caractéristiques de 83 tanières de renards arctiques (Alapex lagapus) sur la plaine du sud de l'île de Bylot, Nunavut, Canada. Nous avons comparé la topographie, le microclimat et la distribution des ressources alimentaires entre les sites de tanières et des sites aléatoires dans notre aire d'étude s'étalant sur 425 km2 (échelle du paysage). De plus, les
caractéristiques de chaque tanière ont également été comparées à celles d'autres sites potentiels, dans un rayon de 100 m autour de la tanière (échelle locale). Les tanières étaient
préférentiellement excavées dans des buttes ou pentes naturelles et étaient généralement plus près d'un ruisseau qu'attendu d'une distribution aléatoire. Les renards préféraient creuser leur tanière
aux sites ayant une faible couverture de neige au printemps, une température du sol et une profondeur au pergélisol plus élevée, situés sur des pentes abruptes et exposées au sud et ayant un substrat sablonneux. Des 83 tanières examinées dans cette étude, seulement 27 ont été utilisées au
moins une fois pour élever une portée, entre 2003 et 2005 inclusivement. À partir de fonctions de sélection des ressources (RSF), nous avons identifié une force positive (distribution des ressources alimentaires) et une négative (présence d'autres tanières à proximité) influençant la sélection d'une tanière de reproduction chez le renard arctique. Malgré la forte densité de tanières
dans notre aire d'étude (1,84 / 10 km2), nous suggérons que les tanières de haute qualité
INTRODUCTION
Understanding habitat selection processes and underlying causes is a fundamental goal in animal ecology. Various factors can influence habitat use by individuals, but the general assumption is that individuals will select habitats where their fitness will be maximized in accordance to the activity they need to perform. For many camivorous mammals, access to a den is essential for successful breeding and cub rearing (Moehlmann 1989). The location of these dens is rarely random but often based on factors such as the ease of escape from predators (Ruggiero et al. 1998; Slough 1999) or the proximity of available food resources (Pruss 1999;
Arjo et al. 2003). In the arctic tundra, arctic foxes (Alapex lagapus) excavate dens where they
give birth to cubs and rear them until the mid-summer weaning period (Macpherson 1969).
Access to a den is believed to be essential for successful reproduction, but they can also be used as shelters during winter or summer (Prestrud 1992a). Physical characteristics of arctic fox dens have been described throughout most of the species' range (Chesemore 1969; Macpherson 1969; Garrott et al. 1983; Smits et al. 1988; Prestrud 1992b; Nielsen et al. 1994), but few studies have considered the influence of environmental characteristics on their spatial distribution (Eide et al. 2001). Habitat components such as distance to water sources, vegetation height or distance to a road have been shown to influence the location of den sites in other carnivores (Ruggiero et al. 1998; Pruss 1999; Henner et al. 2004). Identifying factors influencing habitat selection can provide important cIues on the ecology, physiology as weIl as on constraints to which a given species is exposed.
Our objective was to determine environmental characteristics influencing den site
selection by an arctic mammal, the arctic fox. Eide et al. (2001) have demonstrated the influence
topographical and microclimatic characteristics such as altitude, slope inclination and orientation,
snow coyer, or presence of streams and other water bodies, have been suggested to influence the location of arctic fox dens (Chesemore 1969; Macpherson 1969; Garrott et al. 1983; Smits et al. 1988; Prestrud 1992b; Nielsen et al. 1994). However, to our knowledge, the actual selection for these variables have never been studied through a utilisation/availability analysis. Considering the low productivity of the arctic tundra, food resource distribution may also be an important driving force for the selection of an adequate denning area. Due to the difficulties of measuring the distribution and abundance of food in space and time, no study has considered the influence of food resources on the location of arctic fox dens. Eide et al. (2004) did, however, show that the size of arctic foxes' home range vary according to the distribution and predictability of food resources. In this study, we investigated the importance of topography, microclimate and food
resource distribution on the selection of denning sites by arctic foxes at two spatial scales. At the landscape sc ale, we evaluated the influence of topography, water bodies, surrounding habitat and the distribution of lemmings and nesting geese, the two main prey items of arctic foxes. At a micro-scale, we assessed the influence of snow cover, substrate type, slope aspect and inclination, and soil depth and temperature.
Despite a relatively high abundance of dens excavated by arctic fox es throughout the tundra, only a small proportion of those are repeatedly used for reproduction (Prestrud 1992a; Anthony 1996). The criteria used to select dens for reproduction are unclear. Assuming that an individual selects a den so as to maximize its fitness, reproductive dens should differ from non-breeding dens in sorne characteristics of importance to reproducing arctic fox es. Identifying these variables should allow for a better understanding of the constraints to which arctic foxes are exposed during reproduction. The second objective of this study was therefore to identify
environmental features used by arctic foxes when choosing a reproductive den. Again, we evaluated the relative importance of topography, microclimate and the distribution of food resources.
MATERlALS AND METHODS Study area
We worked on the south plain of Bylot Island (73°N, 800W), Nunavut, Canada (Fig. 1).
The area is characterized by large upland mesic plateaus, covering ca. 90% of the landscape
(Masse et al. 2001), intersected by several valleys with lowland moist habitats. This is the most
important breeding site of the Greater Snow Goose (Chen caerulescens atlantica) with more than
55 000 breeding individuals (Reed et al. 2002). Many other migrating bird species nest in the area but their density is relatively low compared to snow geese (Lepage et al. 1998). Two species of lemmings occur in the area: the brown lemming (Lemmus sibericus), which pre fers wetlands and
feeds largely on graminoids (Gauthier et al. 1996; Negus and Berger 1998), and the collared
lemming (Dicrostonyx groenlandicus), which prefers drier habitats and feeds primarily on Dryas
and other forbs (Rodgers and Lewis 1986). The arctic fox is the main terrestrial predator of the
system. It preys mainly on lemmings but also feeds on snow goose eggs and chicks, especially
when rodent populations drop (Bety et al. 2001).
More than 40 dens had been found opportunistically on the south plain of Bylot island
between 1993 and 2002 and were already known at the start of the study. In the summer of 2003
we performed an extensive search for dens by foot and snowmobile to complete the survey
throughout the study area. We covered an area of approximately 60 km of coastline that extended
425 km2 (Fig. 1). It was delimited to the west by the sea, and to the north and east by polar semi-deserts where preliminary exploration showed that dens where either rare or absent. Logistic constraints prevented us from surveying the area to the south. To minimize the risks of including arctic hare burrows in our analysis, only structures with more than one entrance were considered as arctic fox dens. Field work performed in subsequent years indicated that virtually aU dens (n
=
83) in the study area had been found by 2003.Landscape characteristics of denning sites
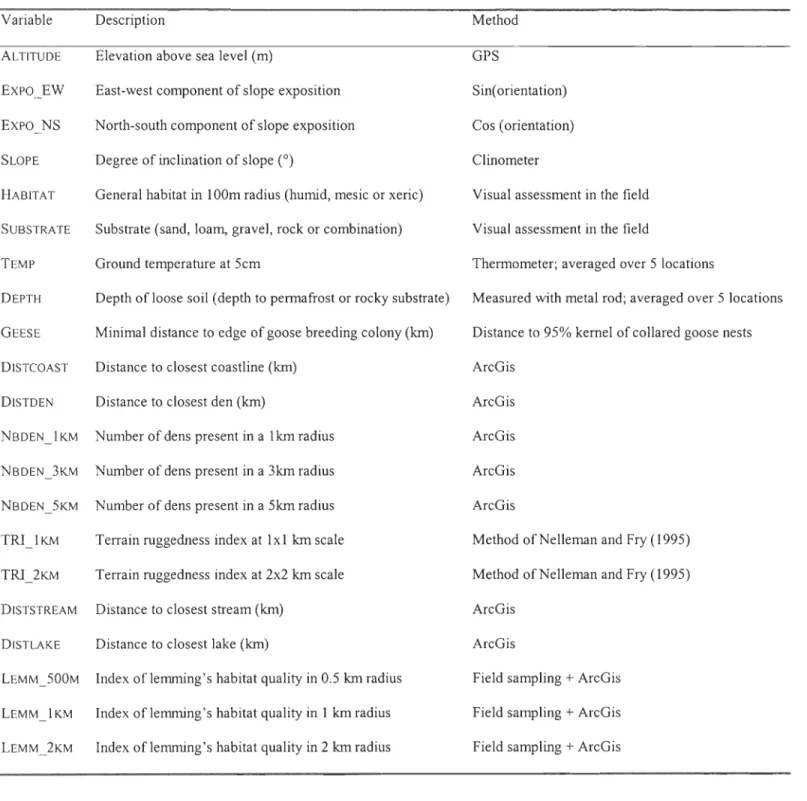
Each den was positioned using a Global Positioning System (GPS) receiver (± 5 m) and
its surrounding environment was first described at a coarse landscape level. Topographie heterogeneity was evaluated using the terrain ruggedness index (TRI) proposed by NeUemann and Fry (1995). The TRI was derived from a 1 :50 000 topographie map (with 20 m contour intervals) at 2 different scales (1 x 1 km and 2 x 2 km). The whole study area was divided into quadrats (of either 1 x 1 km, n
=
448 or 2 x 2 km, n=
131), within which four transects of a fixed length (1 or 2 km) were positioned in a rosette, centered in the quadrat, at 45° intervals. The TRI was calculated using the following equation:Terrain ruggedness index (TRI)
=
(TNC x TNF) / (TNC + TNF)where TNC = total number of contour lines intercepted by the transect and TNF = total number of changes in aspect (ups and downs) along the transect (Nellemann and Fry, 1995). For each quadrat, the transect with the highest index value was retained. Each den was attributed the TRI of the quadrat in which it was located. Aspect and slope inclination were measured with a GPS
and clinometer, respectively. The habitat surrounding the den (100 m radius) was visually classified as xeric, mesic, or moi st according to the dominant habitat class. Distance to closest coastline, lake and stream were measured on a map using ArcGIS (ESRI® ArcMap™9.0)
Two variables were used to estimate food resource distribution at the landscape scale. The first one was the distance to the main snow goose breeding colony of Bylot island. S ince 1991, several hundred adult females are marked with plastic neck-collars annually during brood-rearing (Gauthier et al. 2001). Each year, systematic searches of collared females on nests are conducted throughout the colony and the position of each nest is recorded using a GPS. Assuming that collared geese are distributed randomly in the colony, we used the 95% kemel of the position of their nests from 2000 to 2005, to map the average extent of the colony. We th en measured the distance separating dens from the closest edge of the colony with ArcGIS and used it as an index of goose availability for fox es.
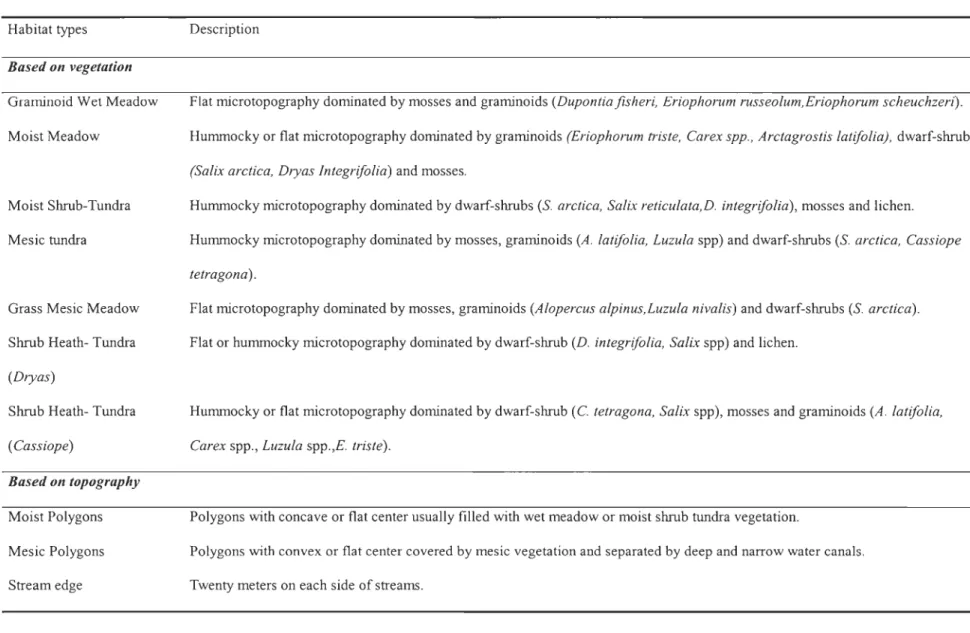
Second, an index of lemming habitat quality (ILHQ) was derived from the vegetation communities and topographical features, in order to reflect lemming availability to foxes. The study area was classified into ten habitats: graminoid wet meadow, moist meadow, moist shrub tundra, mesic tundra, graminoid mesic tundra, shrub-heath tundra (dominance of Cassiope), shrub-heath tundra (dominance of Dryas), stream edge, moist polygons and mesic polygons (table 1; see Duclos et al. (2006) for detailed habitat description). Lemming's relative use of each habitat was estimated through counts of lemming burrows and faeces during summer 2004. Since both faeces and burrows were observed to persist for multiple years, the derived index represents a multi-annual average use by lemmings of each habitat category. We sampled ten sites per
habitat. Sampling sites were chosen in the field by selecting patches of at least 3000 m2 of uniform habitat, to avoid influence of other surrounding habitats. For each sampling site, we positioned two paraIlel transects (20 m apart) on which three 1.5 x 1.5 m quadrats were located 20 m apart. We estimated the number of lemming faeces within each quadrat. We also counted lemming burrows in six 40 m2 quadrats (2 x 20 m) positioned in-between the quadrats used to
estimate faeces. The total N per habitat for both faeces and burrows is thus 60 quadrats (l0 sites x 2 transects x 3 quadrats). For each site, the mean number of scats and burrows were transformed to values constrained between 0 and 1. This was accomplished by dividing the mean number of faeces or burrows of site i by the highest value obtained across aIl sites. The value for faeces and
burrows were then added up for each site to obtain a value between 0 and 2 representing lemming utilization of the site. An index of lemming habitat use (ILHU) was then created for each habitat
category by calculating the mean value for aIl sampled sites of a given habitat. Using a digital vegetation map and aerial photographs of Bylot Island, we then measured the proportion occupied by each of the ten habitats within a 0.5, 1 and 2 km radius around each den using
ArcGIS. An index of lemming habitat quality (ILHQ) was then assessed for each den, at these
three scales, by summing the product of the proportion occupied by each habitat (Pi) by its index
of lemming habitat use (ILHQ
=
r.(Pj*
ILHUj )).To determine whether arctic foxes select for particular environrnental characteristics when establishing their den, we also measured each variable at random locations (n = 92) within the study area. We compared characteristics of den locations to those of random locations using two-sample t-tests or Mann-Whitney U tests, depending on the normality of the variable. G-tests were used to compare nominal variables.
Local characteristics of denning sites
Preliminary observations showed that most dens were excavated in natural ridges and/or in slopes of 10° or more (95% of dens satisfied at least one of these conditions). Therefore, we assumed that the presence of at least one of these features was essential for the establishment of a den. Sites with such characteristics (hereafter called "potential denning sites") were abundant in the study area and did not appear limiting. To determine the importance of micro-climatic and micro-topographic features on the selection of a denning site, we compared den characteristics with those of nearby potential denning sites. In the field, we randomly selected two to four
potential denning sites, depending of their availability, within a 100 m radius of each studied den using a table of random angles and distances. For each den and potential site, we measured the same variables as follows. We measured height of ridges, by averaging maximum height on each side, and/or the inclination and orientation of the slope using a clinometer and GPS, respectively.
We estimated ground snow cover in a 10 m radius «5%, 5-25%, 25-50%, 50-75%, >75%) at the beginning of June. We classified the substrate as sand, loam, gravel, rock or a combination of these. FinaIly, we measured ground temperature (5 cm below surface) and depth of loose soil (depth to permafrost or rocky substrate) at five random locations on the den and its periphery. We compared heights of ridges and ground temperatures using paired sampled t-tests. We applied Wilcoxon signed-rank tests to compare snow cover (using the median of each class of cover),
slope aspect and inclination, as weIl as depth of loose soil because data were not distributed normally. Finally, we compared types of substrate between dens and potential den sites using G-tests.
Comparisons of reproductive and non-breeding dens
From 2003-2005, 83 dens were visited at least twice during the summer (mid-June and mid-July) to check for signs of fox presence. Dens where cubs were observed at least once during this period were c1assified and will be referred to as "reproductive dens" in the following sections, while those with no reproduction observed during the three years of the study were c1assified as "non-breeding dens". Since arctic foxes have been observed to move their litter between dens during the rearing period, reproductive dens were further divided into "natal" (cubs observed at beginning of breeding season) or "rearing" (movement of litter directly observed or cubs only appeared late in the breeding season) dens. We compared environmental characteristics of each set of dens using ANOVAs or Kruskal-Wallis tests, depending on the normality of the data, followed by Dunn's multiple comparison tests, to determine if any variable could explain the different utilisation made of these three categories of dens. Table 2 summarizes the complete set of variables measured at each den.
Second, we used resource selection function (RSF) analysis (Manly et al. 1993) to determine the relative importance of each variable in distinguishing between reproductive and non-breeding dens. Since the movement of a litter from its natal den to another rearing den may be prompted by our visits and the trapping conducted at dens, rearing dens were exc1uded from this analysis and only natal dens were considered as reproductive dens. We used logistic regression to estimate the resource selection probability functions (RSPF) which took the form:
where w*(x) is the probability of a den being used for reproduction for a given combination of
variables (XÙ and their coefficients (fJJ We only included in the models variables that were not strongly correlated to each other (Pearson correlation < 0.7) and for which measurement were repeated at most dens. SNOW was therefore eliminated for RSF analysis because of missing values for many dens while TRI_2KM, LEMM_1KM and NBRDEN_5KM were removed because of multicollinearity with other variables. Finally, only one variable of the following pairs
was used in a given model due to strong correlation: ALTITUDE/INCLINATION and
DISTDENIEXPO_EW. We performed multiple logistic regressions (MLR) , using forward and backward stepwise approaches, to do a preselection of the best variables allowing for discrimination of the two classes of dens. Different models were then built and evaluated using Akaike's information criterion (AIC) to select the best while most parsimonious RSF models.
Due to our small sample size, we used the second-order AIC (AICc) (Burnham and Anderson 2002). McFadden's Rho-squared statistic was also calculated for each model to assess model performance. McFadden's Rho-squared is intended to mimic r-squared used in linear regression (Steinberg and Colla 2004) but tends to have lower values. According to Hensher and Johnson (1981), values between 0.20 and 0.40 should be considered very satisfactory. The discriminatory power of each model was also evaluated through receiver operating characteristic (ROC) curves analysis. According to Pearce and Ferrier (2000), the area under ROC curves represents an adequate estimation of the discrimination performance of a mode!. Estimated by the c-statistic, ROC values between 0.7 and 0.8 are considered acceptable while values between 0.8 and 0.9 are considered excellent discrimination (Hosmer and Lemeshow 2000). The area under the curve was evaluated using the Mann-Whitney W statistic approach proposed by Hanley and McNeil (1982).
RESULTS
Index of lemming habitat quality
The index of lemming habitat use (ILHU) varied according to habitat type
(Kruskal-Wallis Test Statistic = 40.499, p<O.OOl) but every habitat categories did not always differ
significantly from each other. Of the ten habitat categories, stream edge was the most heavily used by lemmings while lemmings scats and burrows were almost totally absent in graminoid wet
meadow (Fig. 2).
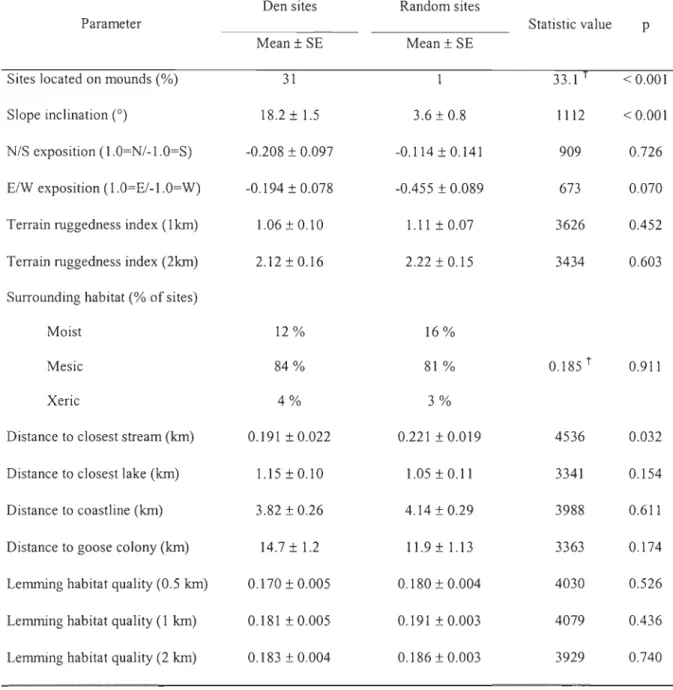
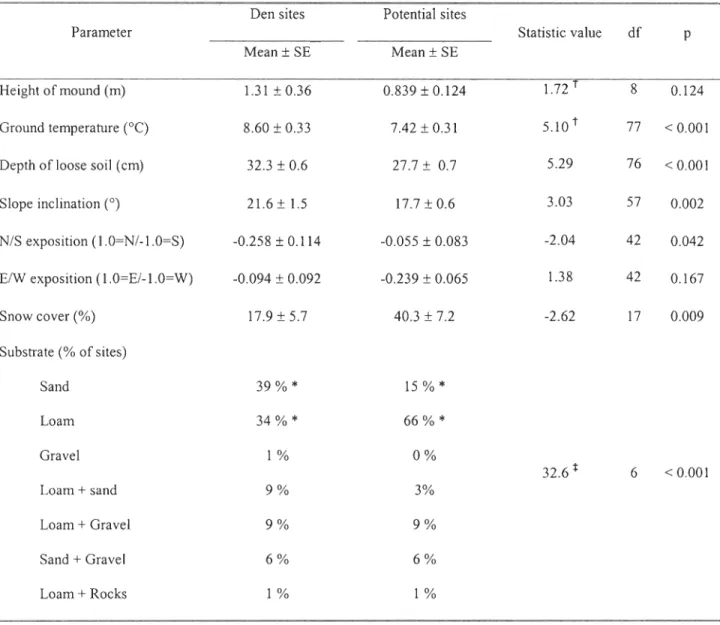
Landscape characteristics of den sites
We compared the environment surrounding 83 fox dens to that surrounding 92 random sites (Table 3). First, we confirmed the strong selection for mounds. Furthermore, dens were
located on steeper slopes than random sites and were also located doser to streams than expected.
Finally, neither slope orientation, terrain ruggedness, distance to lakes, surrounding habitat
(moist, mesic or xeric), distance to coastline, distance to goose colony nor lemming habitat quality influenced the location of arctic fox dens.
Local characteristics of denning sites
Comparison of dens characteristics with those of potential denning sites revealed that
snow coyer on dens was lower than on other potential sites while ground temperature and depth of loose soil was significantly higher at dens (Table 4). Dens were also usually located on steeper
slopes than other potential sites and had a more southerly orientation, but there were no significant differences in the height of mounds selected by arctic foxes. Finally, dens were
preferentially excavated in sandy substrate while loam was avoided despite its relatively high
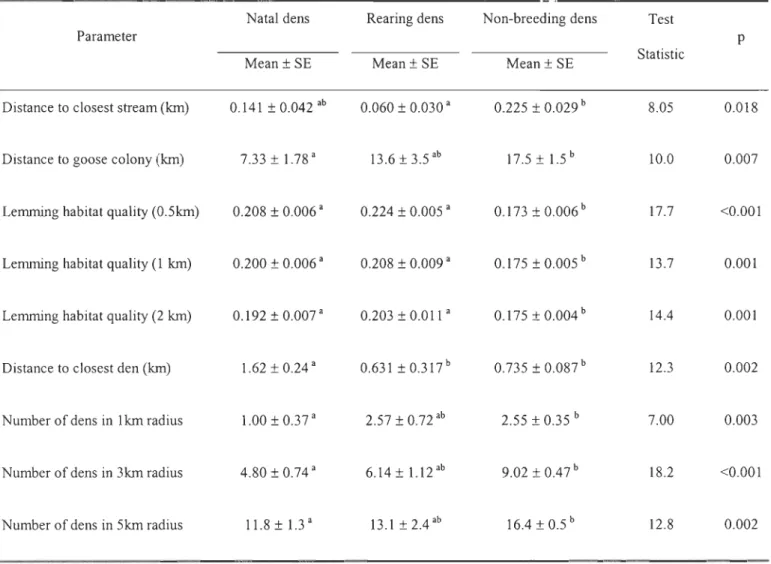
Comparisons of reproductive and non-breeding dens
We compared 83 dens (20 natal, 7 rearing and 56 non-breeding) which were monitored over three consecutive years (2003-2005). Natal dens were closer to the goose breeding colony than non-breeding dens and were farther away from another den than non-breeding or rearing dens (Table 5). The number of dens in a 1, 3 and 5 km radius was significantly lower around
natal dens than non-breeding ones. FinalIy, rearing dens were closer to a stream than breeding dens and both natal and rearing dens were situated in better lemming habitats than non-breeding dens at aIl scales.
Lemming's habitat quality around reproductive (natal and rearing) dens (1 km radius) was
correlated to the distance separating the den from the goose colony (one outlier excluded from analysis; Fig. 3). Reproductive dens closer to the goose colony were situated in low quality lemming habitats while those farther away from the colony were located in high quality habitats for lemmings. The opposite relationship is observed wh en considering the distribution of ail existing dens pooled together (Fig. 3).
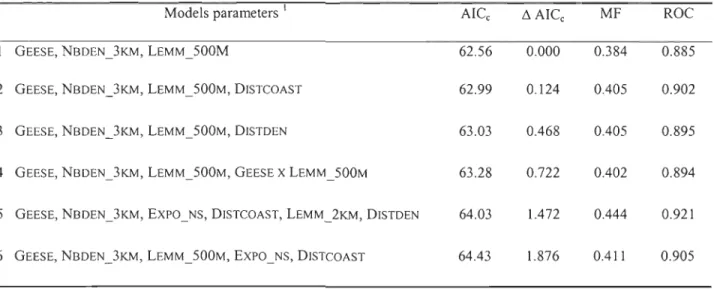
Seventy-six dens (20 natal and 56 non-breeding) were used to build the RSFs using logistic regressions. Nine variables were retained through the forward and backward stepwise approach: GEESE, NBDEN_3KM, LEMM_500M, LEMM_2KM, EXPO_NS, DISTCOAST, DISTDEN, DISTSTREAM and TRI_IKM. Table 6 summarizes the six best models obtained. AlI six models had a ~AICc lower than 2.0, suggesting substantial evidence for each of them
discrimination of the two sets of dens inc1uded three variables (distance to the goose breeding colony, number of dens in the vicinity, and lemming's habitat quality) and had the foUowing equation:
W*(x)
=
{exp(V)}
/
{l+exp(V)}
where
v
= -2.393 - O.074(GEESE) - O.375(NBDEN_3KM) + 24.2(LEMM_500M)According to this model, the probability of a den being used for reproduction increases with lemmings habitat quality around it, while it decreases as its distance to the colony and the number of dens in a three kilometres radius increase. These three variables were aU retained in the top six models, which strongly suggests that they were the most important criteria explaining the selection of reproductive dens by arctic foxes. This model had a high discriminatory power as its likelihood of correctly c1assifying a den as reproductive, within a pair of reproductive and non-breeding dens, was 88.5%. Three additional variables were retained in the other five top models: distance to c10sest coastline (negative effect as distance increases), distance to c10sest den (positive effect as distance increases), and north/south component of slope exposition (negative effect as exposition becomes northward).
We used the most parSlmomous model (model 1) to predict the probability of reproduction at each den of the study area (Fig. 4a) and compared it with the actual frequency of utilisation of each den by arctic fox es (Fig. 4b). According to the model, dens located inside the limits of the goose colony usually had a lower probability of use than those located in its periphery, which was consistent with field observations. Comparison of both figures shows that
only seven dens had a high predicted probability ofutilization (> 50%) but were not actually used as natal dens between 2003 and 2005. Of those seven dens, four were actuaIly rearing dens while only three dens were truly never used for reproductive purpose. While most natal dens had a high predicted probability of use, five out of the 20 natal dens were used more often than predicted by the model. FinaIly, when plotting the actual frequency of utilization of a den for reproduction against the probability predicted by our model (Fig. 5), we can see that highly used dens usuaIly have a higher probability predicted by our model, confirming the high adequacy of our model in predicting arctic fox use.
DISCUSSION
Selection of denning sites
Few landscape variables explained the spatial distribution of fox dens on Bylot Island. The availability of favourable topographical structures, such as ridges and slopes, and the proximity of streams, were the only features selected by arctic foxes.
According to Macpherson (1969), the permafrost layer in the arctic tundra represents a physical barrier for arctic fox es trying to dig new dens in spring. Den sites may then be limited to areas where the active layer is sufficiently deep and where soil conditions allow burrowing.
Ridges and mounds typically consist of warm mineraI soil with coarse texture, are weIl drained,
and have a deep layer of soil over the permafrost or bedrock (Swanson 1996). Terrains with steep slopes should also be weIl drained and thus reduce the formation of permafrost. Our analysis at the local scale further highlighted the high importance of slope aspect and inclination on the selection of a specific denning site by foxes. The prevalence of arctic fox dens on southerly rather than northerly exposed slopes has often been reported (Chesemore 1969; Garrott et al. 1983;