HAL Id: insu-01485449
https://hal-insu.archives-ouvertes.fr/insu-01485449
Submitted on 8 Mar 2017
HAL is a multi-disciplinary open access
archive for the deposit and dissemination of
sci-entific research documents, whether they are
pub-lished or not. The documents may come from
teaching and research institutions in France or
abroad, or from public or private research centers.
L’archive ouverte pluridisciplinaire HAL, est
destinée au dépôt et à la diffusion de documents
scientifiques de niveau recherche, publiés ou non,
émanant des établissements d’enseignement et de
recherche français ou étrangers, des laboratoires
publics ou privés.
Vertical distribution of ozone at the terminator on Mars
Anni Määttänen, Franck Lefèvre, Sabrina Guilbon, Constantino Listowski,
Franck Montmessin
To cite this version:
Anni Määttänen, Franck Lefèvre, Sabrina Guilbon, Constantino Listowski, Franck Montmessin.
Ver-tical distribution of ozone at the terminator on Mars. Sixth International Workshop on the Mars
Atmosphere: Modelling and Observations, Jan 2017, Grenade, Spain. �insu-01485449�
VERTICAL DISTRIBUTION OF OZONE AT THE TERMINATOR ON MARS.
A. M¨a ¨att¨anen, F. Lef`evre, S. Guilbon, C. Listowski, F. Montmessin, LATMOS/IPSL, UVSQ Universit´e Paris-Saclay, UPMC Univ. Paris 06, CNRS, Guyancourt/Paris, France (anni.maattanen@latmos.ipsl.fr).
Introduction
The SPICAM/Mars Express UV solar occultation dataset gives access to the ozone vertical distribution via the ozone absorption in the Hartley band (220—280 nm). The first results on the ozone vertical distribution from SPICAM were published by [Lebonnois et al. (2006)] using the stellar occultation data. We will present ob-servations of ozone profiles derived from SPICAM solar occultations in the ultraviolet [M¨a¨att¨anen et al. (2013)]. The occultation datasets allow the retrieval of vertical profiles of the abundance of gaseous species, aerosol optical depth and the ˚Angstr¨om coefficient, which can be, through some hypotheses, related to particle size [Montmessin et al. (2006)]. A data analysis code in-cluding a correction for mechanical oscillations induced by the MARSIS radar antennae, has been developed [M¨a¨att¨anen et al. (2013)] and was used in the analysis. All solar occultations of adequate quality between orbit numbers 0-10000 (Mars Years 27-30) have been anal-ysed. The dataset spans 4 MY with a good seasonal and spatial coverage. We will present a global overview of the results on the vertical ozone distribution and de-scribe a new method we have developed for comparing the observations to the model.
Dataset
SPICAM (SPectroscopie pour l‘Investigation des Car-act´eristiques Atmosph´eriques de Mars) has been observ-ing Mars in the ultraviolet (118–320 nm) and in the near infrared (1–1.7µm) ranges since 2004. Details on the
instrument and the observation modes can be found in [Bertaux et al. (2006)]. In the occultation mode, the UV channel gives access to the vertical distribution of CO2, O3, and aerosols. Here we focus on the UV solar
occultation dataset of about 650 profiles. The occul-tation technique is self-calibrated, since the spectra are normalised with the observed solar spectrum to acquire atmospheric transmissions. The transmission spectra are fitted with the Beer-Lambert law, which takes into account extinction by gaseous species (CO2 and O3 in
the UV) and aerosols. Aerosol extinction is modeled with the so-called alpha-model, providing access to the ˚Angstr¨om coefficient, which depends on the size of the aerosols. For results on the aerosol vertical distribution see [M¨a¨att¨anen et al. (2013)].
Seasonal behavior of the ozone profiles
Figure 1 displays the climatology of the O3 profiles
derived from the SPICAM solar occultations and the ozone profiles of the Mars General Circulation Model of the Laboratoire de m´et´eorologie dynamique (LMD MGCM). Here the comparison is made between local profiles inverted from observations using the onion peel-ing method and profiles extracted from the model at the grid point nearest to the terminator. The largest ozone amounts are found in spring (Ls = 20-50◦) at high
northern latitudes (60◦N-90◦N). This result is
consis-tent with the observations of the O3 column performed
by SPICAM in nadir mode [Perrier et al. (2006)] and with the LMD MGCM simulations that predict max-imum O3 amounts in the dry polar vortices in winter
and spring [Lef`evre et al. (2008)]. However, our results shed light on the vertical distribution of ozone during that period: we find maximum O3densities at about 20
km (note that the high aerosol opacity prevents obser-vations below 10 km) and the top of the O3springtime
polar layer is located at about 30 km. These altitudes are significantly higher than those simulated by the LMD MGCM, which predicts an O3polar layer that is
essen-tially confined below 20 km (right column). This is also the case at southern polar latitudes (60◦S-90◦S), where
O3is detected by SPICAM solar occultations in autumn
and spring above 20 km. This result is consistent with the O3profiles derived by stellar occultation at the same
time [Lebonnois et al. (2006)]. Both techniques show that more ozone is present above 20 km in the polar vortices than calculated by the LMD MGCM, which suggests that the dehydration in high latitudes extends higher in the real atmosphere than in the model.
At low southern latitudes (0-30◦S), the SPICAM
so-lar occultations show between 30 and 40 km a clear sea-sonal maximum centred on aphelion (Ls = 70◦). This
re-sult corroborates the nighttime SPICAM measurements by stellar occultation [Lebonnois et al. (2006)] and is also well reproduced by the LMD MGCM (right col-umn). The buildup of this seasonal layer is mainly caused by changes in the vertical distribution of H2O
[Clancy and Nair (1996)]. Around aphelion, the pro-duction of hydrogen radicals is much reduced above the low hygropause and so is the ozone loss. In contrast, no ozone is detected by SPICAM at low latitudes in the per-ihelion season. This can be explained by the dramatic increase in ozone-destroying hydrogen radicals that fol-low the rise of the hygropause level at that season.
SPICAM ozone vertical distribution
Figure 1: Seasonal evolution of ozone in different latitude bands as observed by SPICAM and modeled by the LMD Mars GCM. The y-axis is altitude between -10 and 70 km above the areoid, the x-axis is the solar longitude, and the color scale goes from 0 to 4 x 10⁹molecules/m3.
SPICAM ozone vertical distribution
How to compare modeled and observed profiles of a photochemically reactive species at the terminator?
Due to the rapid variation of ozone due to photolysis at sunrise and sunset, a classical comparison of local den-sity profiles is not appropriate for solar occultations that are acquired at the terminator. The spherical symmetry hypothesis made in the onion-peeling vertical inversion method is not valid for photochemically active species (e.g., ozone) around terminator (see Figure 2). Here, we are using a method commonly used in the Earth com-munity. This method exploits the slant profiles (ozone concentration integrated along the line-of-sight of the in-strument) for the comparison. For each occultation, we
Figure 2: Inhomogeneity of ozone around the terminator and its consequences on the analysis: Modeled ozone profiles (col-ors) around the terminator during the occultation as a function of the solar zenith angle and examples of three LOS of SPI-CAM (symbols).
have modeled with the 1D version of the LMD MGCM the ozone vertical and horizontal distribution with high solar zenith angle (or local time) resolution around the terminator (Figure 2). It can be seen that around the ter-minator the ozone distribution is quite far from spherical symmetry. We then integrate the model results follow-ing the lines-of-sight of the occultation (calculated from the observation geometry) to construct the modeled slant profiles (Figure 3).
So far, we have studied six occultations in this man-ner. In four out of six studied occultations, the slant profile comparison shows quite a good agreement be-tween the model and the observations (for an exam-ple, see Figure 3). However, clear differences are seen in some cases, where the observed ozone densities are clearly smaller than the ones extracted from the model (not shown).
We have also tested the possible improvement of the vertical profile comparison by performing the onion-peeling vertical inversion of these slant profiles. The comparison of the model with SPICAM is slightly im-proved in some cases, but naturally the differences seen in the occultations where SPICAM observes clearly less
ozone than predicted by the model (not shown) persist. In any case, the vertical inversion method we use even for inverting the LOS-integrated model profiles includes the spherical symmetry hypothesis, and thus the com-parison of the local profiles is biased.
Thus, the most pertinent comparison is the one be-tween the slant profiles. To completely avoid the prob-lem of the spherical symmetry hypothesis, the inho-mogeneity of the atmosphere (for temperature, den-sity/pressure and photochemically active trace gas con-centrations) should be fully accounted for within the vertical inversion method. This will be achieved within the UPWARDS project (Work Package lead: BIRA, Belgium).
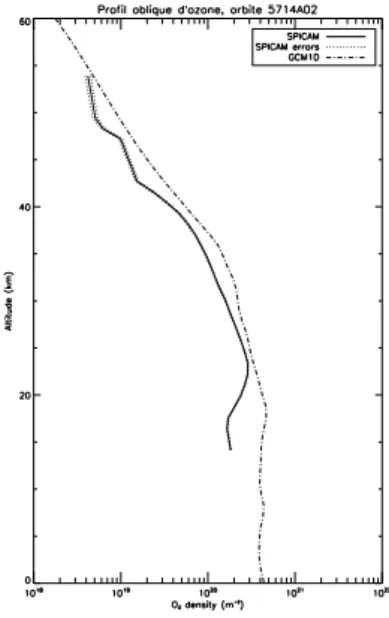
Figure 3: Ozone concentrations integrated along the line-of-sight (slant profiles) from the model (dash-dot line) and the observations (solid line).
Conclusion
We will present a four-year climatology of the ozone vertical distribution on Mars acquired from the analysis of SPICAM UV solar occultations, and we compare it to the modeled climatology. Due to strong spatial variation of ozone across the solar terminator, a classical compar-ison of local density profiles is not appropriate for solar occultations. We introduce here a method of extract-ing and comparextract-ing the slant profiles also from model results (often used in the Earth community). When the slant profiles are compared, some occultations still present large differences when compared to the model: in two out of six studied cases SPICAM sees a lot less ozone than predicted by the model. For a fully real-istic observation-model comparison for photochemical
REFERENCES
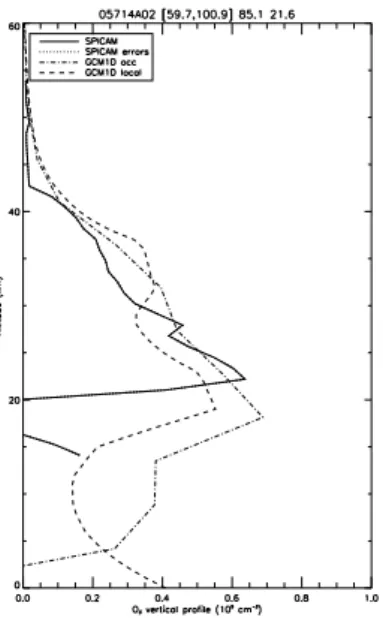
Figure 4: Ozone vertical profiles from SPICAM (solid line) and the model (dash-dot line) after vertical inversion of the slant profiles from Figure 3, and comparison to the modeled local profile at the terminator (dashed line).
species one should compare the slant profiles or account for the heterogeneity of the atmosphere around the termi-nator in the vertical inversion method (dedicated Work Package in the European project UPWARDS H2020).
Acknowledgements
SPICAM is funded by the French Space Agency CNES and this work has received funding from the European Union’s Horizon 2020 Programme (H2020-Compet-08-2014) under grant agreement UPWARDS-633127.
References
[Bertaux et al. (2006)] Bertaux, J., Korablev, O., Per-rier, S., Qu´emerais, E., Montmessin, F., Leblanc, F., Lebonnois, S., Rannou, P., Lef`evre, F., Forget, F., Fedorova, A., Dimarellis, E., Reberac, A., Fonteyn, D., Chaufray, J. Y., Guibert, S., Oct. 2006. SPICAM on Mars Express: Observing modes and overview
of UV spectrometer data and scientific results. Jour-nal of Geophysical Research (Planets) 111 (E10), 10–+.
[Clancy and Nair (1996)] Clancy, R. T., Nair, H., 1996. Annual (perihelion-aphelion) cycles in the photo-chemical behavior of the global Mars atmosphere. J. Geophys. Res. 101, 12785–12790.
[Lebonnois et al. (2006)] Lebonnois, S., Qu´emerais, E., Montmessin, F., Lefevre, F., Perrier, S., Bertaux, J.-L., Forget, F., 2006. Vertical distribution of ozone on Mars as measured by SPICAM/Mars Express us-ing stellar occultation. Journal of Geophysical Re-search 111, E09S05, doi:10.1029/2005JE002643. [Lef`evre et al. (2008)] Lef`evre, F., Bertaux, J.-L.,
Clancy, R. T., Encrenaz, T., Fast, K., Forget, F., Lebonnois, S., Montmessin, F., Perrier, S., Aug. 2008. Heterogeneous chemistry in the atmosphere of Mars. Nature 454, 971–975.
[Listowski et al. (2011)] Listowski, C., M¨a¨att¨anen, A., Montmessin, F., Lef`evre, F., Bertaux, J.-L., Feb. 2011. Solar Occultation with SPICAM/UV onboard Mars Express: Retrieving Aerosol and Ozone Pro-files. In: Forget, F., Millour, E. (Eds.), Mars Atmo-sphere: Modelling and observation. pp. 191–194. [M¨a¨att¨anen et al. (2013)] M¨a¨att¨anen, A., Listowski, C.,
Montmessin, F., Maltagliati, L., Reberac, A., Joly, L., Bertaux, J.-L., Apr. 2013. A complete clima-tology of the aerosol vertical distribution on Mars from MEx/SPICAM UV solar occultations. Icarus 223, 892–941.
[Montmessin et al. (2006)] Montmessin, F., Qu´emerais, E., Bertaux, J.-L., Korablev, O., Rannou, P., Lebonnois, S., 2006. Stellar oc-cultations at UV wavelengths by the SPICAM instrument: Retrieval and analysis of Martian haze profiles. J. Geophys. Res. 111, E09S09, doi:10.1029/2005JE002662.
[Perrier et al. (2006)] Perrier, S., Bertaux, J. L., Lefevre, F., Lebonnois, S., Korablev, O., Fedorova, A., Montmessin, F., 2006. Global distribution of total ozone on Mars from SPICAM/MEX UV mea-surements. Journal of Geophysical Research 111, E09S06, doi:10.1029/2006JE002681.