Titre:
Title:
How much is enough? Assessing the influence of neighborhood
walkability on undertaking 10-minutes walks
Auteurs:
Authors: Geneviève Boisjoly, Rania Wasfi et Ahmed El-Geneidy
Date: 2018
Type:
Article de revue / Journal articleRéférence:
Citation:
Boisjoly, G., Wasfi, R. & El-Geneidy, A. (2018). How much is enough? Assessing the influence of neighborhood walkability on undertaking 10-minutes
walks. Journal of Transport and Land Use, 11(1), p. 143-151. doi:10.5198/jtlu.2018.1059
Document en libre accès dans PolyPublie
Open Access document in PolyPublie
URL de PolyPublie:
PolyPublie URL: https://publications.polymtl.ca/4796/
Version: Version officielle de l'éditeur / Published versionRévisé par les pairs / Refereed Conditions d’utilisation:
Terms of Use: CC BY
Document publié chez l’éditeur officiel
Document issued by the official publisher
Titre de la revue:
Journal Title: Journal of Transport and Land Use (vol. 11, no 1) Maison d’édition:
Publisher: U of MN Center for Transportation Studies and the World Society of Transport and Land Use Research (WSTLUR)
URL officiel:
Official URL: https://doi.org/10.5198/jtlu.2018.1059 Mention légale:
Legal notice:
Ce fichier a été téléchargé à partir de PolyPublie, le dépôt institutionnel de Polytechnique Montréal
This file has been downloaded from PolyPublie, the institutional repository of Polytechnique Montréal
http://publications.polymtl.ca
Vol. 11 No. 1 [2018] pp. 143–151
Abstract: Neighborhood walkability is increasingly perceived as an effective way to support individuals’ health, since living in a walkable environment is associated with increases in utilitarian walking. Yet, while people are more likely to walk in more walkable neighborhoods, increased walkability can also lead to walking shorter distances, thus mitigating the positive health outcomes associated with walkable en-vironments. Given that the World Health Organization recommends physical activity to be performed in sessions of at least 10 minutes, the aim of this research is to explore the relationship between neighborhood walkability and individuals’ likeliness of walking in sessions of at least 10 minutes. A multilevel logistic regression is generated using data from the Montreal, Canada, 2013 Origin-Destination Survey. The results show that the probability of walking at least 10 minutes for shopping purposes is equally high in the 80-89 and 90-100 Walk Score neighbor-hoods. In contrast, car ownership is a strong predictor of walking at least 10 minutes, especially in higher Walk Score neighborhoods. These findings suggest that transport policies aimed at reducing car ownership, combined with land use policies, can be most effective in supporting the minimal 10-minute sessions of walking for shopping purposes. This study provides a nuanced assessment of walkability and is of relevance to researchers and planners wishing to assess and develop policies for increasing health benefits through active transportation.
Keywords: walkability, health, trip duration, distance
1 Introduction
Increasing attention is given to neighborhood walkability as a way to improve individuals’ health, since living in a walkable environment is associated with increases in utilitarian walking (Cervero & Kockel-man, 1997; Manaugh & El-Geneidy, 2011; Owen, Humpel, Leslie, BauKockel-man, & Sallis, 2004; Wasfi,
How much is enough? Assessing the influence of neighborhood
walkability on undertaking 10-minute walks
Geneviève Boisjoly
Rania Wasfi
McGill University McGill University
genevieve.boisjoly@mail.mcgill.ca rania.wasfi@mail.mcgill.ca
Ahmed El-Geneidy
McGill University ahmed.elgeneidy@mcgill.ca Article history: Received: October 31, 2016 Received in revised form: September 22, 2017Accepted: November 26, 2017 Available online: January 30, 2018
Copyright 2018 Geneviève Boisjoly, Rania Wasfi & Ahmed El-Geneidy http://dx.doi.org/10.5198/jtlu.2018.1059
ISSN: 1938-7849 |Licensed under the Creative Commons Attribution – Noncommercial License 3.0
The Journal of Transport and Land Use is the official journal of the World Society for Transport and Land Use (WSTLUR) and is published and sponsored by the University of Minnesota Center for Transportation Studies. This paper
144 JOURNAL OF TRANSPORT AND LAND USE 11.1
Dasgupta, Eluru, & Ross, 2015). Yet, while research has shown that people are more likely to walk in more walkable neighborhoods, increased walkability can also lead to walking shorter distances, thus mitigating the positive health outcomes associated with walkable environments. This trade-off is illus-trated in Figure 1, which represents walking behavior for shopping purposes in the Montreal Census Metropolitan Area, Canada. As Walk Score (a commonly used walkability index) increases, the propor-tion of individuals walking increases, but the average distance walked by those individuals decreases.
Given that the World Health Organization recommends physical activity to be performed in ses-sions of at least 10 minutes to result in positive health outcomes (World Health Organization, 2010), the aim of this research is to identify which Walk Score category is associated with a greater proportion of people undertaking walking trips of at least 10 minutes for shopping. This study is of relevance to researchers and planners wishing to assess and develop policies for increasing health benefits through active transportation.
Figure 1: Proportion of walkers (individuals who made at least one walking trip in the day) and average distance walked by those individuals by Walk Score level based on shopping trips
(Source: Montreal 2013 Origin-Destination Survey and Walk Score)
2
Data and methods
This study explores the relationship between neighborhood walkability and individuals’ likeliness of walking in sessions of at least 10 minutes in the Montreal Census Metropolitan Area (CMA), com-bining Walk Score data (Walk Score, 2016) and data from the 2013 Origin-Destination (OD) Survey (Agence Métropolitaine de Montréal, 2013).
The Walk Score data was retrieved in 2013 from the Walk Score website using the Walk Score API. Walk Score assigns a rank between 0 (low walkability) and 100 (high walkability) based on population density, street connectivity, block lengths and proximity to amenities such as grocery stores, restaurants, bars and schools. Amenities are weighted using a distance-decay function. It is important to note that, as street connectivity was incorporated into Walk Score after 2013, our data does not account for this factor. Given its proprietary nature, the exact algorithm of Walk Score is unknown. Nevertheless, it is widely used by researchers as Walk Score is available online. This allows a direct comparison of the results of various studies based on a common index. Furthermore, while other indices of walkability have been developed by researchers, previous studies have shown that Walk Score is highly correlated with other
walkability indices (Manaugh & El-Geneidy, 2011). Accordingly, and since Walk Score provides an easy-to-communicate measure of walkability, this study uses Walk Score.
The 2013 OD survey is a trip-based dataset that provides information about all trips made by all individuals in a household in a day. Trip information includes mode, purpose, origin and destination. Since Walk Score mainly captures access to local amenities, this study focuses on shopping trips. Also, given the availability of data, only home-based shopping trips are selected. The data is then aggregated at the individual level to create the variable of interest to this study: whether an individual did a least one shopping trip of at least 10 minutes (850m) by walking. The distance walked is calculated based on the street network distance, and only individuals who did at least one home-based shopping trip, by any mode, are included in the sample. Finally, each individual is assigned a Walk Score based on his or her home location.
To assess the likelihood of an individual making at least one walking trip of at least 10 minutes for shopping purposes, a multilevel logistic regression is conducted. As done in previous studies (Wasfi, Ross, & El-Geneidy, 2013; Witten et al., 2012), individuals are placed in neighborhoods (96 municipal sectors in this study) to account for any differences imposed by the neighborhood, and not controlled for through the Walk Score. For example, neighborhoods might exhibit differences in terms of perceived safety, presence of vegetation or cultural habits, which likely influence individuals’ travel behavior be-yond the variables controlled for in this study. We accordingly hypothesize that behavior will be clus-tered within neighborhoods, since we do not account for every neighborhood factor that could affect behavior. The regression is thus performed at the individual and neighborhood levels.
The independent variables included in the model are presented in Table 1. Income, personal and household characteristics are derived from the 2013 OD survey. Walk Scores are grouped in six catego-ries. As we are specifically interested in the variations between the middle and highest Walk Scores and given the lower number of individuals in the lower Walk Scores, all Walk Scores below 50 are grouped into one category, and the reference category is the highest Walk Score (90-100).
To control for household characteristics, income and car access are included in the regression mod-els. The number of cars per households was obtained from the 2013 OD survey, and was used to derive whether individuals have access to a car. The income data was also obtained with the 2013 OD survey. Income was included to isolate the effect of car access, which decreased by about 5 % after including income. This was done through a step-wise process and the model remained stable throughout the process. While car access and income are typically highly correlated, the correlation coefficient between car access and income is relatively low in our study (0.398). This is partially due to the use of categorical variables. Car access is also expected to be correlated with Walk Score. In our sample, the proportion of individuals with car access is increases as Walk Score decreases: 12% of individuals residing in Walk Score 90-100 have access to a car, compared to 62% in the lowest Walk Score neighborhood. Never-theless, the correlation between the two variables was tested (0.381) and a stepwise process was used to confirm the stability of the model.
Furthermore, an activity bias variable (whether an individual made at least one trip by walking or cycling, for a purpose other than shopping) was created to control for physical activity habits of indi-viduals. Furthermore, sex, age, whether an individual is employed full-time, and household size were included. The likelihood ratio test for the multi-level analysis was found to be statistically significant in both models ((Prob > Chi2) < 0.05), hence supporting the use of a multilevel analysis. The likelihood ratio test compares the log likelihood of the multilevel model with the equivalent single-level model, and indicates whether the log likelihood values of the models are statistically different. Our results show that the log likelihood values of the multilevel models are statistically different from the single-level models (and closer to zero).
146 JOURNAL OF TRANSPORT AND LAND USE 11.1
The relationship between Walk Score and walking behavior for shopping purposes was also tested using a multilevel Poisson model. The same independent variables were used, but the dependent variable was defined as the number of walking trips of at least 10 minutes for shopping purposes. The results were consistent with the results of our multilevel regression model predicting the likelihood of an in-dividual undertaking a walking trip of at least 10 minutes for shopping purposes: for all variables, the direction and significance (sig < 0.01, sig < 0.05 or sig < 0.1) of the coefficient was the same.
3 Results
The results of the logistic regression modelling the likelihood of an individual undertaking a walking trip of at least 10 minutes for shopping purposes are presented in Table 2. Interestingly, the odds of undertaking such trip is not statistically different for individuals residing in neighborhoods with Walk Scores between 70-79 and 80-89 than for individuals residing in the most walkable neighborhoods (Walk Score 90-100). Importantly, the odds ratio associated with the 80-89 Walk Score variable is 0.98, highlighting a negligible effect compared to the highest Walk Score category. In other words, holding all other variables constant, individuals residing in Walk Score 80-89 are as likely as individuals residing in Walk Score 90-100 to walk at least 10 minutes for shopping purposes.
Furthermore, car access is a strong and statistically significant predictor of making a walking trip of 10 minutes or more for shopping purposes. Individuals having access to a car are much less likely to undertake a walking trip of 10 minutes for shopping purposes. Within the same Walk Score category and holding all other variables constant, the odds of walking at least 10 minutes for individuals without
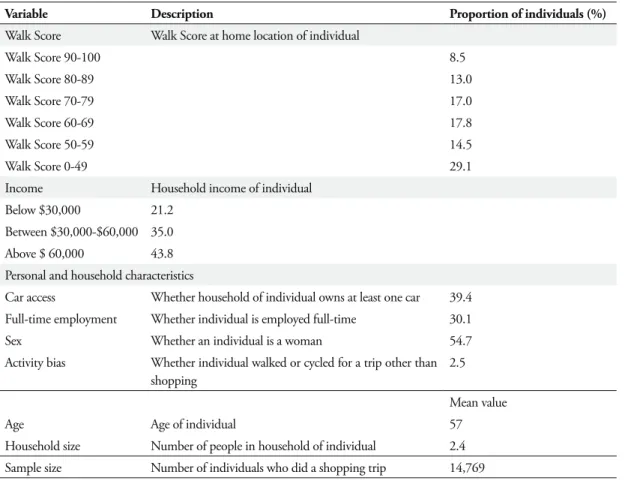
Table 1: Description of the variables and descriptive statistics
Variable Description Proportion of individuals (%) Walk Score Walk Score at home location of individual
Walk Score 90-100 8.5 Walk Score 80-89 13.0 Walk Score 70-79 17.0 Walk Score 60-69 17.8 Walk Score 50-59 14.5 Walk Score 0-49 29.1
Income Household income of individual
Below $30,000 21.2
Between $30,000-$60,000 35.0
Above $ 60,000 43.8
Personal and household characteristics
Car access Whether household of individual owns at least one car 39.4 Full-time employment Whether individual is employed full-time 30.1
Sex Whether an individual is a woman 54.7
Activity bias Whether individual walked or cycled for a trip other than shopping
2.5 Mean value
Age Age of individual 57
Household size Number of people in household of individual 2.4 Sample size Number of individuals who did a shopping trip 14,769
car access are 55% lower than for individuals with car access. A variable controlling for the number of car per household, instead of a dummy variable for car access, was also tested. The results were consistent with the models presented below, although the effect the “number of car” variable was slightly lower. For example, every additional car in an individual’s household was associated with a reduction of 52% in the odds of walking at least 10 minutes for shopping purposes, compared to a 55% reduction for individuals that have access to at least one car.
With respect to income, individuals with a household income greater than $60,000 have greater odds than the reference group (household income below $30,000). Age, household size and full-time employment are all significant predictors and are negatively associated with walking, while activity bias is positively associated with walking, as expected. Sex is not a significant predictor of the odds of walking at least 10 minutes in this study.
For comparison purposes, the odds of walking regardless of the duration were also modelled using the same methodology, and the results are presented in Table 2 (right). The results show that greater odds of walking are associated with higher Walk Scores, as found in the literature (Wasfi et al., 2015). With respect to the control variables, car access, higher income, age, greater household size, full-time employ-ment, and activity bias are significantly associated with lower odds of walking, which is consistent with the literature (Manaugh & El-Geneidy, 2011; Wasfi et al., 2015). With respect to the gender, whereas Wasfi et al. (2015) found that women are more likely to walk for utilitarian purposes than men, our study shows no statistical significance regarding the odds of walking for shopping purposes.
The intra-class coefficient (ICC) represents the clustering within the neighborhoods. In our study, the ICC are very low (0.02 and 0,04), suggesting that the odds of walking (and odds of walking at least 10 minutes) is only minimally correlated within neighborhoods. Nevertheless, the results of the likelihood-ratio test (Prob > chi2) confirm that that the neighborhoods should be controlled for to avoid estimation biases. In other words, although the correlation within neighborhoods is minimal, such cor-relation does have an effect on the estimation of the models. As highlighted by Rabe-Hesketh and Skro-ndal (2012), not accounting for clustering of the data can result in incorrect estimation of the model.
148 JOURNAL OF TRANSPORT AND LAND USE 11.1
4 Predicted
probabilities
To illustrate the findings discussed above, the predicted probabilities are presented in Figure 2 for indi-viduals with and without access to a car, for each Walk Score category. The first graph (top) shows the probability of an individual walking for at least 10 minutes for shopping purposes, while the second graph (bottom) shows the probability of an individual walking for shopping purposes.
Firstly, the results show that the probability of walking at least 10 minutes for shopping purposes is much lower than the probability of walking regardless of duration. From a health perspective, it is hence essential to look beyond the commonly discussed frequency of walking or proportion of individuals walking and look into the duration of walking. Secondly, while the probability of walking for shopping steadily increases with Walk Score, the probability of walking at least 10 minutes for shopping purposes plateaus as Walk Score reaches 80-89. Thirdly, the results suggest that car ownership has a greater effect than Walk Score on the probability of walking at least 10 minutes for shopping purposes, especially in higher Walk Score neighborhoods. For example, the probability of walking at least 10 minutes for an
Table 2: Results of the multilevel logit regressions modelling the likelihood of walking at least 10 minutes and the likelihood of walking
Odds of walking at least 10 minutes for shopping purposes
Odds of walking for shopping purposes
Odds ratio Sig. (P>z) Confidence interval Odds ratio Sig. (P>z) Confidence interval Constant 0.34 0.00 *** 0.20 0.56 2.89 0.00 *** 2.00 4.18
Walk Score (reference: 90-100)
Walk Score 80-89 0.98 0.90 0.75 1.29 0.70 0.00 *** 0.58 0.83
Walk Score 70-79 0.81 0.17 0.60 1.09 0.44 0.00 *** 0.36 0.54
Walk Score 60-69 0.61 0.00 *** 0.44 0.85 0.31 0.00 *** 0.25 0.39
Walk Score 50-59 0.50 0.00 *** 0.35 0.72 0.22 0.00 *** 0.17 0.29
Walk Score 0-49 0.20 0.00 *** 0.13 0.29 0.07 0.00 *** 0.05 0.09
Car access (reference: individual’s household does not own a car)
Car access 0.45 0.00 *** 0.36 0.56 0.44 0.00 *** 0.38 0.51
Income (reference: below $30,000)
$30,000-$60,000 0.87 0.12 0.73 1.04 0.67 0.00 *** 0.60 0.76
Above $60,000 0.70 0.00 *** 0.58 0.86 0.62 0.00 *** 0.54 0.71
Other control variables
Age 0.99 0.00 *** 0.99 1.00 0.99 0.00 *** 0.98 0.99
Employed full time 0.63 0.00 *** 0.52 0.77 0.84 0.01 ** 0.74 0.96
Household size 0.90 0.01 ** 0.83 0.97 0.85 0.00 *** 0.81 0.90
Sex (ref.=female) 1.05 0.47 0.91 1.22 1.04 0.41 0.94 1.15
Activity bias 1.81 0.00 *** 1.35 2.43 2.52 0.00 *** 1.99 3.20
Log likelihood -2996 -5235
Intra-class correlation coeff. 0.02 0.04
Prob > Chi2 0.0042 0.0000
individual without car access residing in a Walk Score 50-59 is higher than for an individual with car access residing in the highest Walk Score (90-100).
Figure 2: Predicted probabilities for a 40-year-old full-time employed woman without activity bias with a household income between $30,000 and $60,000 and based on the average household size of 2.44 people.
5 Policy
implications
Overall, the results suggest that the influence of neighborhood walkability on walking at least 10 min-utes for shopping purposes increases up until Walk Score 80-89. The probability is then equally high in the 80-89 and 90-100 Walk Score neighborhoods. In contrast, car access (as well as number of cars in a household) are strong predictors of walking at least 10 minutes, especially in higher Walk Score neighborhoods.
These findings suggest that land use policies need to be combined with transport policies aiming at reducing car ownership to be most effective in supporting the minimal 10-minute sessions of walking for shopping purposes. While the highest Walk Score category is often perceived as optimal by planners,
150 JOURNAL OF TRANSPORT AND LAND USE 11.1
aiming for a Walk Score between 80-89 would offer the same results in terms of 10-minute walking sessions for shopping, and would require less substantial land use changes. Where approximately 50% of the individuals in the sample of this study reside in areas with a Walk Score between 50 and 79, moderate land use changes accompanied by complementary transport strategies to reduce car ownership in these neighborhoods is likely to positively affect walking in the Montreal CMA, while taking into account the current land use. Furthermore, within boroughs with a middle to high Walk Score, reduc-tion in car ownership could significantly increase the number of people walking at least 10 minutes for shopping purposes without any modification to the land use.
Although walkability itself is associated with lower car ownership, other factors have been shown to significantly influence the number of carless households. Namely, recent research has found that car-sharing is strongly associated with a reduction in car ownership (Martin & Shaheen, 2011; Martin, Shaheen, & Lidicker, 2010; Ter Schure, Napolitan, & Hutchinson, 2012). Accordingly, policies sup-porting the expansion of car-sharing programs outside of central neighborhoods, and supsup-porting the participation in such programs, could be beneficial from a health perspective. Ter Schure et al. (2012) have also demonstrated that unbundled parking, combined with access to car-sharing, significantly reduces car ownership. In this regard, various parking policies can be explored as a way to discourage households from purchasing a vehicle. Furthermore, improving transit services in a neighborhood can contribute to reducing car ownership as greater accessibility to jobs by transit leads to lower amount of vehicles per capita (Gao, Mokhtarian, & Johnston, 2008). In sum, multiple transport policies can be implemented as a way to reduce car ownership and support healthy walking behavior in various walk-able environments.
There are some limitations to this study. Firstly, this study does not control for self-selection, which refers to the effect of residential location choice. For example, individuals that are inclined to walking might decide to move to areas that support this behavior. Accordingly, our results likely overestimate the relationship between the built environment and walking. Nevertheless, in a review of 38 studies on travel behavior, Cao, Mokhtarian, and Handy (2009) found that all 38 studies showed a significant influence of the built environment after controlling for self-selection. Future studies could use longi-tudinal data to further isolate the effect of the built environment on walking for shopping purposes. Secondly, this study measures walkability through the Walk Score index, which does not capture all at-tributes of the built environment that support walking. Other factors, such as presence of sidewalks and trees affect the walkability of a neighborhood, as demonstrated in a previous study (Herrmann, Boisjoly, Ross, & El-Geneidy, 2017). Furthermore, our 2013 data does not account for street connectivity. It is also important to acknowledge that this study is limited to home-based shopping trips. Further studies would benefit from incorporating various trip purposes and origins as well as other factors of the built environment to demonstrate a broader relationship between walking behavior and walkability. Never-theless, this study brings a practical perspective on how to support the achievement of the 10-minute bouts of walking through a combination of land use and transport policies, and provides a nuanced understanding of desirable levels of walkability.
6 Acknowledgments
The authors want to acknowledge Madhav Badami and the Transportation Research at McGill (TRAM) members for their feedback on this study. The authors would also like to thank Derrick Swallow for data preparation and trip distance calculation, and Meadhbh Maguire for her review of the manuscript. We also thank the three anonymous reviewers for their valuable comments. This research is funded by the Social Sciences and Humanities Research Council (SSHRC) and the Natural Sciences and Engineering Research Council (NSERC).
References
Agence Métropolitaine de Montréal. (2013). Mobility of people in the Montreal area, 2013 Origin-Destination Survey, version 13.2a
Cao, X., Mokhtarian, P., & Handy, S. (2009). Examining the impacts of residential self‐selection on travel behavior: A focus on empirical findings. Transport Reviews, 29(3), 359–395.
Cervero, R., & Kockelman, K. (1997). Travel demand and the 3Ds: Density, diversity, and design.
Transportation Research Part D: Transport and Environment, 2(3), 199–219.
Gao, S., Mokhtarian, P., & Johnston, R. (2008). Exploring the connections among job accessibility, em-ployment, income, and auto ownership using structural equation modeling. The Annals of Regional
Science, 42(2), 341–356.
Herrmann, T., Boisjoly, G., Ross, N., & El-Geneidy, A. (2017). The missing middle: Filling the gap
between walkability and observed walking behavior. Paper presented at the Transportation Research
Board 96th Annual meeting, Washington, DC.
Manaugh, K., & El-Geneidy, A. (2011). Validating walkability indices: How do different households respond to the walkability of their neighborhood? Transportation Research Part D: Transport and
Environment, 16(4), 309–315.
Martin, E., & Shaheen, S. (2011). The impact of carsharing on household vehicle ownership. ACCESS,
1(38), 22–27.
Martin, E., Shaheen, S., & Lidicker, J. (2010). Impact of carsharing on household vehicle holdings: Results from North American shared-use vehicle survey. Transportation Research Record, (2143), 150–158.
Owen, N., Humpel, N., Leslie, E., Bauman, A., & Sallis, J. (2004). Understanding environmental influences on walking: Review and research agenda. American Journal of Preventive Medicine, 27(1), 67–76.
Ter Schure, J., Napolitan, F., & Hutchinson, R. (2012). Cumulative impacts of carsharing and un-bundled parking on vehicle ownership and mode choice. Transportation Research Record, (2319), 96–104.
Walk Score. (2016). Walk Score. Accessed from https://www.walkscore.com/
Wasfi, R., Dasgupta, K., Eluru, N., & Ross, N. (2015). Exposure to walkable neighborhoods in urban areas increases utilitarian walking: Longitudinal study of Canadians. Journal of Transport and Health,
3(4), 440–447.
Wasfi, R., Ross, N., & El-Geneidy, A. (2013). Achieving recommended daily physical activity lev-els through commuting by public transportation: Unpacking individual and contextual influences.
Health and Place, 23, 18–25.
Witten, K., Blakely, T., Bagheri, N., Badland, H., Ivory, V., Pearce, J., Mavoa, S., Hinckson, E., Scho-field, G. (2012). Neighborhood built environment and transport and leisure physical activity: Find-ings using objective exposure and outcome measures in New Zealand. Environmental Health
Perspec-tives, 120(7), 971.
World Health Organization. (2010). Global recommendations on physical activity for health. Geneva, Switzerland: WHO Press.